Why are Students Absent and What Can We Do About It? - Amy Wiseman, Ph.D - E3 Alliance

Page created by Stephanie Reyes
 
CONTINUE READING
Why are Students Absent and What Can We Do About It? - Amy Wiseman, Ph.D - E3 Alliance
Why are Students Absent and
             What Can We Do About It?

  Amy Wiseman, Ph.D.               Joshua Childs, Ph.D.
Director of Research Studies   Assistant Professor of Education
         E3 Alliance             University of Texas, Austin

                                                     © 2017 E3 Alliance
Why are Students Absent and What Can We Do About It? - Amy Wiseman, Ph.D - E3 Alliance
E3 Alliance is a Catalyst For Educational Change
                 in Central Texas
                                 Mission

                   E3 Alliance uses objective data and focused
                 community collaboration to align our education
                systems so all students succeed and lead Central
                           Texas to economic prosperity

                         E3 Alliance serves as the
                    Central Texas regional P-16 Council

                                                  © 2017 E3 Alliance
Why are Students Absent and What Can We Do About It? - Amy Wiseman, Ph.D - E3 Alliance
2.4 Million
                     Student Absences in
                    Central Texas per Year

Source: E3 Alliance analysis of PEIMS data at UT Education Research Center;
2010-2011 school year.                                                        © E3 Alliance, 2017
Why are Students Absent and What Can We Do About It? - Amy Wiseman, Ph.D - E3 Alliance
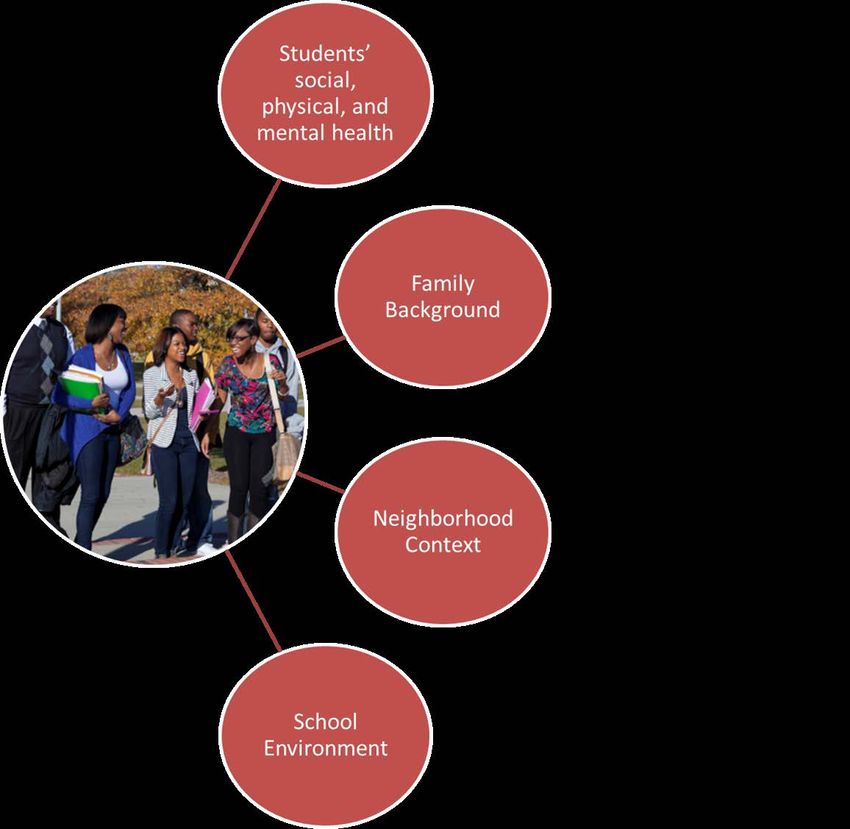
Absenteeism Generally Increases After 5th Grade
                                       Average Number of Absences in Central Texas, By Grade, 2015-16
                       14

                       12                                                                                                                          12.6

                       10
 Average Days Absent

                                                                                                                                            10.0
                                                                                                                         9.2          9.2
                        8
                                 7.7
                                                                                                               7.4
                        6                   6.7                                                          6.6
                                                       6.1                                       6.0
                                                                 5.7        5.7       5.6
                        4

                        2

                        0
                                 KG          1          2          3         4          5         6      7     8           9          10    11     12
                                                                                      Grade Level
                                                                                                                     © E3 Alliance, 2017                4
Source:                E3       .
                            Alliance analysis of PEIMS data at the UT Austin Education Research Center
Why are Students Absent and What Can We Do About It? - Amy Wiseman, Ph.D - E3 Alliance
20% of Students Miss More Than 2 Weeks of School
                                         Percent of K-12 Students by Number of Absences,
                                                       Central Texas, 2015-16
                           50%
 Percentage of Students

                                                                46%
                           40%

                           30%

                           20%                                                          25%
                                                                                                                20%
                           10%
                                   9%
                           0%
                                  Zero                          1 to 5                  6 to 10           More than 10
                                                               Number of Absences
                                                                                                                         5
Source: E3 Alliance analysis of PEIMS data at the UT Austin Education Research Center             © 2017 E3 Alliance
Why are Students Absent and What Can We Do About It? - Amy Wiseman, Ph.D - E3 Alliance
More than 15% of High School Students
                                                                 Chronically Absent
                                                                        Percent of Students Chronically Absent*, By Grade,
                                                                                      Central Texas, 2015-16
Percent of Students Chronically Absent

                                         30%

                                                                                                                                                                 23%
                                         20%

                                                                                                                                                           16%
                                                                                                                                        15% 15%
                                         10%
                                                      8%                                                                        9%
                                                                                                                           7%
                                                                6%        5%                                        6%
                                                                                     4%        4%        4%
                                         0%
                                                      KG          1         2         3          4        5     6     7         8          9          10   11    12
* Absent 10% or more of days enrolled for any reason
                                                                                                          Grade Level
                                                                                                                                     © E3 Alliance, 2017               6
Source:                                  E3   Alliance analysis of PEIMS data at the UT Austin Education Research Center
Why are Students Absent and What Can We Do About It? - Amy Wiseman, Ph.D - E3 Alliance
Students With More Than 10 Absences
    Account for Nearly 70% of All High School Absences
                     Percentage of High School Absences,
                            Central Texas, 2015-16

                                                     12%

                                                                                        Missed 1-5 days
                                                               19%                      Missed 6-10 days
                                                                                        Missed more than 10 days
                                  69%

                                                                                                                     7
Source: E3 Alliance analysis of PEIMS data at the UT Austin Education Research Center           © 2017 E3 Alliance
Why are Students Absent and What Can We Do About It? - Amy Wiseman, Ph.D - E3 Alliance
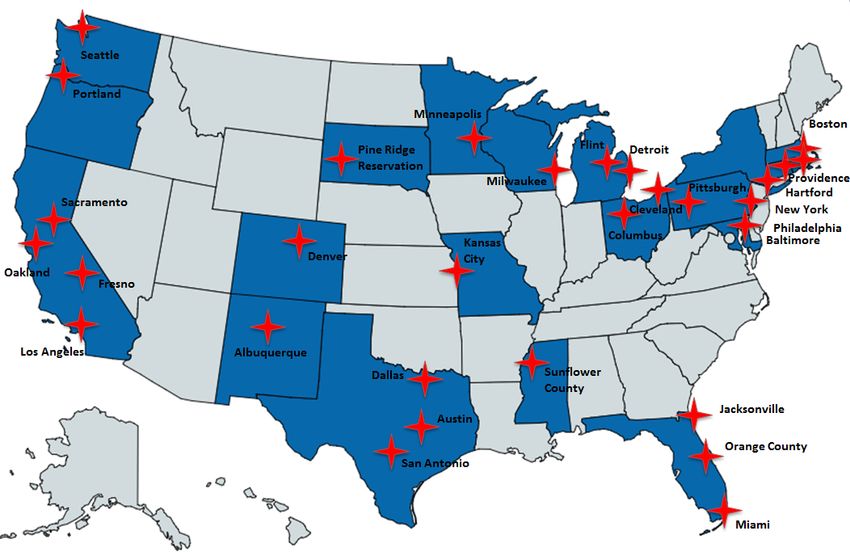
Low Income High School Students in Central
                                                    Texas Miss an Extra Day of School
                                                     Average Number of Absences in High School, 2015-16
                                          15

                                                                                         12.9
 Average Days Absent During School Year

                                                                                                               11.9
                                          10

                                                    8.2            8.0

                                           5

                                           0
                                                      Non-low Income                            Low Income

                                                               Central Texas               Texas
                                                                                                                         8
Source: E3 Alliance analysis of PEIMS data at the UT Austin Education Research Center               © 2017 E3 Alliance
Why are Students Absent and What Can We Do About It? - Amy Wiseman, Ph.D - E3 Alliance
Tells Us Who, What, Where, When

But not WHY students are absent

                              © 2017 E3 Alliance
                                                   9
Why are Students Absent and What Can We Do About It? - Amy Wiseman, Ph.D - E3 Alliance
Absence Reasons Study

                                             10
                        © 2017 E3 Alliance
Absence Reasons Study
 First of its kind study in Texas (maybe US?)
 Data to drive regional decision-making
  How health and community systems interact with
  student attendance and achievement
 Hays & Pflugerville ISDs collected absence reasons
  for 2 months
  Attendance staff called parents and collected detailed
  absence reasons
 Representative of regional population

                                           © 2017 E3 Alliance
What Did We Find?
                                     % of Absences by Absence Reason
               Acute Illness                                                                    48%
                      Skipping                      5% (751)
           Chronic Illness                         4% (707)
    Family Emergency                              4% (654)
 Routine Dental Appt                             3% (465)
Preventative Medical                             2% (352)
                          Travel                 2% (326)
  Mental Health Issue                        2% (254)
Suspension (not ISS)                         1% (247)
Family Responsibility                        1% (173)
                                      0%              10%      20%   30%        40%             50%
Source: E3 Alliance analysis of absence data
from 9 schools in PISD & HCISD, 1/14/13-3/8/13                             © 2017 E3 Alliance
Medical Absences More Variable
                                            Than Non-Medical Absences Over Time
                                2000
    Number of Students Absent

                                1800
                                1600
                                1400
                                1200
                                1000
                                 800
                                 600
                                 400
                                 200
                                   0
                                   14-Jan    21-Jan   28-Jan    4-Feb    11-Feb   18-Feb                25-Feb   4-Mar
                                                                 Study Week

Source: E3 Alliance analysis of Absence data
                                                               Medical    Non-medical
                                                                                  © E3 Alliance, 2017
from 9 schools in PISD & HCISD, 1/14/13-3/8/13
% of Absences Treated Varies by Absence Type
                 Proportion Health Absences by Whether Student Treated by
                                    Medical Professional

        Overall                                         59%                                     41%

  Acute Illness                                   51%                                      49%

Chronic Illness                                           72%                                            28%

                    0%                      20%              40%            60%                   80%          100%
                                                          Proportion of Absences

                                                          Treated    Not Treated
       Source: E3 Alliance analysis of Absence data                                © E3 Alliance, 2017
       from 9 schools in PISD & HCISD, 1/14/13-3/8/13
Most of Skipping by At-Risk Students
                                              Skipping Absences by Demographic Subgroup
                               100%
Percent of Skipping Absences

                                                      % of Students
                               80%
                                                                                                                                  70%
                                                                                                 61%        62%
                               60%

                               40%
                                                   23%                           24%
                               20%

                                0%
                                               Special                    English                Males   Low Income              At Risk
                                              Education                  Language
                                                                          Learner
                                Source: E3 Alliance analysis of Absence data                               © E3 Alliance, 2017
                                from 9 schools in PISD & HCISD, 1/14/13-3/8/13
                                                                                   © 2013   E3
Low Income Students Have More than Their Share of
                       Non-Medical Absences
                                  % of Absences by Reason for Low Income Students
              All Absences
                                                                                 % of Students who
               Acute Illness                                                     are Low Income
           Chronic Illness
                        Asthma
             Mental Health
      Dental Treatment
  Student's Child Sick
Family Responsibility
 Transportation Issue
                      Skipping
                 Court/Legal
                                      0%         10% 20% 30% 40% 50% 60% 70% 80% 90% 100%
                                                    Percent of Absences from Low Income Students
Source: E3 Alliance analysis of Absence data
from 9 schools in PISD & HCISD, 1/14/13-3/8/13                                 © 2017 E3 Alliance
At-Risk Students Have More than Their Share of
                  Absences for Many Reasons
                                       % of Absences by Reason for At-Risk Students
              All Absences
                                                                                                % of Students
              Acute Illness
                                                                                                At-Risk
           Chronic Illness
                        Asthma
            Mental Health
      Dental Treatment
 Student's Child Sick
Family Responsibility
Transportation Issue
                      Skipping
                Court/Legal
                                      0%         10%   20% 30% 40% 50% 60% 70% 80%                       90% 100%
                                                       Percent of Absences from At-Risk Students
Source: E3 Alliance analysis of Absence data                                       © E3 Alliance, 2017
from 9 schools in PISD & HCISD, 1/14/13-3/8/13
Chronically Absent Students Have Far More than
                 Their Share of Absences
                                      % of Absences by Reason for Chronically Absent
              All Absences                                                                          % of Students
              Acute Illness                                                                         Chronically
                                                                                                    Absent
           Chronic Illness
                        Asthma
            Mental Health
      Dental Treatment
 Student's Child Sick
Family Responsibility
Transportation Issue
                      Skipping
                Court/Legal
                                      0%         10%   20%   30%    40%   50%   60%      70%          80%   90% 100%

Source: E3 Alliance analysis of Absence data
                                                 Percent of Absences from Chronically Absent Students
                                                                                    © E3 Alliance, 2017
from 9 schools in PISD & HCISD, 1/14/13-3/8/13
Secondary ‘Flu’ Peak Matches Acute Illness Absences
                                                     Absences By Week August – March for 2012-13

                                                                                                                                                     % of Doctor visits for flu-like illness
                              350                                                                                                              18%
 Average # Absences Per Day

                              300                                                                                                              16%
                                                                                                                                               14%
                              250
                                                                                                                                               12%
                              200                                                                                                              10%
                              150                                                                                                              8%
                                                                                                                                               6%
                              100
                                                                                                                                               4%
                               50                                                                                                              2%
                                0                                                                                                              0%
                                     35 36 37 38 39 40 41 42 43 44 45 46 47 48 49 50 51 52 1     2   3   4    5   6   7    8   9 10 12 13

                                    August                            Week of the Year                       Study Period
                                                                                                                                     March
                                HCISD        PISD     HCISD Acute Illness        PISD Acute Illness               Dr visits flu-like illness

Source: E3 Alliance analysis of Absence data from 9 schools in PISD & HCISD August 2012 through March 2013
Influenza-Like Illness doctor visit data from Austin/Travis County Health and Human Services                              © 2017 E3 Alliance
Evolution of Attendance Initiatives

Missing         Absence            Chronic
School         Study & Flu        Absence in
Matters       Immunization         Schools

   Data Analysis & Continuous Improvement

                                      © 2017 E3 Alliance   20
is Working!
                                                         Student and Absence Counts, Central Texas
                                       3.0                                                                                                    390

                                                                                                                                                    Number of Students (in Thousands)
                                                             $33M regional savings
    Number of Absences (in Millions)

                                                             since campaign started!                                                          360
                                       2.5                                                                                                    330
                                                                                                                                              300
                                       2.0                                                                                                    270
                                                                                                                                              240
                                                                                                                                              210
                                       1.5
                                                                                                                                              180
                                                                                                                                              150
                                       1.0                                                                                                    120
                                                                                                                                              90
                                       0.5                                                                                                    60
                                                                                                                                              30
                                        -                                                                                                     -
                                             2004 2005 2006 2007 2008 2009 2010 2011 2012 2013 2014 2015 2016
                                                                                 Absences                     Students
                                                                                                                         © 2017 E3 Alliance
Source: E3 analysis of PEIMS data at UT Austin Education Research Center for 2002-2013; TEA ad hoc request for 2014-16
Implications for Action on Improving Attendance
• Chronically absent students at any grade –
  account for vast majority of absences
    And are absent for many reasons
• For Low income students, and students at-risk of
  dropping out, focus on non-medical reasons for
  absence
• Acute illness absences track with illness outbreaks
    School-based flu immunization reduced
     absences during peak of flu season

                                                              22
                                         © 2017 E3 Alliance
What Can We Do About It?
Zones of a
Student’s
Daily Life
27
Name of Partnership or Community

How Might We…
    Improve the school attendance
    of chronically absence students
       in the 9th and 10th grades?

                                                         28
SUCCESS
 MENTORS
INITIATIVE
MBK Success Mentor Communities

                                 30
Evidence from NYC

• Chronically Absent Students with a Success Mentor gained nearly two
  additional weeks of school (9 days)
• High School students with Success Mentors were 52% more likely to
  remain in school the following year
• Mentees reported they liked having a mentor and the mentor helped
  improve their attendance, schoolwork, motivation, and confidence

                                          http://www.attendanceworks.org/what-works/new-york-city/success-mentors/
                                          MAYOR’S INTERAGENCY TASK FORCE

                                                                                                              31
Our Goal
   is to reach
All Chronically Absent
  6th & 9th Graders

                         32
REACHING SCALE: How Do We Get Enough Mentors?

     Internal Success                  External Success                 Peer-to-Peer                  College Success
         Mentors                           Mentors                    Success Mentors
                                       School partners including            Upperclassmen
                                                                                                          Mentors
   School staff including coaches,   After-School Providers, Tutors       for 9th graders and         Clinical study credit from
      teachers, office staff, etc        or Nearby Businesses         8th graders for 6th graders   undergraduate, social work or
                                                                                                          education schools

                                                                                                                                    33
How Might We…

 Improve the school attendance of chronically absence students in the 9th
  and 10th grades?

                      Intervention to Test:

               School Success Mentor intervention:
               pairing internal and external mentors
                 with targeted chronically absent
                              students

                                                                             34
Austin

Progress Towards Target
SMART Target(s):
Travis HS, 9th Grade: Improve 9th grade SSM student attendance by 3% by end of
February compared to end of previous year’s attendance rate.

Travis HS, 10th Grade: Improve 9th grade SSM student attendance by 3% by end of
February compared to end of previous year’s attendance rate.

                                                                                  35
Austin ISD

Topic            Reason Name                           Reasons Description and Usage

Dental           Routine Dental Appointment            Went to dentist for reason other than
                                                       pain/infection, such as cleaning,
                                                       checkup, or cavity

Dental           Dental appointment to treat pain or   Went to dentist because of pain or
                 infection                             infection
Military         Join military                         Participating in activities necessary for
                                                       joining military
Military         Military family visit                 Visiting with parents or guardian who
                                                       is on active duty in the armed forces
Austin ISD

Topic            Reason Name                            Reasons Description and Usage

Unexcused        School refusal/school avoidance        Refused to go to school, often because of
                                                        anxiety about something at school; parent is
                                                        usually aware of absence (if anxiety is not
                                                        about school, code as mental health issue)

Unexcused        Skipping                               Absent (and not on campus) for no particular
                                                        reason, parent is usually unaware of absence

Unexcused        Truant                                 Absent from class but on campus
                                                        (somewhere not allowed)
Unknown          Unwilling to provide detailed reason   For any AISD reason code triggering request
                                                        for further detail, where student/family did
                                                        not provide information needed for detailed
                                                        reason code
Austin ISD

Topic             Reason Name                                        Reasons Description and Usage

Family            Family responsibility (such caring for siblings)   Had family responsibility such as caring for
                                                                     younger siblings or elderly family members

Family            Funeral or family emergency                        Attended a funeral or had a family
                                                                     emergency (do not need to know what family
                                                                     emergency is)

Family            Oversleeping/Family planning issue (not            Student or parent overslept or other issue
                  transportation)                                    where family not organized to get child to
                                                                     school
Family            Student’s child ill                                Illness of the student’s child where the student
                                                                     has to provide care
Austin ISD

Topic            Reason Name       Reasons Description and              Treatment Follow Up
                                   Usage
Medical          Acute illness     Usually contagious, short-lived,     Is your child going to the doctor
                                   one-time illnesses such as cold,     for this? (Either has, already, or
                                   flu, sinus infection, stomach flu,   will go soon) If not, why not?
                                   strep throat, mono, etc.
Medical          Asthma            Asthma or difficulty breathing       Is your child going to the doctor
                                                                        for this? (Either has, already, or
                                                                        will go soon) If not, why not?
Medical          Diabetes          Diabetes or diabetes                 Is your child going to the doctor
                                   complication (described as such      for this? (Either has, already, or
                                   by parent)                           will go soon) If not, why not?
Medical          Chronic illness   Any long term or regularly           Is your child going to the doctor
                                   recurring physical condition other   for this? (Either has, already, or
                                   than diabetes or asthma, such as     will go soon) If not, why not?
                                   allergies, cedar fever, recurrent
                                   infections, autoimmune disease,
                                   etc.
5 KEY STEPS – Year 1 Implementation

 Created a TARGET LIST of Chronically Absent 6th/9th graders
 Campuses Selected Mentors from the following 3 buckets:
    Internal Staff (administrators, teachers, coaches, security guards). Principal should lead
     recruitment of internal staff.
    External Partners (after-school, tutors, other partners)
    Peers (11th/12th graders for 9th; 8th graders for 6th graders

 Match Mentors and Students
 HOST KICK-OFF Event
 Access Scheduled Support
   Mentor Training
   Peer Mentor Training

                                                                                                  40

                                                                                                       40
Austin

                                                         PDSA
  Intervention/Project: Travis School Success Mentors
  Test Population: SSM students in 9th and 10th grades

           PLAN                 Attach reasons to individual absences to determine appropriate
                                interventions.
             DO                 Create a run chart based on the data and look for patterns and trends
          STUDY                 Results did not match our prediction.
            ACT                 We will adopt and develop a plan for implementation.

Post-Secondary Enrollment Impact & Improvement Network – Learning Session 3        © 2016 - Design Impact
                                                                                                            41
What Made the MBK Success Mentor Model Powerful?

 Clear Model with Evidence of Impact
 Measurable Outcome (can tell rapidly if its working)
 District and School Flexibility on How Model is Actualized
 Not Another Initiative but an Enabler of Multiple School Improvement
  Efforts
 Cost Effective Can be Largely Driven Through New Application of Existing
  Resources
 Can be Continually Improved and Enhanced
 Multiple stakeholders

                                                                             42
The conclusions of this research do not necessarily reflect the opinions or official position of the
Texas Education Agency, the Texas Higher Education Coordinating Board, or the State of Texas.

            Amy Wiseman                                      Joshua Childs
       awiseman@e3alliance.org                       joshuachilds@austin.utexas.edu

                                        Thank You!

                                                                                                       43
You can also read