2018/2019 Interim Results Presentation 14 November 2018

Page created by Samuel Vasquez
 
CONTINUE READING
2018/2019 Interim Results Presentation 14 November 2018
2018/2019
Interim Results
Presentation

14 November 2018
2018/2019 Interim Results Presentation 14 November 2018
We Link People
Financial   Review
to a Brighter Future
2018/2019 Interim Results Presentation 14 November 2018
We Link People to a Brighter Future

TO BE A WORLD CLASS
REAL ESTATE INVESTOR
AND MANAGER…

                               …SERVING AND IMPROVING
                               THE LIVES OF THOSE
                               AROUND US

                                                        P.3
2018/2019 Interim Results Presentation 14 November 2018
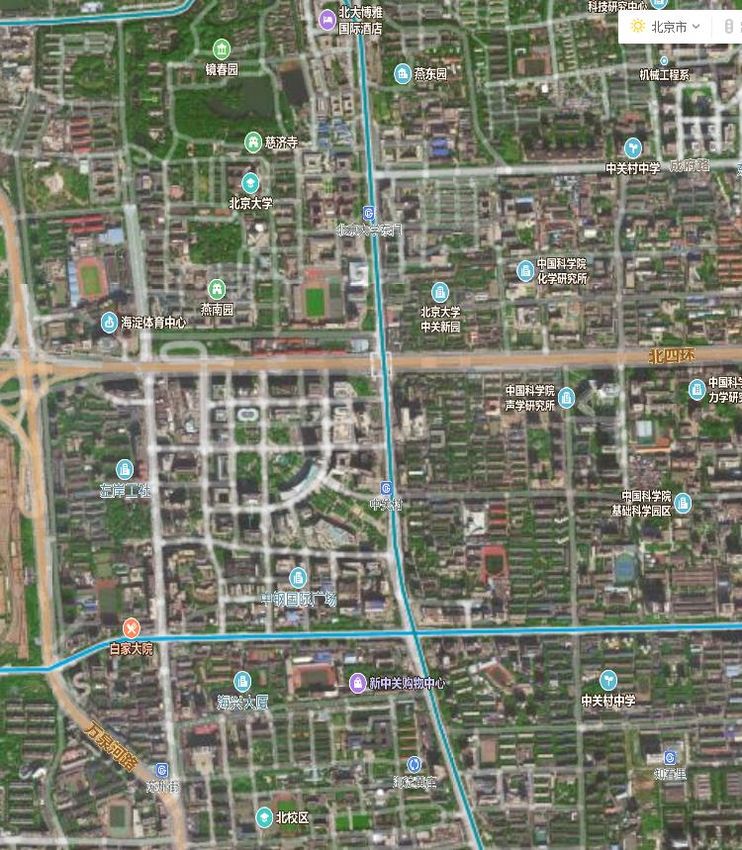
Our Value Creation Model

                           P.4
2018/2019 Interim Results Presentation 14 November 2018
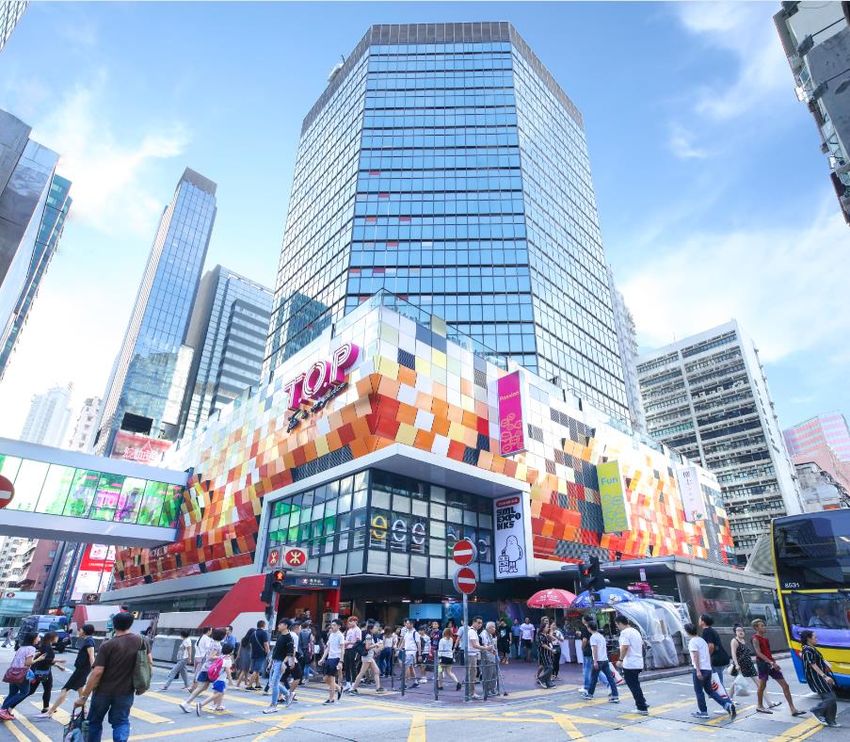
Resilient Portfolio, Sustainable Business

                               • Currently conducting portfolio review
Active Management to           • Professional Asset Management team tailoring asset
Capture Growth                   plans for sustainable growth
Opportunities
                               • Solid capital management and best-in-class
                                 corporate governance

                               • Portfolio Management to focus on future investment
                                 directions including scope, locations and asset types
                               • Asset Management to develop a unique Link Asset
                                 Management Model for retail properties, office and fresh
Four Areas of                    markets
Management Focus
(new taskforces set up since   • Technology to explore new opportunities and enhance
April 18)                        analytics
                               • HR-PR-IR to align and fortify Link’s engagement
                                 with internal and external stakeholders
                                                                                         P.5
2018/2019 Interim Results Presentation 14 November 2018
Strong Team to Steer Future Directions

Expansion of                                            Strengthen Leadership
Management Bandwidth                                    and Talent Development

• Chief Executive Officer                              • Expanded Mainland China
  who has overall leadership responsibility for Link     team to operate the three
• Chief Operating Officer                                existing assets in Beijing,
  to execute Link’s strategic plans and ensure           Shanghai and Guangzhou
  smooth operations                                    • Management development
• Chief Financial Officer                                programmes to identify and
  to spearhead the finance, treasury & insurance,        enhance management and
  risk management and research & data analytics          leadership capabilities
  functions
• Chief Strategy Officer
  to develop, communicate, execute and sustain
  corporate strategic initiatives

                                                                                       P.6
2018/2019 Interim Results Presentation 14 November 2018
Sustainability through Engagement and Advocacy

Engagement                                Advocacy
•   Hosted annual CONNECTION              •   Memberships
    Conference for large and small
    tenants, suppliers, contractors and
    staff
•   Promoted exchange of ideas,
    business priorities and challenges,
    and fostered mutual understanding     •   Leadership in developing application of TCFD
    and shared values                         (Task Force on Climate-Related Financial
                                              Disclosures) in real estate sector

                                          •   Focus on 3 UN Sustainable Development
                                              Goals with specific actions and targets

                                                                                        P.7
2018/2019 Interim Results Presentation 14 November 2018
Delivering Positive Outcomes for All Stakeholders

Environmental Contribution                           Link Together Initiatives                               Food Donation
Reduction in energy since 2010                       Amount earmarked                                        Surplus food donated by
                                                                                                             market tenants
                                 28.7%(1)                                        HK$14.4M                                         108.2
                                                                                                                                  tonnes (2)
                                                                                                                  48.2
                                                         HK$10.2M                                                 tonnes
       26.5%

     2016/2017                 2018/2019                 2016/2017                  2018/2019                    2016/2017               1H2018/2019

Tenant Academy                                       Gender Diversity                                        Public Image
 No. of participants to date                         Women Representation on Board of                        Annual perception audit result (3)
                                                     Directors
                                ~19,000(2)                                                                                        96% (2)

                                                                31%                      31%
       ~18,000
                                                                                                                    62%

     2016/2017               1H2018/2019                  Mar 2017                   Sep 2018                    2016/2017                  2017/2018
Notes:
(1) Full year projection figure excluding any properties acquired, divested and/or newly operational (as applicable) during the periods under analysis.
(2) Latest available data as at 30 September 2018.
(3) Represent the percentage of respondents with neutral to positive perception of Link.
                                                                                                                                                          P.8
2018/2019 Interim Results Presentation 14 November 2018
Financial  Review
Financial Overview
2018/2019 Interim Results Presentation 14 November 2018
Continuous Efforts Driving Valuation Growth

 Portfolio mix (1)
                              3.4%
                   4.8%
                                                 69.8%               Weighted average capitalisation rate (3)
        4.7%

                                                                                 Hong Kong           Mainland China
                         Hong Kong
17.3%                                                                   Retail          3.98%        Retail 4.50% - 4.75%
                           91.8%
                                                                        Car park        4.14%        Office        4.25%
                     Mainland China
                            8.2%                                        Office (2)           -

      Total portfolio value                            HK$210B                        NAV per unit      HK$85.41
                                                               +3.3%       (4)                                +2.8% (4)
Notes:
(1) By valuation as at 30 September 2018.
(2) Hong Kong office is under development and is valued using residual method.
(3) Represents net capitalisation rate.
(4) Compared to March 2018.
                                                                                                                          P.10
Strong Underlying Performance

                                                    Six months ended                                                     Like-for-like
                                                         30 Sep 2018                                                       growth(1)
                                                             (HK$’M)                                      YoY

 Revenue                                                                        4,930 (2)              -0.4%                  +7.4%
 Net property income                                                            3,759 (3)              -0.2%                  +6.9%
 NPI margin                                                                   76.2%                   +0.1%                   -0.4%

 Distribution per unit
                                                                             130.62 (4)               +7.5%
 (HK cents)

Notes:
(1) Excluding any properties acquired, divested and/or newly operational (as applicable) during the periods under analysis.
(2) Includes revenue of HK$490M (2017: HK$399M) from Mainland China portfolio.
(3) Includes net property income of HK$390M (2017: HK$ 310M) from Mainland China portfolio.
(4) 2,111,986,754 units in issue as at 30 September 2018 (31 March 2018: 2,150,058,972 units).
                                                                                                                                         P.11
Robust Financial Position

    Total                                                       Fixed rate debt/
                              Bank loans
    debt                         33%                            total debt
                               HK$7.5B
     HK$22.7B                                                                      69.7%

                                                       MTN      Average fixed rate
                                                       67%      debt maturity
                                                     HK$15.2B
                                                                               5.2 years

  Effective                                Gearing              Credit
  interest rate                            ratio                ratings
                                                                                   A/Stable
                                                                                     S&P
                         3.19%                       10.3%
Notes:
                                                                               A2/Stable
(1) All figures as at 30 September 2018.                                            Moody’s
(2) All amounts are at face value.
                                                                                              P.12
Financial Review
 Organic Portfolio
Hong Kong Operating Landscape:
Hong Kong Economy

Solid median monthly household income growth                             Sound
(YoY)                                                                    GDP growth               +2.9%
                                                                                               3Q 2018, YoY

12%                    Overall            Public rental housing

10%
                                                                  +10.1%
                                                                         Unemployment rate
                                                                   +9.1% remained low
 8%
                                                                                                   2.8%
 6%
                                                                                                  3Q 2018
 4%
                                                                         Healthy
 2%
                                                                         non-discretionary
 0%                                                                      retail sales and
        2011 2012 2013 2014 2015 2016 2017 1Q 2Q 3Q                      restaurant receipts
                                          2018 2018 2018                 growth                   +4.2%
                                                                                                3Q 2018, YoY

 Source: Census & Statistics Department, Transport Department
                                                                                                               P.14
Hong Kong Operating Landscape:
 Resilient Non-discretionary Trades

Year-on-Year Change of Retail Sales Value & Restaurant Receipts Value

 60%
                                                                                                 Foods & alcoholic
                                                            Global financial crisis
 50%                                                                                             drinks

 40%                                                                                             Supermarkets

 30%
                            Tech bubble burst                                                    Restaurant
 20%
                                                                                                 receipts

 10%
                                                                                                 Jewellery
  0%

-10%                                                                                             Department
                                                                                                 stores
-20%
                                            SARS outbreak
-30%                                                                                             Clothing

                   Asian financial crisis
-40%
         92 93 94 95 96 97 98 99 00 01 02 03 04 05 06 07 08 09 10 11 12 13 14 15 16 17 1Q-
                                                                                       1Q-3Q18
                                                                                       3Q
                                                                                        18
Source: Census & Statistics Department

                                                                                                              P.15
Hong Kong Operating Landscape:
Car Park Demand Still Outpaces Supply

 Private Car Demand and Supply (YoY)                                No. of Registration of Vehicles and
                                                                    Parking Spaces (Private Cars)

                                                                                                               673,246
                       5.4%                                         613,191                                    613,065
   4.6%
              4.1%
                                           3.1%
                                 2.7%
                                    2.0%            2.0%
                                                                    406,995
                                             0.8%      0.8%
       0.3%     0.3%      0.5%

     2013      2014     2015      2016      2017     3Q18

         No. of parking spaces
                                                                         No. of private car parking spaces
                licensedcar license
         No. of private
                                                                         No. of registration of private cars

Source: Transport Department, Legislative Council - Panel on Transport                                              P.16
Hong Kong Retail Portfolio:
Continuous Resilient Performance

  Retail rental
  (HK$’M)                                                                                         Reversion rate
                                                                   +6.6%
                                                                                                                                22.5%
                                                                                                                            -4.3% YoY
                            -1.7%

                                                                                                 Occupancy

             3,324           3,268
                                                                                                                            95.5%
                                                                 3,215
                                                 3,015                                                                 -1.5% vs Mar 18

                                                                                                 Average unit rent
            Sep-17           Sep-18              Sep-17          Sep-18

                   Actual                       Like-for-like (1)                                                  HK$65.7 psf
                                                                                                                    +5.3% vs Mar 18

  Notes:
  (1) Excluding any properties acquired, divested and/or newly operational (as applicable) during the periods under analysis.
  (2) All figures for the six months ended 30 September 2018 except otherwise stated.
                                                                                                                                         P.17
Hong Kong Carpark Portfolio:
Steady Growth in Income and Valuation

 Car park rental
 (HK$’M)
                                                                                              Car park income per
                                                                   +10.0%                     space per month

                                                                                                                  HK$2,706
                                                                                                                    +9.9% YoY
                            -3.3%

             1,022            988                                  988                        Average valuation
                                                  898
                                                                                              per space

            Sep-17           Sep-18              Sep-17          Sep-18                                           HK$595K
                                                                                                                +4.9% vs Mar 18
                                               Like-for-like             (1)
                   Actual

  Notes:
  (1) Excluding any properties acquired, divested and/or newly operational (as applicable) during the periods under analysis.
  (2) All figures for the six months ended 30 September 2018 except otherwise stated.
                                                                                                                                  P.18
Hong Kong Retail Portfolio:
   Dominated by Non-discretionary Trades

             Trade mix (as at Sep-18)                                                                                         Sep-18              Mar-18

                                                                   1. Food and beverage                                         27.9%             27.6%
                          8       1
                                                                   2. Supermarket and foodstuff                                 21.6%             21.9%

          7                                                        3. Markets/ cooked food stalls                               14.3%             14.6%
         6

         5
                       By                                          4. Services                                                  10.7%             10.5%
                   monthly rentFood and
                              beverage
                                                2                  5. Personal care/ medicine                                    5.8%              5.7%
           4
         Personal care /                                           6. Education/ welfare and ancillary                           0.9%              0.9%
         Medicine
                                                                   7. Valuable goods (jewellery,
             Services         3                                                                                                  0.9%              0.8%
                                                                      watches and clocks)
                                                                   8. Others (1)                                                17.9%             18.0%

   Food related trades                     63.8%                       Total                                                    100%               100%

Note:
(1) Include clothing, department store, electrical and household products, optical, books and stationery, newspaper, leisure and entertainment.        P.19
Hong Kong Retail Portfolio:
Tenants Performance in 1H2018/2019

 Growing tenant sales (1)                                                       Healthy rent-to-sales ratio (2)
                                                          +7.2%                                                                      13.3%

(YoY)

                                            11.2%
                                    9.7%                                            13.6%                             14.5%
                                                              8.7%                                                                       13.3%
  8.0%                                                                                               12.0%
                                                      7.2%
         6.1%
                  3.8%
                          3.1%

                                                    (3)                                                                            (3)
    Food &        Supermarkets General retail             Overall                  Food &        Supermarkets General retail             Overall
   beverage        & foodstuff                                                    beverage        & foodstuff

    Apr – Sep 18 (Link)                                                              Apr – Sep 18
    Apr – Sep 18 (Hong Kong)

Notes:
(1) Percentage figures represent year-on-year change in tenants’ average monthly sales per square foot of the respective periods.
(2) A ratio of base rent plus management fee to tenants’ gross sales.
(3) Including clothing, department store, electrical and household products, personal care/medicine, optical, books and stationery, newspaper, valuable
    goods, services, leisure and entertainment, and retail others.
                                                                                                                                                      P.20
Mainland China Operating Landscape:
Tier-1 Cities Continue to be Stable

 GDP growth in line with national target                                                      Steady retail                    +7.6%
                                                                                              sales growth                Guangzhou
(YoY)                                                                                                                   1Q-3Q 2018, YoY
  9%
                                                                                                                              +4.1%
  8%                                                                                                                        Beijing
                                                                                                                        1Q-3Q 2018, YoY
                                                                             +6.7%
  7%
                                                                             +6.7%
                                                                             +6.6%
  6%                                                                                           Stable Grade A
                                                                             +6.3%
                                                                                               office rental in
                                                                                               core CBD
  5%                                                                                                                           +0.5%
             2014          2015           2016           2017         1Q-3Q
                                                                                                                             Shanghai
                                                                       2018
                                                                                                                            3Q2018,YoY
                  National                                Beijing
                  Shanghai                                Guangzhou

Source: National Bureau of Statistics of China, Beijing Municipal Bureau of Statistics, Shanghai Municipal Statistics Bureau, Statistics Bureau of
Guangzhou Municipality, Jones Lang LaSalle                                                                                                           P.21
Mainland China Retail Portfolio:
Continuing Robust Results

                                    Top 50 mall in terms of footfall (1)                       Retail trade mix (2)
                                                                                                    (by leased area)

                                                                                                        5.2%
                                                                                             12.2%                     29.6%

  Metropolitan Plaza                                                                        22.0%
  Guangzhou              1
  Retail area: ~89,000 sqm                                                                                         31.0%
                                                                               EC Mall
Retail                          Retail                                            Beijing      Food & beverage
                   (2)                                          Retail area: ~55,000 sqm       Fashion
reversion                       occupancy (3)
                                                                                               General retail & others
     43.2%                          98.8%                                                      Leisure & entertainment
                                                                                               Supermarket & foodstuff
 Notes:
 (1) Source: Winshang
 (2) For six months ended 30 September 2018, all retail properties combined.
 (3) As at 30 September 2018, all retail properties combined.
                                                                                                                         P.22
Mainland China Office Portfolio:
 Premium Grade-A Office Generates Stable Income

   Office trade mix (1)
         (by leased area)                       Link Square
                                            Shanghai
      15.0%                  48.5%          Office area: ~76,000 sqm                       1
  2.4%
                                                Office
15.8%                                           occupancy (1)

  4.0%                                            98.9%
         14.3%
                                                Office
    Professional services
    TMT                                         reversion   (2)        On track to deliver full year double
    Pharmacy                                                           digit reversion
    Industrial goods & services                    0.2%
    Retailers & consumer products
    Others
  Notes:
  (1) As at 30 September 2018.
  (2) For six months ended 30 September 2018.                                                             P.23
Financial
Other      Review
      Growth Drivers
Other Growth Drivers:
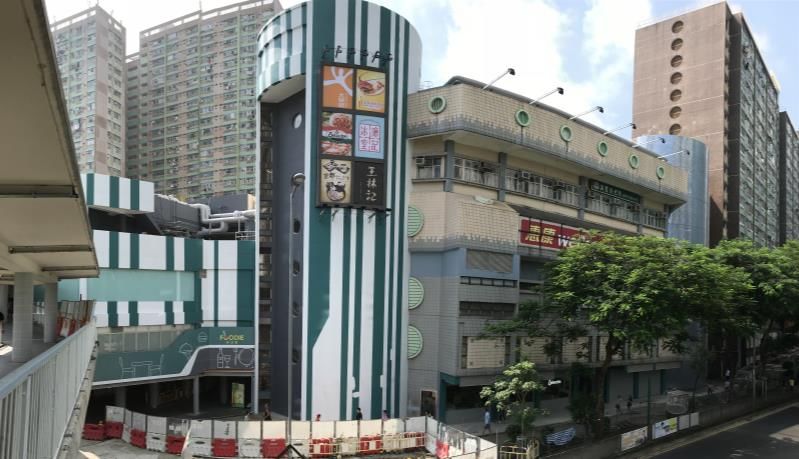
Completed Four Enhancement Projects in 1H2018/19

 Total capex of HK$403M

                                                Fu Shin                                                         Homantin Plaza
                                                CAPEX: HK$98M                                                   CAPEX: HK$116M
                                                ROI: 25.9%                                                      ROI: 24.2%

                                                Sam Shing                                                       Wan Tsui
                                                CAPEX: HK$35M                                                   CAPEX: HK$154M
                                                ROI: 20.9%                                                      ROI: 13.8%

 Note:
 (1) Estimated return on investment (“ROI”) is calculated based on projected annualised net property income post-project minus net property income
     pre-project divided by estimated project capital expenditures and loss of rental.                                                             P.25
Other Growth Drivers:
Continuous Asset Enhancement Pipeline

                                               FY18/19             FY19/20     FY20/21      FY21/22+
   Projects underway                         10 (HK$1,029M)
   Projects to commence                                       5 (HK$681M)
   Others under planning                                                     19 (HK$839M)

   10 Projects underway totalling ~HK$1B
                                         CAPEX (HK$M)
   End 18          Wo Che Plaza (2)               151
                   Kai Tin Phase 1                 34
                   Cheung Fat                      98
                   Choi Yuen                       46
                   Fu Tai                          59
   Early 19        Shun Lee                        76
                   Lok Fu Place                   151
                   Choi Ming                       94
   Mid 19          Fu Cheong (2)                  170                                         Cheung Fat
   End 19          Tsz Wan Shan                   150
Notes:
(1) As at 30 September 2018.
(2) Enhancement included fresh market.
                                                                                                    P.26
Other Growth Drivers:
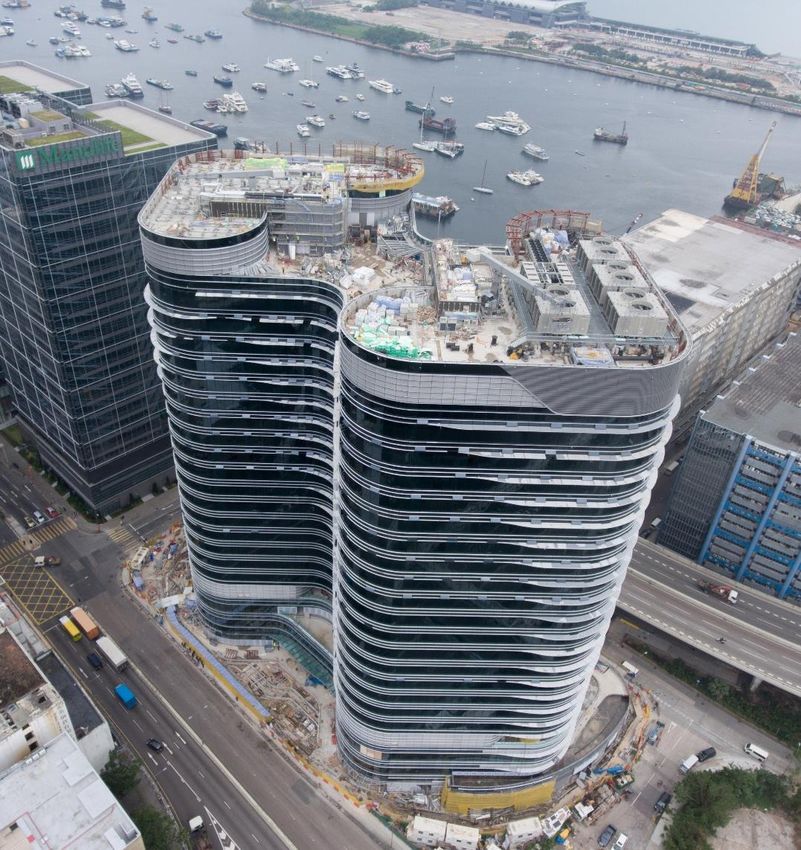
The Quayside in Kowloon East, Hong Kong

                                                                                        YOUR KEY TO THE

                                                                                  NEW HORIZON

                                                                                                        ~60%
                                                                                                        10 out of 17 office floors
                                                                      Leasing update           (1)      pre-leased
                                                                                                        Retail podium targeting
                                                                                                        F&B and gym

                                                                      Expected                          Early 2019
                                                                      completion date

Notes:
(1) As at September 2018.
(2) The Quayside is a joint venture development project with Link owning 60% and Nan Fung owning 40%.                                P.27
Other Growth Drivers:
T.O.P This is Our Place in Mong Kok, Hong Kong

                               Leasing update (1)   Tower: ~73.0%
                                                    Podium: ~93.0%

                                        Retail trade mix of Podium
                                        by leased area

                                         20.5%
                                         General
                                         retail
                                         and                         41.6%
                                         others                      F&B

                                          37.9%
                                          Fashion

Note:
(1) As at September 2018.                                             P.28
Other Growth Drivers:
Selective Acquisitions

Key considerations                                      Case study: EC Mall
                                                                                                     Tsinghua
  Hong Kong & Tier-1 Cities                     (1)                                                  University

       Mass-mid market retail                                                                 Affluent area surrounded by
                                                                    Peking                     high-tech companies and
                                                                   University                          universities
      Premium Grade-A office

           Good connectivity

          Limited competition

          Sizeable catchment
                                                                       EC Mall                  Adjacent to Haidian
                                                                                             Huangzhuang Metro Station
    Long-term growth potential

                                                         No more new retail
                                                      development in the vicinity
Note:                                                                           People’s
(1) Beijing, Shanghai, Guangzhou and Shenzhen                                   University
                                                                                                                    P.29
Other Growth Drivers:
Disposal to Streamline Portfolio

• Continue to review our portfolio
• Dispose non-core properties/ properties           Deploying proceeds to transform
  from time to time                                     to a new growth phase

• Active portfolio management to enhance
  returns                                                  Unit
                                                                      Investment
                                                       buyback

 Assets
                45    Properties
                      Involve ~2.5M sq ft. retail
 divested             space and ~19k car park
                      spaces

                                                           Debt         Working
                35    HK$ Billion
                                                      repayment          capital
                      Achieved an average of
 Proceeds             42% premium to valuation
 generated            in aggregate

                                                                                      P.30
Financial
Outlook andReview
           Strategy
Preparing for the Challenges Ahead

 Increasing uncertainties
 affecting HK and               Well-positioned to overcome the
 Mainland China                 challenges
 Economies
                                ❖ A portfolio of high quality assets with
 ❖ Trade war between US and       effective portfolio management
   Mainland China
                                ❖ Resilient non-discretionary trade mix
 ❖ Rising interest rate
   environment                  ❖ Expanded management bandwidth and
                                  strengthened talent pool
 ❖ More volatile stock market
                                ❖ Strong corporate governance
 ❖ Souring signs from the
   property market              ❖ Robust capital structure

 ❖ Further weakening of RMB
                                                                            P.32
Well Placed to Sustain Total Return Growth

  Way Forward…

  ❖ Active portfolio management strategy to enhance agility

  ❖ New growth drivers to sustain upward projectile

  ❖ Prudently seeking acquisition opportunities

  ❖ Divestment to improve overall portfolio metrics

                                                              P.33
Interim Distribution Calendar

       Distribution period                                        April 2018 – September 2018

       Last day of trading on a “cum” basis                                26 November 2018

       Ex-distribution date                                                27 November 2018

                                                              29 November – 3 December 2018
       Distribution book close
                                                                         (both days inclusive)

       Record date for entitlement to cash distribution (1)                  3 December 2018

       Payment of cash distribution (1)                                    10 December 2018

Note:
(1) There is no scrip alternative for this distribution.                                         P.34
Financial Review
    Appendix
Appendix 1:
    Like-for-like Figures – Key Financial Data

                                                                                    1H FY18/19                1H FY17/18         YoY
   Consolidated                                                                         HK$’M                     HK$’M            %
      Revenue                                                                            4,709                     4,384         +7.4
         Net property income                                                                 3,603                     3,370     +6.9

   Hong Kong portfolio
         Retail rental                                                                       3,215                     3,015     +6.6
         Car park rental                                                                        988                       898   +10.0
         Other revenue                                                                          180                       184    -2.2
         Total revenue                                                                       4,383                     4,097     +7.0

         Total property expenses                                                             1,048                        959    +9.3

Note:
(1) Excluding any properties acquired, divested and/or newly operational (as applicable) during the periods under analysis.
                                                                                                                                        P.36
Additional Data 2:
    Financials – Income Statement Summary

                                                                                              Six months             Six months
                                                                                                   ended                  ended
                                                                                             30 Sep 2018            30 Sep 2017                    YoY
                                                                                                 (HK$’M)                (HK$’M)                      %
    Revenue (1)                                                                                     4,930                 4,949                    -0.4
    Property operating expenses                                                                      (1,171)                (1,182)                -0.9
    Net property income                                                                                3,759                  3,767                -0.2
    General and administrative expenses                                                                 (151)                 (185)               -18.4
    Interest income                                                                                        59                       2     +2,850.0
    Finance costs on interest bearing liabilities                                                       (302)                 (288)               +4.9
    Profit before taxation, change in fair values of investment
                                                                                                       3,365                  3,296               +2.1
     properties and transactions with Unitholders
    Change in fair values of investment properties                                                     6,702                  9,432               -28.9
    Taxation                                                                                            (732)                 (589)           +24.3
    Non-controlling interest                                                                            (109)                     (7)     +1,457.1
    Profit for the year, before transactions with Unitholders
                                                                                                       9,226                12,132                -24.0
     attributable to Unitholders

Note:
(1) Revenue recognised during the period comprise retail and commercial properties rentals of HK$3,744M, car parks rentals of HK$988M and other
    revenues of HK$198M.
                                                                                                                                                    P.37
Additional Data 3:
 Financials – Distribution Statement Summary

                                                                                         Six months                  Six months
                                                                                              ended                       ended
                                                                                        30 Sep 2018                 30 Sep 2017                     YoY
                                                                                            (HK$’M)                     (HK$’M)                       %
 Profit for the period, before transactions with Unitholders                                      9,226                      12,132                -24.0
   Change in fair values of investment properties
                                                                                                (6,591)                     (9,424)                -30.1
   attributable to Unitholders
   Deferred taxation on change in fair values of
                                                                                                     145                           48           +202.1
   investment properties attributable to Unitholders
   Change in fair values of financial instruments                                                      35                            -               N/A
   Other non-cash income                                                                             (56)                        (83)              -32.5
   Depreciation charge on investment properties under
                                                                                                         -                       (69)                N/A
   China Accounting Standards
 Total distributable income                                                                       2,759                       2,604                 +6.0
 Discretionary distribution (1)                                                                          -                         69                N/A
 Total distributable amount                                                                       2,759                       2,673                 +3.2
 Distribution per unit (HK cents)                                                                130.62                      121.50                 +7.5
Note:
(1) Discretionary distribution was related to adjustment for depreciation charge on investment properties under China Accounting Standards during the period
    ended 30 September 2017.
                                                                                                                                                       P.38
Additional Data 4:
  Financials – Financial Position & Investment Properties

    Financial Position Summary
                                                                       As at          As at          As at
   HK$’M                                                        30 Sep 2018    31 Mar 2018    30 Sep 2017
   Total assets                                                     215,269        216,404        191,818
   Total liabilities                                                 34,308         37,336         43,921
   Non-controlling interest                                              583           474            263
   Net assets attributable to Unitholders                           180,378        178,594        147,634
   Units in Issue (M)                                                2,112.0       2,150.1        2,199.9
   Net asset value Per Unit                                            85.41        $83.06         $67.11

    Fair Value of Investment Properties
                                                                      As at           As at          As at
   HK$’M                                                        30 Sep 2018    31 Mar 2018    30 Sep 2017
   At beginning of period / year                                    203,091        174,006        174,006
                                                                                                             (1)
   Acquisition                                                             -         4,580          4,580
   Exchange adjustments                                              (1,703)         1,762            630
   Additions                                                          1,700          2,402          1,170
   Disposals                                                               -       (15,152)              -
   Change in fair values of investment properties                     6,702         35,493          9,432
   At end of period / year                                          209,790        203,091        189,818

Note:
(1) Represents acquisition of Metropolitan Plaza in Guangzhou
                                                                                                       P.39
Additional Data 5:
Financials – Valuation
                                                             As at           As at
HK$’M                                                  30 Sep 2018    31 Mar 2018
Retail properties                                          146,391        141,513
Car parks                                                   36,234         34,510
Property under development                                   9,919          8,733
Properties in Mainland China                                17,246         18,335
Total                                                      209,790        203,091
                                                             As at           As at
Income Capitalisation Approach – Capitalisation Rate
                                                       30 Sep 2018    31 Mar 2018
Hong Kong
Retail properties                                      3.00 – 4.20%   3.00 – 4.20%
Retail properties: weighted average                           3.98%          3.98%
Car parks                                              3.50 – 4.80%   3.50 – 4.80%
Car parks: weighted average                                   4.14%          4.14%
Overall weighted average                                      4.02%          4.01%
Mainland China
Retail properties                                      4.50 – 4.75%   4.50 – 4.75%
Office properties                                             4.25%          4.25%

DCF Approach – Discount Rate
Hong Kong                                                    7.50%          7.50%
Mainland China
Retail properties                                      7.25 – 7.75%   7.25 – 7.75%
Office properties                                             7.25%          7.25%
Independent valuer: JLL                                                        P.40
Additional Data 6:
  Financials – Capital Management

    Committed Debt Facilities                                                 HK$’B                                             %
                                                                           Sep-18                 Mar-18                 Sep-18                 Mar-18
    Bank loans                                                                  7.5                  10.0                   33.0                  38.0
    Medium Term Notes                                                         15.2                   16.3                   67.0                  62.0
    Total debt
                                                                              22.7                   26.3                  100.0                 100.0
    (all unsecured)
    Cash                                                                        3.9                  11.7                   27.9                  51.5
    Undrawn facilities                                                        10.1                   11.0                   72.1                  48.5
    Total liquidity                                                           14.0                   22.7                  100.0                 100.0

    Key Credit Metrics by Rating Agencies
                                                                                                               S&P                          Moody’s
                                                       As at                  As at                    requirement                       requirement
                                                 30 Sep 2018 (3)        31 Mar 2018 (4)                 (A / Stable)                    (A2 / Stable)
  Total debt / total assets                              10.3%                  11.9%                            N/A                            < 30%
  FFO (2) / debt (annualised)                            25.8%                  21.2%                         > 12%                               N/A
  EBITDA interest coverage                               12.3 x                  8.5 x                           N/A                            > 5.0x
  Total debt / EBITDA (annualised)                        3.0 x                  3.5 x                           N/A                            < 6.5x
Notes:
(1) All figures as at 30 September 2018.
(2) Funds from operations is net cash generated from operating activities adjusted by operating lease expenses, interest expenses and income.
(3) Preliminary figures to be confirmed by rating agencies.
(4) Figures are based on reports of rating agencies.                                                                                                P.41
Additional Data 7:
 Financials – Facility Maturity Profile

Facility Maturity Profile
(as at 30 September 2018)
                                                                    MTN             Bank loans           Undrawn facilities
HK$’B

5

4
                          3.6
                                                  3.4

3                                     2.9

                        2.3                       2.0
                                                                                                 4.4
2                                                                             3.9
                                            3.5               1.5
                    3.2               2.5
                                2.5                           0.3
1
                          1.3                     1.4         1.2
                                                                                         0.9              1.0
              -                                         0.7                                                                    0.7
0
                                      0.4                           0.20.4
          18/19        19/20       20/21     21/22       22/23       23/24   24/25      25/26    26/27   27/28     28/29      29/30
 Notes:
 (1) All figures as at 30 September 2018.
 (2) All amounts are at face value.
                                                                                                                                P.42
Additional Data 8:
 HK Portfolio – Revenue Analysis

                                                                                                                                         Percentage
                                                                                                                                        contribution
                                                       Six months Six months                                  Like-for-like              Six months
                                                            ended       ended                                        basis                    ended
                                                      30 Sep 2018 30 Sep 2017                             YoY       YoY(3)              30 Sep 2018
                                                          (HK$’M)     (HK$’M)                               %            %                         %
 Retail rentals:
   Shops (1)                                                    2,659                 2,704                 -1.7              +6.5                   59.9
   Markets / cooked food stalls                                    452                  451                +0.2               +9.3                   10.2
   Education / welfare and
                                                                     67                   73                -8.2              +2.0                    1.5
    ancillary
   Mall merchandising                                                90                   96                -6.3              +0.7                    2.0
 Car park rentals:
   Monthly                                                         745                  769                 -3.1            +10.8                    16.8
   Hourly                                                          243                  253                 -4.0              +7.5                    5.5
 Expenses recovery and other miscellaneous revenue:
   Property related revenue (2)                                    184                  204                 -9.8               -2.1                   4.1
 Total                                                          4,440                 4,550                 -2.4              +7.0                 100.0
Notes:
(1) Rental from shops includes turnover rent of HK$44 million (2017: HK$ 57 million).
(2) Including other revenue from retail properties of HK$182 million (2017:HK$201 million) and car park portfolio of HK$2 million. (2017:HK$3 million).
(3) Excluding any properties acquired, divested and/or newly operational (as applicable) during the periods under analysis.                             P.43
Additional Data 9:
  HK Portfolio – Expenses Analysis
                                                                                                                                       Percentage
                                                                                                                                      contribution
                                                        Six months              Six months                               Like-for-     Six months
                                                             ended                   ended                             like basis           ended
                                                       30 Sep 2018             30 Sep 2017                   YoY            YoY(2)    30 Sep 2018
                                                           (HK$’M)                 (HK$’M)                   (%)              (%)              (%)
Property managers’ fees, security
                                                                     269                    280               -3.9             +8.5           25.1
 and cleaning
Staff costs (1)                                                      235                    224              +4.9             +16.9           21.9
Repair and maintenance                                                99                    101               -2.0             +8.3            9.2
Utilities                                                            156                    172               -9.3             -0.8           14.6
Government rent and rates                                            143                    144               -0.7            +10.7           13.4
Promotion and marketing
                                                                      53                      50             +6.0             +14.3            5.0
 expenses
Estate common area costs                                              44                      51            -13.7              +4.0            4.1
Other property operating expenses                                     72                      71             +1.4             +11.3            6.7
Total property expenses                                           1,071                  1,093                -2.0             +9.3         100.0

Notes:
(1) The increase in staff cost was mainly due to expanded management team to broaden management bandwidth.
(2) Excluding any properties acquired, divested and/or newly operational (as applicable) during the periods under analysis.
                                                                                                                                               P.44
Additional Data 10:
 HK Portfolio – Retail Portfolio Data

                                                                       Retail     Average monthly
                                           Total area Valuation       rentals         unit rent       Occupancy rate
                                          (’000 sq. ft.) (HK$’M)     (HK$’M)         (HK$ psf)             (%)
                            No. of
                                                                            Six
                          properties
                                                                        months
                                                   As at     As at       ended      As at     As at    As at     As at
                                                  30 Sep    30 Sep      30 Sep     30 Sep 31 March    30 Sep 31 March
                                                    2018      2018        2018       2018     2018      2018     2018
 Destination                          6           1,280     31,119        635       87.8       83.0     92.3      96.3

 Community                          33            3,829     76,851      1,721       73.7       70.6     97.0      97.7

 Neighbourhood                      70            3,296     38,421        912       47.8       44.9     94.9      96.4

 Overall                          109             8,405    146,391      3,268       65.7       62.4     95.5      97.0

Note:
(1) Properties categorisation as at 30 September 2018.
                                                                                                                  P.45
Appendix 11:
Hong Kong Portfolio – Portfolio Metrics

                                                  As at              As at
                                            30 Sep 2018       31 Mar 2018    Change
 Average monthly unit rent (psf pm)
    Shops                                     HK$66.2            HK$62.7      +5.6%
    Overall (ex self use office)              HK$65.7            HK$62.4      +5.3%
 Occupancy rate
    Shops                                       95.7%              97.4%     -1.70%
    Markets/cooked food stalls                  92.3%              92.9%     -0.60%
    Education/welfare and ancillary             97.1%              97.1%           -
    Overall                                     95.5%              97.0%     -1.50%

                                       Six months ended   Six months ended      YoY
                                            30 Sep 2018        30 Sep 2017   Change
 Composite reversion rate
   Shops                                        20.4%              28.5%     -8.10%
   Markets/cooked food stalls                   26.7%              12.8%    +13.90%
   Education/welfare and ancillary              12.9%              14.4%     -1.50%
   Overall                                      22.5%              26.8%     -4.30%
 Net property income margin                      76.2%              76.0%    +0.2ppts

 Car park income per space per month          HK$ 2,706         HK$ 2,463      +9.9%

                                                                                        P.46
Additional Data 12:
HK Portfolio – Lease Expiry Profile

                               As % of total area   As % of monthly rent
As at 30 September 2018                        %                      %
FY18/19                                     19.4                    14.7
FY19/20                                     23.3                    24.2
FY20/21 and beyond                          49.6                    57.5
Short-term lease and vacancy                 7.7                     3.6
Total                                      100.0                  100.0

                                                                       P.47
Additional Data 13:
Mainland China Portfolio – Lease Expiry Profile

                                   Retail                    Office
                             As % of      As % of      As % of      As % of
                           total area monthly rent   total area monthly rent
 As at 30 September 2018          (%)          (%)          (%)          (%)
FY18/19                           4.6          7.8          8.8         10.1
FY19/20                        24.7           31.9       20.0           21.0
FY20/21 and beyond             69.5           60.3       70.1           68.9
Vacancy                          1.2             -         1.1             -
Total                          100.0         100.0       100.0         100.0

                                                                          P.48
Appendix 14:
Market Update – Kowloon East

                                                                                                              Rental gap between
            Location of The Quayside                                                                        Central and Kowloon East
                                                                                                    140

                                                                                                    120

                                                                     HKD per sq ft per month, NFA
    Kai Tak
    (under
    construction)
                                                                                                    100

                                  Kowloon Bay
                                                                                                     80                                                                  HK$ 93
                                                The Quayside
                                                                                                     60

        Kowloon East                      Ngau Tau Kok
         Action Area                                                                                 40
                                                         Kwun Tong
                                                                                                     20

                                                                                                      0   3Q10

                                                                                                                 3Q11

                                                                                                                        3Q12

                                                                                                                               3Q13

                                                                                                                                      3Q14

                                                                                                                                             3Q15

                                                                                                                                                    3Q16

                                                                                                                                                           3Q17

                                                                                                                                                                  3Q18
                                                                                                                 Kowloon East                 Hong Kong East
                                                                                                                 Central                      Overall

Source: Energizing Kowloon East                                                              Source: JLL                                                                  P.49
Appendix 15:
Market Update – Grade A Office Supply in Shanghai
Core CBDs

                               400

                               350
                                                                                                                                                         Huangpu (Puxi)

                                       Taikang Insurance Tower
                               300                                                                                                                       Jing’an (Puxi)
Thousand Square Meters (GFA)

                                                                                                                                                         Luijiazui (Pudong)
                               250
                                        Lujiazui Finance Plaza

                               200        Foxconn Building

                               150      Lujiazui Fuhui Project                                                                                   Taiping Bridge Plot 132 project

                                                                                                                                                 Taiping Bridge Plot 123 project
                               100

                                         One Museum Place            Ruiming Tower                                                                     Shang Xian Fang
                                50                                                       JC Mandarin Renovation Office
                                                                  City Link (Hutchison              Project
                                                                                                                         Garden Square Phase 2           Capital Tower
                                                                 Whampoa Xinzha Road)       Jing'an Baohua Center
                                 0
                                            2018F                     2019F                      2020F                        2021F                       2022F

                                     No near term competing property to Link Square in Huangpu District
            Note: Forecasts as at 3Q 2018.
            Source: JLL                                                                                                                                                            P.50
Appendix 16:
Market Update – Large Scale Retail Supply in
Guangzhou
                                                                                                         Urban                           Suburban
                               600                                                                                Zhujiang New                 Huadu
                                                                                                                  Town
                               550                                                                                                             Luogang
                                                                                                                  Beijing Road
                               500
Thousand Square Meters (GFA)

                                                                                                                  Tianhe Others                Panyu Wanbo
                               450                                                 Teemall Panyu
                                                                                                                                               Jinshazhou
                               400
                                     Xintang Wanda Plaza                                                                                       Zengcheng
                               350        Zengcheng                                 AEON Mall
                                                                                 Zengcheng Project
                               300                             New Park                                                                        Baiyun New
                                                                                                                                               Town
                               250        PASO
                                        (West Zone)         Luogang Greenland         Lumina I
                               200                             Center Plaza
                                                                                Aoyuan International         New World Land
                               150    Luogang Aoyuan                                 Center                 Zengcheng Project
                                           Plaza           Huadu Wanda Plaza
                               100                                                  Guangzhou
                                                                                                            Guangdong Rising
                                          AEON Mall                                Nimble Plaza                                           GZ Metro Panyu
                                50                                                                           Panyu Project
                                      Jinshazhou Project      Vanke Plaza          Guangdong                                             Chimelong Project
                                                                                  Holdings Plaza       Guangdong Holdings ZJNT Project
                                 0
                                          2018F                2019F                 2020F                      2021F                       2022F

                                              No new large scale retail supply in Liwan District up to 2022
              Note: Forecasts as at 3Q 2018.
                                                                                                                                                             P.51
              Source: JLL
Appendix 17:
Market Update – Limited Commercial Land in Hong Kong

     Commercial – 0.5%

                                         0.7%            Woodland/Shrubland/Grassland/Wetland
                                     2.7%
                          6.9%
                      0.5%                               Agriculture
                    2.3%
                  2.3%                                   Other Urban or Built-up Land
                2.3%
                                                         Transportation
               5.2%
                                      2017               Open Space
               4.9%          Land utilisation            Institutional
                              in Hong Kong
                                                         Industrial
                 6.1%
                                                66.1%    Commercial
                                                         Residential
                                                         Water Bodies
                                                         Barren Land

                                                        Total land area : ~1,111 sq km

Source: Planning Department, HKSAR
                                                                                                P.52
Appendix 18:
Thought Leadership – From Land Supply to City Strategy
for Hong Kong

                               Key propositions to address pressing
                               land supply issue in Hong Kong

                                •   Greater Bay Area connectivity
                                •   Green areas in urban settings
                                •   Standards for “green” construction
                                    and plot ratios
                                •   Redevelopment to rejuvenate the
                                    ageing Cityscape

                                                                Scan here

                                                                            P.53
Disclaimer

 This document has been prepared by Link Asset Management Limited in its capacity as the Manager (the “Manager”) of Link Real Estate
  Investment Trust (“Link REIT”) solely for use at the presentations/meetings held and may not be reproduced or redistributed without
  permission. Neither this document nor any copy may be taken or transmitted into or distributed, directly or indirectly, in the United States or
  to any U.S. person (within the meaning of Regulation S under the United States Securities Act of 1933, as amended). Neither this document
  nor any copy may be taken or transmitted into or distributed or redistributed in Canada or to the resident thereof. The distribution of this
  document in other jurisdictions may be restricted by law and persons into whose possession this document comes should inform
  themselves about, and observe any such restrictions. By attending this presentation/meeting, you are deemed to agree to be bound by the
  foregoing restrictions and represent that you have understood and accepted the terms of this disclaimer. Any failure to comply with these
  restrictions may constitute a violation of applicable securities laws.

 All information and data are provided for reference only. All opinions expressed herein are based on information available as of the date
  hereof and are subject to change without notice. The slides forming part of this document have been prepared solely as a support for oral
  discussion about Link REIT. No representation or warranty, express or implied, is made as to, and no reliance should be placed on, the
  fairness, accuracy, completeness or suitability of any information or opinion contained herein. None of Link REIT, the Manager, or any of its
  directors, officers, employees, agents or advisors shall be in any way responsible for the contents hereof, nor shall they be liable for any loss
  arising from use of the information contained in this presentation or otherwise arising in connection therewith.

 This document may contain forward-looking statements. The past performance of Link REIT is not necessary indicative of the future
  performance of Link REIT and that the actual results may differ materially from those set forth in any forward-looking statements herein.
  Nothing contained in this document is, or shall be relied on, as a promise or forecast as to the future.

 This document does not constitute an offer or invitation to purchase or subscribe for any securities of Link REIT and neither any part of it
  shall form basis of or be relied upon in connection with any contract, commitment or investment decision whatsoever. No action has been
  taken or will be taken by Link REIT, the Manager or any of its directors, officers, employees, agents or advisers, to register this document as
  an offering document or otherwise to permit public distribution of this document.

                                                                                                                                             P.54
You can also read