2019 21 Food Price Monitor - February Issue - National Agricultural ...
←
→
Page content transcription
If your browser does not render page correctly, please read the page content below
2019
                                          21
Food Price
                  Monthly
                  Monitor     February Issue

   Food Price Monitor - February 2021          1
Important note

Resulting from COVID-19 health protocols, retail-based prices recorded across all regions (including online
prices) have been pooled to create national average price changes which are applied to each elementary
index at a regional level. This means that the geographic index (including total country) changes will, vary
according to different weights and not different price changes. The January 2021 CPI data was published
on Wednesday February 17th, 2021 (see the link below for the CPI publication):

http://www.statssa.gov.za/publications/P0141/P0141January2021.pdf

Certain price comparisons would not be feasible at this stage such as the urban vs. rural price comparison.

EXECUTIVE SUMMARY
During January 2021, the Consumer Price Index (CPI) released by Statistics South Africa (Stats SA) indicated that
the headline CPI and the food and non-alcoholic beverage price indices reached 3.2% and 5.4%, respectively. The
same indices were 3.1% and 6.0% during December 2020.

The FAO Food Price Index (FFPI) in nominal terms, averaged 113.3 points in January 2021, 4.7 points (4.3%)
higher than in December 2020, not only marking the eighth month of consecutive rise but also registering its highest
monthly average since July 2014.

In January 2021, the cost of this basic urban food basket was R971.98, increasing by 9.8% from January 2020 (year-
on-year increase) and increasing by 1.3% from December 2020 (month-on-month change).

Comparing January 2021 to January 2020 retail prices, higher price inflation (6% or more) were observed for the
following products within the NAMC food basket (in order from highest to lowest inflation): Rice, dried beans, polony,
eggs, beef offal, white bread, super maize meal, IQF chicken portions, chicken giblets, brown bread, bananas,
instant coffee, sunflower oil, peanut butter, beef mince and cheddar cheese.

                                      Food Price Monitor - February 2021                                                 I
The items with high inflation could have negative implication in terms of basic food security (staple food inflation) as well
     as dietary diversity (e.g. inflation on meat and fruit). When comparing the inflation rates for January 2021 to January
     2020, with October 2019 to October 2020 (i.e. the previous Food Price Monitor analysis period) the rate of inflation was
     higher for bread & cereals, eggs, bean products and animal protein foods.

     With the festive season behind us, one might have expected food inflation to slow down in January, as demand typically
     declines through this period, before turning upwards again as the Easter period approaches. Nevertheless, most food
     product prices increased, with fruit, meat and oils & fats reflecting the strongest growth.

     A key factor driving food inflation is the exchange rate, which remains a key uncertainty in the coming months. The
     volatility evident in the exchange rate in recent months reflects the influence of global sentiment towards risk and
     emerging markets, as well as fundamental risk factors domestically.

II                                             Food Price Monitor - February 2021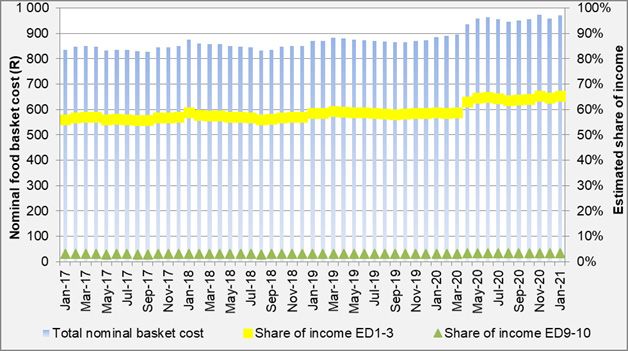
Table of Contents
   01   Introduction

   03   Overall inflation and food inflation: South Africa and selected
        countries

   04   Urban food price trends:January 2021 vs. January 2021

   06   Comparison between urban prices: January 2021
        vs December 2020

   07   International food prices

   10   Estimated impact of food inflation on consumers

   14   Domestic Outlook

          Food Price Monitor - February 2021                              III
Introduction
As February 2021 official CPI data will only be released by March 24th 2021, this section contains data up to
January 2021.

During January 2021, the Consumer Price Index (CPI) released by Statistics South Africa (Stats SA) indicated that
the headline CPI and the food and non-alcoholic beverage price indices reached 3.2% and 5.4%, respectively. The
same indices were 3.1% and 6.0% during December 2020. Figure 1 shows trends of the headline CPI and food and
non-alcoholic beverage inflation rates on a monthly basis, from January 2015 to January 2021.

Figure 1: Headline CPI and food and non-alcoholic beverage CPI
Source: Stats SA, 2021

Figure 2 presents the components of the food and non-alcoholic beverage index changes. During January 2021 vs.
January 2020, the following changes, in descending order, were reported: oils & fats (10.5%), sugary foods (7.3%),
meat (7.2%), processed foods (6.1%), milk, eggs & cheese (6.0%), fruit (6.0%), unprocessed foods (5.2%), bread &
cereals (5.1%), fish (4.0%), other food items (2.6%) and vegetables (-0.6%). The monthly percentage changes are
also illustrated.

The higher inflation on oils & fats is mainly due to higher international prices such as the international sunflower seed
price that is more than 50% higher in January 2021 compared to January 2020.

                                       Food Price Monitor - February 2021                                                   1
Figure 2: Annual (January 2021 vs. January 2020) and monthly (January 2021 vs. December 2020) CPI
               changes for different food categories
    Source: Stats SA, 2021

2                                    Food Price Monitor - February 2021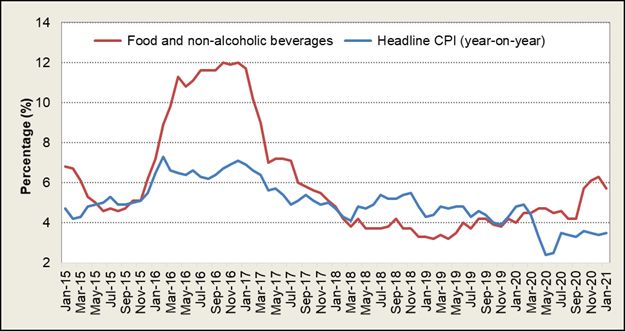
Overall inflation and food inflation:
South Africa and selected countries
Table 1 shows the annual year-on-year (y-o-y) overall inflation and food inflation rates for January 2021 for South
Africa and other selected countries. South Africa’s overall inflation for January 2021 reached 3.2% with food inflation
reaching 5.4%. The food categories with the largest annual contribution to South African food inflation include oils
& fats, sugary foods and meat categories. The Zambian overall inflation rate for January 2021 reached 21.5%, with
food inflation reaching 25.6%. China’s overall inflation rate was -0.3%, with food inflation of 1.6% for January 2021.
Considering inflation rates of Brazil, Russia, India, China and South Africa as the BRICS countries, China recorded
the lowest overall inflation of -0.3%, with Brazil with the highest food inflation contributor at 14.8%.

In the BRICS group, China also have the lowest food inflation. China’s food prices went up by 1.6% in January
2021 in comparison to January 2020, the most in three months, following a 1.2% gain in December 2020 (y-o-y).
On a monthly basis, consumer prices rose by 1% in January, shifting from a 0.4% fall in December, due to adverse
weather and rising demand ahead of the Lunar New Year holiday.

Table 1:Overall inflation and food inflation during November 2020 to January 2021
                          November  2020                     December 2020                         January 2021

                      Overall       Food inflation       Overall           Food             Overall            Food
     Country
                   inflation (%)        (%)           inflation (%)    inflation (%)     inflation (%)     inflation (%)
 Botswana               2.2               4.3              2.2              3.6              2.3                  3.4
 Brazil                 4.3              15.9              4.5             14.1              4.6                  14.8
 China                  -0.5             -2.0              0.2              1.2              -0.3                 1.6
 India                  6.9               9.5              4.6              3.4              4.1                  1.9
 Namibia                2.2               7.0              2.4              7.6              2.7                  5.2
 Russia                 4.4               6.6              4.9              7.7              5.2                  NA
 South Africa           3.2               5.8              3.1              6.0              3.2                  5.4
 Turkey                14.0              21.1             14.6             20.6              15.0                 NA
 United
                        0.3              -0.6              0.6             -1.4              0.7                  -0.7
 Kingdom
 United States          1.2               3.7              1.4              3.9              1.4                  3.8
 Zambia                17.4              16.8             19.2             20.2              21.5                 25.6
Sources: Central banks and statistics reporting institutions of these countries, 2021

                                        Food Price Monitor - February 2021                                                 3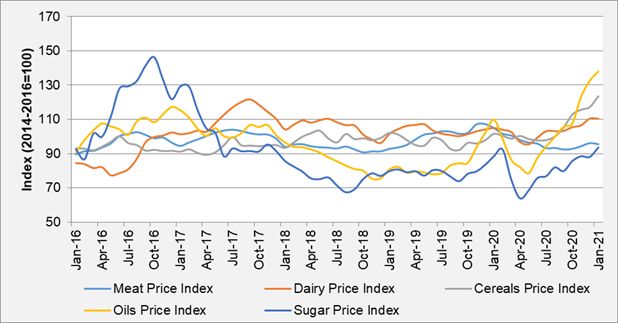
Urban food price trends:
                                                January 2021 vs. January 2020
    As a result of the Covid-19 global pandemic, rural prices could not be monitored during January 2021, therefore this
    section will rank urban price for January 2021 vs. January 2020.

    Table 2 ranks selected food items pertaining to urban areas according to their various inflation rates. The food
    products highlighted in Table 2 are those with annual urban inflation rates exceeding the South African Reserve
    Bank’s (SARB) inflation upper band of 6%.

    Table 2: Food items in the urban areas ranked (January 2021 vs. January 2020)
        Grain and grain                Meat, meat products, dairy,                 Fresh and processed
                               %                                           %                                      %
           products                     dairy products and eggs                    fruits and vegetables
    Margarine spread 500g      -8.0   Lamb - loin chop per kg             -6.8   Oranges - fresh per kg         -12.9
    Brick margarine 500g       0.3    Ham 500g                            -5.1   Beetroot - fresh per kg        -10.2
    Brick margarine 1kg        0.3    Whole chicken - fresh per kg        -4.4   Cabbage - fresh each            -9.1
    Instant noodles 73g        1.6    Beef rump steak - fresh per kg      -0.9   Cabbage - fresh per kg          -9.1
    Peanut butter 400g         9.4    Low fat milk - fresh 2ℓ             -0.8   Pumpkin - fresh per kg          -7.0
                                                                                 Spinach/Morogo - fresh
    Pasta 500g                 9.7    Low fat milk - fresh 1ℓ             -0.8                                   -5.1
                                                                                 per kg
    Super maize 2.5kg          9.8    Tuna - tinned 170g                  0.5    Apples - fresh per kg           -4.1
    Sunflower oil 750mℓ       10.5 Beef sirloin - fresh per kg            1.9    Onions - fresh per kg           -2.7
    Super maize 1kg           12.4 Chicken portions - fresh per kg        2.8    Broccoli - each                 -0.4
    Cake flour 2.5kg          12.5 Full cream milk - fresh 2ℓ             3.3    Potatoes - fresh per kg         0.1
    Loaf of brown bread                                                          Lettuce - fresh per kg /
                              13.6 Full cream milk - fresh 1ℓ             3.3                                    3.7
    700g                                                                         each

    Cold cereals 500g         14.5 Powdered milk 900g                     3.7    Baked beans - tinned 410g       4.0

    Super maize 5kg           14.9 Low fat milk - long life 1ℓ            4.1    Tomatoes - fresh per kg         5.9
    Loaf of white bread       15.7 Full cream milk - long life 1ℓ         5.1    Carrots - fresh per kg         10.3
    700g
    Macaroni 500g             17.3 Beef brisket - fresh per kg            5.7    Bananas - fresh per kg          11.8
    Special maize 5kg         20.9 Lamb - neck per kg                     5.7    Pears - fresh per kg           15.8
    Special maize 2.5kg       20.9 Fish (excl. tuna) - tinned 400g        5.9    Avocados - fresh per kg        25.3
    Spaghetti 500g            24.1 Cheddar cheese per kg                  6.1    Beans - dried 500g             40.2
                                                                                 Sweet potatoes - fresh per
    Rice 1kg                  51.7 Pork chops - fresh per kg              6.4                                   40.9
                                                                                 kg
                                                                                 Paw Paw - fresh per kg /
    Rice 2kg                  52.7 Bacon 250g                             6.5                                   45.7
                                                                                 each
                                                                                 Pineapple - fresh per kg /
                                      Beef mince - fresh per kg           6.6                                   49.6
                                                                                 each
                                      Beef T-bone - fresh per kg          7.1
                                      Eggs 0.5 dozen                      7.1

4                                          Food Price Monitor - February 2021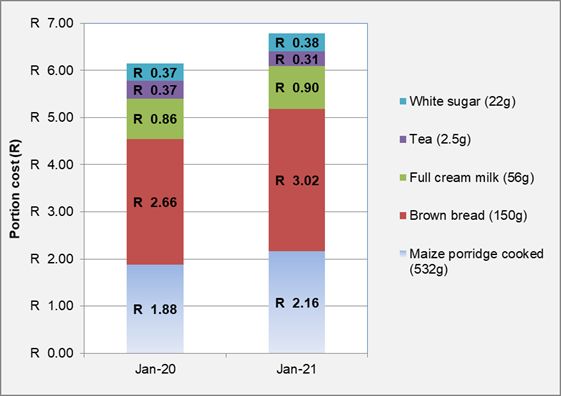
Grain and grain               Meat, meat products, dairy,                  Fresh and processed
                           %                                           %                                      %
       products                    dairy products and eggs                     fruits and vegetables
                                 Beef chuck - fresh per kg            8.0    Other                            %
                                 Lamb - rib chop per kg               10.3   Ceylon/black tea 250g          -16.2
                                 Sausage 500g                         11.0   Ceylon/black tea 62.5g         -16.2
                                 Chicken portions frozen - non        12.0   White sugar 2.5kg               3.0
                                 IQF average per kg
                                 Chicken portions frozen - non       12.0    Instant coffee 250g             11.2
                                 IQF per kg (real)
                                 Beef fillet - fresh per kg          12.4
                                 Pork - ribs per kg                  12.7
                                 Chicken giblets per kg              13.6
                                 IQF chicken portions - 1kg          14.6
                                 IQF chicken portions - 2kg          14.6
                                 Beef offal - fresh per kg           16.4
                                 Eggs 1.5 dozen                      19.9
                                 Corned beef 300g                    20.0
                                 Lamb - stew per kg                  20.1
                                 Beef stew - per kg                  23.5
                                 Polony per kg / 1kg                 30.5
                                 Lamb - offal per kg                 42.2
                                 Lamb - leg per kg                   60.8
Source: Stats SA, 2021
Note: Food items highlighted in the table above experienced price increases above the SARB inflation target of 6%.

A closer look at annual food price trends: January 2021 vs. January 2020

During the period January 2021 vs. January 2020, the international price of wheat increased by 29.8%, while domestic
wheat prices increased by 12.9%. Urban consumers paid 15.7% and 13.6% more for a loaf of white and brown bread
(700g), respectively. Domestic yellow maize prices increased by 26.7%, while international yellow maize prices
increased by 36.5%. Special and super maize meal prices (2.5kg) increased by 20.9% and 9.8%, respectively in
urban areas. During the same period, the urban prices of sunflower oil (750mℓ) increased by 10.5%. Domestic prices
of sunflower seed increased by 62.4% annually, while international sunflower seed prices increased by 51.3%.

During January 2021 vs. January 2020, average beef producer prices (R/kg) of classes C2/C3, A2/A3 and B2/B3
increased by 13.5%, 12.0% and 10.6%, respectively. Lamb/mutton producer prices (R/kg) of classes C2/C3, A2/
A3 and B2/B3 increased by 26.1%, 15.7% and 15.0%, respectively. Producer prices of fresh and frozen chicken
decreased by 8.4% and 1.4%, respectively while individually quick frozen (IQF) chicken portions (R/kg) increased
by 2.0%. Porker and baconer producer prices (R/kg) increased by 27.1% and 19.4%, respectively, during the same
period.

                                      Food Price Monitor - February 2021                                               5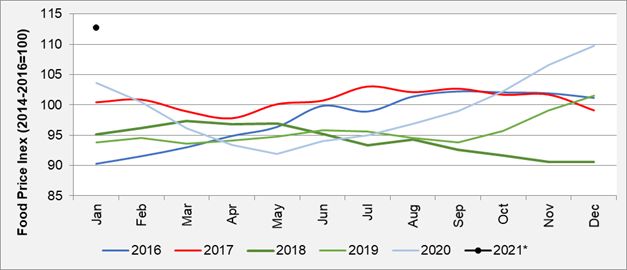
Comparison between urban: January 2021 vs. Decemeber
    2020
    Table 3 compares prices of selected food items in urban areas for January 2021 vs. December 2020. Food items
    showing the largest price differences between January 2021 vs. December 2020 in urban areas are rice (2kg) at
    a difference of R2.86, special maize (2.5kg) at a difference of R1.21, super maize (2.5kg) at a difference of R1.13,
    peanut butter (400g) at a difference of R0.48, loaf of white bread (700g) at a difference of R0.42 and full cream milk
    – long life (1ℓ) at a difference of R0.21. This indicates that urban consumers paid R0.04 less on average, for these
    11 food items during January 2021.

    Table 3: Comparison between urban food prices (selected food items)
                                                         Urban Food Prices     Urban Food Prices
                                                                                                      Price difference
                             Product                      December 2020          January 2021
                                                                                                          (R/unit)
                                                              (R/nuit)              (R/unit)
    Full cream milk – long life 1ℓ                              15.39                15.60                  0.21
    Loaf of brown bread 700g                                    14.14                14.11                  -0.03
    Loaf of white bread 700g                                    15.21                15.63                  0.42
    Special maize 2.5 kg                                        25.51                26.72                  1.21
    Super maize 2.5 kg                                          26.66                27.79                  1.13
    Margarine spread 500g                                       26.32                24.83                  -1.49
    Peanut butter 400g                                          32.84                33.32                  0.48
    Rice 2kg                                                    39.42                42.28                  2.86
    Sunflower oil 750mℓ                                         25.37                24.25                  -1.12
    Ceylon/black tea 62.5g                                      17.00                14.18                  -2.82
    White sugar 2.5kg                                           44.74                43.49                  -1.25
    Average difference (R/unit)                                                                            R-0.04
    Source: Stats SA, 2021

6                                          Food Price Monitor - February 2021
International food prices
The Food and Agricultural Organization (FAO) of the United Nations (UN) publishes its Food Price Index (FPI) on
a monthly basis. The FPI consists of five commodity group price indices, namely, the Meat Price Index, the Dairy
Price Index, the Cereals Price Index, the Oils Price Index and the Sugar Price Index. These indices are weighted
with the average export shares of each of the groups for 2014 to 2016. In total, 95 price quotations, considered by
FAO commodity specialists as representing the international prices of the noted food commodities, are included in
the overall index. Figure 3 shows the overall monthly real (deflated) FAO FPI from 2016 to 2021, with January 2021
reaching an index level of 112.7 points, up 8.7% from January 2020.
Figure 3: International monthly real FPI
Source: FAO, 2021
*Note: Current year
Food Price Monitor - February 2021 7Figure 4 shows the price indices in real terms for five food categories. The monthly (January 2021 vs. December
2020) growth percentages indicated increasing trends for three of the five indices. The annual (January 2021 vs.
January 2020) growth percentages indicated increasing trends of 25.7% for Oils Price Index, 21.7% for the Cereals
Price Index and 5.9% for the Sugar Price Index, whilst the Meat Price Index reflected the only annual decline
percentage of 9.0%.
Figure 4: Real price indices for five food categories
Source: FAO, 2021
The FAO Food Price Index (FFPI)¹ in nominal terms, reflecting increasingly tight global supply with lower-
averaged 113.3 points in January 2021, 4.7 points (or than-earlier-expected production and stock estimates in
4.3%) higher than in December 2020, not only marking the United States of America and substantial purchases
the eighth month of consecutive rise but also registering by China. Concerns over drought in South America and
its highest monthly average since July 2014. The latest a temporary suspension of maize export registrations in
increase reflected strong gains in the sugar, cereals Argentina added support, pushing international maize
and vegetable oils sub-indices, while meat and dairy prices up to their highest level since mid-2013. Among
values were also up but to a lesser extent. other coarse grains, barley prices also increased in
January, by 6.9%, supported by stronger demand and
The FAO Cereal Price Index in nominal terms, price increases for maize, wheat and soybeans, while
averaged 124.2 points in January 2021, marking a sharp sorghum prices remained stable. Wheat prices also
increase of 8.3 points (or 7.1%) from December 2020 registered strong increases in January, up by 6.8%,
and the seventh consecutive monthly rise. International influenced by the strength in maize prices as well as
maize prices increased significantly, surging by 11.2% strong global demand and expectations of reduced
in January, up 42.3% above their January 2020 level, sales by the Russian Federation from March 2021, when
¹Unlike for other commodity groups, most prices utilized in the calculation of the FAO Meat Price Index are not available when the FAO Food Price
Index is computed and published; therefore, the value of the Meat Price Index for the most recent months is derived from a mixture of projected and
observed prices. This can, at times, require significant revisions in the final value of the FAO Meat Price Index which could in turn influence the value
of the FAO Food Price Index..
8 Food Price Monitor - February 2021the wheat export duty will double. As for rice, robust The FAO Meat Price Index² in nominal terms, averaged
demand from Asian and African buyers, combined with 96.0 points in January 2021, up 0.9 points (1.0%)
tight supplies in Thailand and Viet Nam, continued to from December 2020, marking the fourth consecutive
underpin export prices in January 2021. monthly increase, but still down 7.6 points (7.3%) from
the corresponding month last year. International price
The FAO Vegetable Oil Price Index in nominal terms, quotations for all meat types that constitute the index
averaged 138.8 points in January 2021, up 7.7 points increased in January, with those of poultry meat rising
(or 5.8%) from December 2020 and marking the highest the most, especially for Brazilian origins, underpinned
level since May 2012. The index’ eighth consecutive by brisk global import demand while avian influenza
monthly increase mainly reflected higher prices for palm, outbreaks constrained poultry exports from several
soy and sunflower seed oil. With reduction in palm oil European countries. Despite high purchases by China
production in Indonesia and Malaysia due to excessive in the run-up to the country’s New Year celebrations,
rainfall (and, in the case of Malaysia, continued bovine and pig meat price quotations increased only
shortages in migrant labour force), international palm slightly, as global supplies remained adequate to
oil quotations climbed to a level not seen in the last meet demand. Ovine meat prices firmed for a fourth
eight-and-a-half year. Meanwhile, international soy-oil consecutive month, driven by tight supplies from
prices rose for the eighth month in succession, fuelled Oceania and strong demand from China.
by reduced export availabilities and prolonged strikes
in Argentina. For sunflower seed oil, continued rising The FAO Sugar Price Index in nominal terms, averaged
prices stemmed from lingering global supply tightness 94.2 points in January 2021, up 7 points (8.1%) from
owing to sharply reduced 2020/21 sunflower seed December 2020 and reaching the highest level since
harvests. May 2017. The increase in prices mostly resulted from
concerns over lower global availabilities in 2020/21,
The FAO Dairy Price Index in nominal terms, averaged following worsening crop prospects in the European
111.0 points in January 2021, up 1.7 points (1.6%) from Union, the Russian Federation and Thailand, and drier-
December 2020, rising for the eighth consecutive month than-normal weather conditions in South America.
and placing the index at 7.1 points (6.9%) above its value Further support to sugar prices was provided by recent
in the corresponding month last year. In January 2021, increases in crude oil prices and the strengthening of
butter and whole milk powder (WMP) price quotations the Brazilian Real against the US Dollar, which tends to
increased, underpinned by China’s high purchases in affect shipments from Brazil, the world’s largest sugar
the wake of the country’s upcoming New Year holiday exporter. Continued robust global import demand for
festivities amid seasonally lower exportable supplies in sugar also supported prices. The upward pressure on
New Zealand. Price quotations for skim milk powder prices was somewhat limited by the large exportable
(SMP) also rose, pressured by high import demand supplies in India amid expectations of a bumper crop
for spot supplies and lagging production activities in and the Government’s approval of export subsidies for
Western Europe. By contrast, cheese prices fell slightly the 2020/21 season.
from the highs registered in December 2020 due to
limited internal sales in Europe, coupled with a stock
build-up in the United States of America.
²Unlike for other commodity groups, most prices utilized in the calculation of the FAO Meat Price Index are not available when the FAO Food Price
Index is computed and published; therefore, the value of the Meat Price Index for the most recent months is derived from a mixture of projected and
observed prices. This can, at times, require significant revisions in the final value of the FAO Meat Price Index which could in turn influence the value
of the FAO Food Price Index.
Food Price Monitor - February 2021 9Estimated impact of food inflation on consumers
The purpose of this section is to illustrate the impact of food inflation on consumers. The analysis presented in
the first part of this section is based on the cost of a basic food basket³ (as originally compiled by the Food Price
Monitoring Committee in 2003, which was revised in January 2017) and, based on monthly average food price data
for the period January 2021 to January 2020.
In January 2021, the cost of this basic urban food basket was R971.98, increasing by 9.8% from January 2020 (year-
on-year increase) and increasing by 1.3% from December 2020 (month-on-month change). The cost of this food
basket expressed as a share of the average monthly income⁴ of the poorest 30% of the population increased from
59.5% in January 2020 to 65.3% in January 2021. The cost of the food basket expressed as a share of the average
monthly income of the wealthiest 20% of the population increased from 3.2% in January 2020 to 3.4% in January
2021. (Figure 5).
Figure 5: The cost of a typical consumer food basket for the period January 2017 to January 2021, expressed
in nominal terms and as share of the average income of the poorest 30% of households (Expenditure
Deciles [ED] 1-3) and the wealthiest 20% of households (ED 9-10)
Sources: BFAP calculations, based on Stats SA monitored price data for urban areas, 2021
³Composition of food basket: Apples fresh (per kg), Baked beans tinned (410g), Bananas fresh (per kg), Beans dried (500g), Beef mince fresh (per kg),
Beef offal fresh (per kg), Bread loaf brown (700g), Bread loaf white (700g), Cabbage fresh (per kg), Cheese cheddar (per kg), Chicken giblets (per kg),
Chicken portions IQF (2kg), Coffee instant (250g), Eggs (1.5 dozen), Fish (excl. tuna) tinned (400g), Maize meal super (5kg), Margarine brick (500g),
Milk full cream long life (1ℓ), Onions fresh (per kg), Oranges fresh (per kg), Peanut butter (400g), Polony (per kg), Potatoes fresh (per kg), Rice (2kg),
Sugar white (2.5kg), Sunflower oil (750mℓ), Tea Ceylon/black (250g), Tomatoes fresh (per kg).
⁴The cost of the typical food basket was expressed as a share of estimated average monthly income of Expenditure Deciles 1 to 3, the poorest 30%
of the population, as calculated from the STATSSA Living Conditions Survey 2014/2015 (household income estimated by total expenditure of house-
holds on all items).
10 Food Price Monitor - February 2021To further explore the impact of inflation on consumers, Figure 6 presents an illustration of the average
monthly nominal cost of specific food groups within the basic food basket, comparing January 2021
to January 2020. Food groups with more prominent inflation included bread & cereals, bean products
(legumes), meat & fish and dairy & eggs.
Figure 6: Nominal cost growth of specific food groups within the NAMC’s 28-item food basket, comparing
January 2021 to January 2020 (y-o-y) and January 2021 vs. December 2020 (m-o-m)
Sources: BFAP & NAMC calculations, Stats SA, 2021
The various food groups within this food basket are discussed in more detail in Table 4 below.
Food Price Monitor - February 2021 11Table 4: Overview of contributions to annual food price increases within the 28-item NAMC food basket, January 2021
to January 2020
Overall inflation
rate
Minor
Non-contributors
Jan Major contributors to contributors
Food group Oct to inflation in this Comments
2021 inflation in this category to inflation in
2020* vs. category
vs. Jan this category
Oct 2019
2020
Polony (+30.5%)
Beef offal (+16.4%) Most significant
IQF chicken portions inflation on
Animal
+13.6% +4.6% (+14.6%) None None polony, beef
protein
Chicken giblets (+13.6%) offal and IQF
Beef mince (+6.6%) chicken.
Tinned fish (+5.9%)
Most significant
Rice (+52.7%) inflation on
Bread and White bread (+15.7%) rice, but also
+25.6% +19.1% None None
cereals Maize meal (+14.9%) high inflation
Brown bread (+13.6%) on other staple
options.
Potatoes Cabbage (-9.1%) Inflation on
Vegetables -0.9% +9.3% Tomatoes (+5.9%)
(+0.1%) Onions (-2.7%) tomatoes.
Bananas (+31.0%) Bananas
Fruit -4.0% +5.3% None Apples (-4.1%)
Oranges (+38.5%) (+11.8%)
Cheddar cheese (+6.1%) High inflation
Dairy +5.6% +15.9% None None
Milk (+5.1%) on eggs, some
inflation on milk
Eggs +19.9% +22.9% Eggs (+19.9%) None None and cheese.
Brick
Fats and Inflation on
+5.3% +6.1% Sunflower oil (+10.5%) margarine None
oils sunflower oil.
(+0.3%)
Inflation mainly
Dried beans (+40.2%)
Bean on dried beans
+17.9% +12.6% Peanut butter (+9.4%) None None
products and peanut
Baked beans (+4.0%)
butter.
Coffee and Ceylon/black tea Inflation on
-2.8% -0.2% Instant coffee (+11.2%) None
tea (-16.2%) instant coffee.
Sugary Some inflation
+3.0% +10.3% White sugar (+3.0%) None None
foods on sugar
Sources: BFAP & NAMC calculations, Stats SA, 2021
*Note: Previous Food Price Monitor analysis period prior to January 2021 vs. January 2020
Thus, when comparing January 2020 to January 2021 retail prices, higher price inflation (6% or more) were observed
for the following products within the NAMC food basket (in order from highest to lowest inflation): Rice, dried beans,
polony, eggs, beef offal, white bread, super maize meal, IQF chicken portions, chicken giblets, brown bread, bananas,
instant coffee, sunflower oil, peanut butter, beef mince and cheddar cheese. The items with high inflation could have
negative implication in terms of basic food security (staple food inflation) as well as dietary diversity (e.g. inflation on
meat and fruit). When comparing the inflation rates for January 2021 to January 2020, with October 2019 to October
2020 (i.e. the previous Food Price Monitor analysis period) the rate of inflation was higher for bread & cereals, eggs,
bean products and animal protein foods.
12 Food Price Monitor - February 2021The impact of inflation on very poor consumers is further explored below, based on the typical portion sizes of very
poor consumers of the five most widely consumed food items in South Africa. These food items include maize
porridge, brown bread, sugar, tea and full cream milk (National Food Consumption Survey - Steyn & Labadarios,
2000⁵; Oldewage-Theron et al, 2005⁶). Figure 7 illustrates the estimated portion costs for these foods, calculated
from monthly food price data for January 2020 and January 2021. Similar to other Food Price Monitor analysis
periods, the significant cost contribution of maize meal and bread to the typical basic daily food selection for poor
consumers are emphasised by the results in Figure 7.
Furthermore, despite the relatively low actual food weight contribution of bread to this ‘food plate’, the bread
component costs more than the maize porridge component (about 40% more in this case for January 2021). When
comparing, the costs associated with the typical portion sizes of very poor consumers for the five most widely
consumed food items in South Africa, based on January 2021 versus January 2020 prices the results in Figure 7
indicated inflation of about 10.4% (from R6.15 to R6.79 for the selection of typical portions). All items except tea
revealed positive inflation. From December 2020 to January 2021 the costs associated with the typical portion sizes
of the five most widely consumed food items by the poor remained constant.
Figure 7:Average nominal cost for the typical portions of the five food items most widely consumed by very
poor consumers in South Africa, January 2021 vs. January 2020
Sources: BFAP calculations, Stats SA, 2021
⁵Steyn NP, Labadarios D. National Food Consumption Survey: Children aged 1–9 years, South Africa, 1999. Cape Town: The Department of Health
Directorate Nutrition, 2000
⁶Oldewage-theron W, Dicks E, Napier C, et al. Situation analysis of an informal settlement in the Vaal Triangle. Development Southern Africa 2005;
22 (1): 13-26
Food Price Monitor - February 2021 13Domestic Outlook
With the festive season behind us, one might have crop in 2020. This supported cash flow for producers
expected food inflation to slow down in January, as in mixed enterprises, enabling a more aggressive
demand typically declines through this period, before rebuilding approach which constrains current supply.
turning upwards again as the Easter period approaches. The longer production cycle however implies that such
Nevertheless, most food product prices increased, with supplies take time to get into the market and with the
fruit, meat and oils & fats reflecting the strongest growth. Easter period also approaching, prices may remain
higher in the short term – particularly in light of high
Fruit products are primarily export oriented, but also feed grain prices.
seasonal in nature. For products such as citrus,
avocadoes, apples and pears – all of which reflected Global market dynamics have also been a key factor
strong month on month increases, the harvest season is influencing prices of oils & fats, as well as cereals.
approaching and while supply is very limited in January, At a global level, price increases evident over the
storage facilities are typically also being prepared past quarter accelerated in January on the back of
for new harvests, resulting in supply constraints that reduced supply and lower than expected stock levels.
drive prices up. These price increases are expected A combination of strong import demand from China, for
to moderate in the coming months, as the new season both grains and oilseeds, and weather related factors
harvest starts to come in. that reduced supply pushed global grain and oilseed
prices to levels last observed in 2013. These prices
Beef product prices also increased sharply, with have spilled into the South African market, as South
lamb products at the forefront, but beef, poultry and Africa is a net importer of wheat and rice, as well as
pork product prices all increased. Meat markets are a net exporter of maize. The area planted to summer
particularly sensitive to international markets, as South crops such as maize and soybeans increased by 6%
Africa remains a net importer of chicken and the rising and 14% respectively in 2021 and even at average yield
prominence of beef exports has increased the sensitivity levels, this would provide a well above average crop. As
of the sector to global factors in recent years. In the this new season crop comes in quarter 2 of 2021, prices
global context, meat prices declined earlier in 2020 as may moderate from current high levels, but given the
a result of COVID-19 related restrictions on economic sharp increases in international markets, even a decline
activity, but as sentiments improve accelerating rollout to export parity levels will only induce a small decline in
of vaccines, the recovery in global meat prices may domestic price levels. With the first substantial supply
persist, lending support to domestic price levels in the response in the global market expected in the Northern
coming months. hemisphere season, current high prices may persist for
a few months, lending support to domestic price levels.
Apart from international market influence, domestic
meat prices are also influenced by supply and demand A key factor driving food inflation is the exchange rate,
conditions. While demand is expected to weaken in which remains a key uncertainty in the coming months.
the short term following festive season gains, supply The volatility evident in the exchange rate in recent
in many instances is also constrained. South Africa months reflects the influence of global sentiment towards
remains in a rebuilding cycle for both beef and lamb, risk and emerging markets, as well as fundamental risk
with beef herd rebuilding in particular being accelerated factors domestically. These factors will likely remain
by improved weather conditions and the large summer finely balanced, resulting in persistent volatility in the
coming quarter, which will also influence the rate of food
inflation.
14 Food Price Monitor - February 2021BACKGROUND INFORMATION
The NAMC monitors food prices at retail level and releases regular authoritative reports. The Department of Agriculture,
Forestry and Fisheries (DAFF) established the Food Price Monitoring Committee (FPMC) at the NAMC to track and
report food price trends in South Africa; to provide explanations of the observed trends and to then advise the Department
on any possible action that could be taken should national and household food security be threatened. The FPMC was
established after the high food price episode of 2000/01 season. The functions of the FPMC were continued by the
NAMC after the FPMC completed its work in August 2004. The NAMC issues four quarterly Food Price Monitoring
reports annually and, since 2005, also publishes an annual Food Cost Review report, which documents the margins
between farm and retail prices of the major food products, amongst other topics. In 2015, the NAMC began releasing
a quarterly Farm-to-Retail-Price-Spread (FTRPS) publication, which seeks to provide more insight into the factors
driving commodity and food price margins. This publication, the Food Basket Price Monthly report, came as a result of
discussions with industry to keep a more frequent watch on the movements of food prices.
Compiled by:
Price trends: Outlook/BFAP:
Corné Dempers Hester Vermeulen
Tracy Davids
Design by Sylvester Moatshe
Enquiries: Dr. Christo Joubert: +27 12 341 1115 or christo@namc.co.za
© 2021. Published by the National Agricultural Marketing Council (NAMC).
Disclaimer:
Information contained in this document results from research funded wholly or in part by the NAMC acting in good faith.
Opinions, attitudes and points of view expressed herein do not necessarily reflect the official position or policies of the
NAMC. The NAMC makes no claims, promises, or guarantees about the accuracy, completeness, or adequacy of the
contents of this document and expressly disclaims liability for errors and omissions regarding the content thereof. No
warranty of any kind, implied, expressed, or statutory, including but not limited to the warranties of non-infringement
of third-party rights, title, merchantability, fitness for a particular purpose or freedom from computer virus is given with
respect to the contents of this document in hardcopy, electronic format or electronic links thereto. Reference made to
any specific product, process, and service by trade name, trade mark, manufacturer or another commercial commodity
or entity are for informational purposes only and do not constitute or imply approval, endorsement or favouring by the
NAMC.
Food Price Monitor - February 2021 15You can also read