Adient ("ADNT") Investor Meeting - November 2016 - Adient Investor Relations
←
→
Page content transcription
If your browser does not render page correctly, please read the page content below

Adient (“ADNT”)
Investor Meeting

November 2016
Forward looking statements
Adient has made statements in this document that are forward-looking and, therefore, are subject to risks and uncertainties. All statements in this document other than
statements of historical fact are statements that are, or could be, deemed “forward-looking statements” within the meaning of the Private Securities Litigation Reform Act
of 1995. In this document, statements regarding Adient’s future financial position, sales, costs, earnings, cash flows, other measures of results of operations, capital
expenditures or debt levels and plans, objectives, outlook, targets, guidance or goals are forward-looking statements. Words such as “may,” “will,” “expect,” “intend,”
“estimate,” “anticipate,” “believe,” “should,” “forecast,” “project” or “plan” or terms of similar meaning are also generally intended to identify forward-looking
statements. Adient cautions that these statements are subject to numerous important risks, uncertainties, assumptions and other factors, some of which are beyond
Adient’s control, that could cause Adient’s actual results to differ materially from those expressed or implied by such forward-looking statements, including, among
others, risks related to: the expected tax treatment of the spin-off, the impact of the spin-off on the businesses of Adient, the ability of Adient to meet debt service
requirements, the risk that disruptions from the spin-off will harm Adient’s business, competitive responses to the spin-off, general economic and business conditions
that affect Adient following the spin-off, the strength of the U.S. or other economies, automotive vehicle production levels, mix and schedules, energy and commodity
prices, the availability of raw materials and component products, currency exchange rates, and cancellation of or changes to commercial arrangements. A detailed
discussion of risks related to Adient’s business is included in the section entitled “Risk Factors” in Adient’s Registration Statement on Form 10 filed with the U.S.
Securities and Exchange Commission on April 27, 2016, which the SEC declared effective on September 29, 2016, and available at www.sec.gov. Potential investors and
others should consider these factors in evaluating the forward-looking statements and should not place undue reliance on such statements. The forward-looking
statements included in this document are made only as of the date of this document, unless otherwise specified, and, except as required by law, Adient assumes no
obligation, and disclaims any obligation, to update such statements to reflect events or circumstances occurring after the date of this document.

In addition, this document includes certain projections provided by Adient with respect to the anticipated future performance of Adient’s businesses. Such projections
reflect various assumptions of Adient’s management concerning the future performance of Adient’s businesses, which may or may not prove to be correct. The actual
results may vary from the anticipated results and such variations may be material. Adient does not undertake any obligation to update the projections to reflect events or
circumstances or changes in expectations after the date of this document or to reflect the occurrence of subsequent events. No representations or warranties are made
as to the accuracy or reasonableness of such assumptions or the projections based thereon.

This document also contains non-GAAP financial information because Adient’s management believes it may assist investors in evaluating Adient’s on-going operations.
Adient believes these non-GAAP disclosures provide important supplemental information to management and investors regarding financial and business trends relating
to Adient’s financial condition and results of operations. Investors should not consider these non-GAAP measures as alternatives to the related GAAP measures. A
reconciliation of non-GAAP measures to their closest GAAP equivalent are included in the appendix. Reconciliations of non-GAAP measures related to FY2017 guidance
have not been provided due to the unreasonable efforts it would take to provide such reconciliations.

                                                                                                                                                                             2
Meeting agenda

     > Introduction to Adient & business overview

     > China / JV overview

     > Financial overview

     > Q&A

     > Appendix

                                                    3
Numerous reasons Adient is a solid investment
Market Position
> Broadest and most complete range of seating products
> Unparalleled customer diversity– market leadership in North America, Europe and China (unique and
longstanding position in China through JV structure); support all major automakers (190+ active platforms)
Earnings Growth
> Lean and improving cost structure (targeting restructuring actions in process)
> Upward trend in profitability expected to continue; ~200 bps margin improvement expected over the mid-term
Cash Generation
> Proven record of generating substantial cash flow
> Cash generation will enable Adient to transition from a levered company to an investment grade company
while enhancing shareholder value through a competitive dividend
> Cash generation will support Adient’s profitable growth strategy (organic & inorganic)
4
For many years Automotive was the growth engine of
 Johnson Controls
Revenue
                                                                                                                                                    YFAI
                                                                                                                            Hammerstein,
  33                                                                                                                                              Interiors
                                                                                                                            Keiper, Recaro
                                                                                                                                                     JV
  30          ˃ Recent JCI multi-industrial strategy constrained investment in automotive                         Michel
                                                                                                                  Thierry
  27
                                                                                                            JCIM JV
  24
                                                                          Sagem
  21                                                   Ikeda
                                         Becker       Bussan
  18                                                                                                                                           Sale of
                                    Yanfeng                                                                                                  Electronics
  15                                  JV

  12                            Prince

             Naue       Roth
   9                   Freres
            Group &
           Lahnwerk
   6
        Hoover
   3   Universal

   0

                                                     Revenue ($billion)           100% Unconsolidated JVs

                                                                                                                                                              5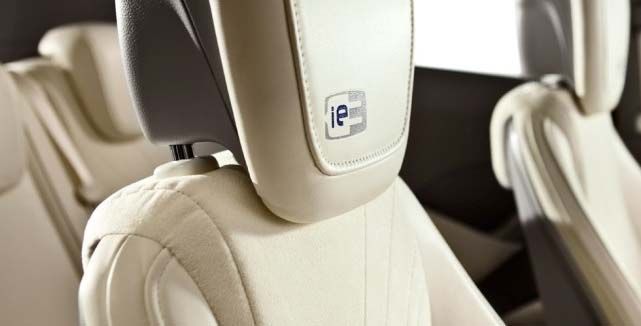
Adient today

  The largest global automotive seating supplier, supporting all major automakers in the differentiation of their
                         vehicles through superior quality, technology and performance.

                    FY 2016                    230+                  25+                   75,000
      ~$17 billion                             locations globally    million seat          highly engaged
      Consolidated revenue                                           systems a year        employees
      ~$8 billion
      Unconsolidated seating revenue

      ~$8 billion
      Unconsolidated interiors revenue

                                                                                                                    6
Introducing Adient
Key changes going forward
                     Past                                                      Today
> Part of a global multi-industry company                 > Focus on automotive seating
                                                             ‒ Leaner cost structure
> Improving business performance
                                                          > Expect 200 bps of margin improvement with
                                                            double-digit EPS growth over the mid-term
> Capital allocated to support
  multi-industry transformation                           > Strong cash flow provides flexibility
                                                            and ability to de-lever
                                                          > Targeted capital allocation strategy

                                                          > Smart reinvestment
                                                             ‒ Growth capex, capital return and
                                                               opportunistic M&A

                       Focus on Increasing Value for Shareholders and Customers

                                                                                                        7
Adient’s vision and mission bring focus to our success

                Vision

    Improving the Experience
      of a World in Motion

                Mission
We will be the world-class automotive
seating supplier through leadership in
cost, quality, launch execution, and
customer satisfaction. We will
leverage our capabilities to drive
growth, both within and beyond the
automotive industry.

                                                         8
Broadest and most complete range of Seating
& Interior Products
Seating Seating
Adient Automotive Yanfeng Global Automotive Interiors
> Complete Seat / Just-In-Time > Instrument Panels
Manufacturing > Floor Consoles
> Front & Rear Seat Structures > Door Panels
> Track, Recliner, Manual Height Adjuster > Overhead Consoles
and Lock Mechanisms
> Decorative Trim
> Foam Cushions & Backs
> Head Restraints & Armrests
> Trim Covers & Fabrics
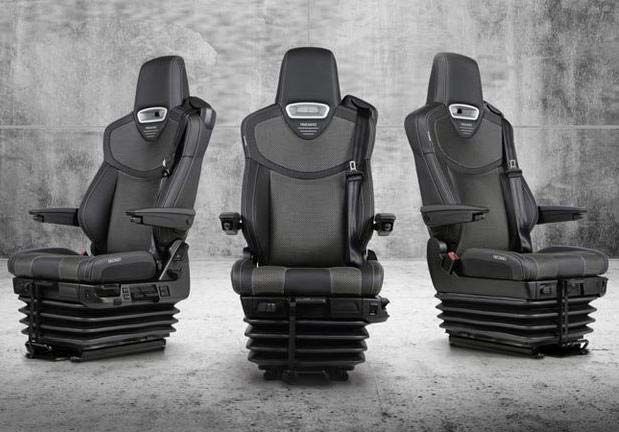
> RECARO High Performance Seating
> Commercial Vehicle Seating
9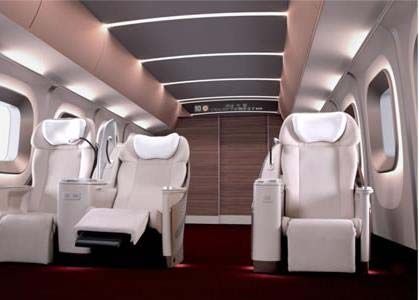
Global market leader with diversified geographic exposure

                             Global market share                                               Revenue by geography

Adient                                                         Lear        Europe / Africa
                                                                                                                                   Americas

                             34%                              Faurecia                             35%
                                                                                                                       29%

                                                                  Toyota
                                                                Boshoku
                                                                                                                       6%
                                                                                                                                   Asia / Pacific
                                                               Magna                                     30%
       Other                                                                  China

                                                                                  Early investment in emerging markets allowed Adient to take
                                                                                   advantage of the globalization of the automotive industry

Adient share Includes non-consolidated revenue
Revenue based on FY2015 (consolidated and non-consolidated)
Source: IHS Automotive and management estimates

                                                                                                                                                10
Global competitive market position
Total Market Size 2015: $59.8 Billion
> Adient is the leading player 2012–2014 CAGR 1.5% 1.5% 11.3% 1.0%
globally and in every major region 2015–2019 CAGR 2.5% 2.5% 5.1% 4.7%
$20.4B $14.7B $13.9B $10.8B
worldwide
‒ Leading automotive seating
market share in North America
and Europe
‒ Leadership position in China,
the world’s largest and one of
the fastest growing automotive
markets
> Through our JVs, we plan to
invest >$1bn in the Asia region
‒ Primarily to drive continued
growth in China
Segment Americas Europe China SE Asia,
Japan, Korea
Source: IHS Automotive with management adjustments. Adjustments are based on management’s knowledge of customer schedule details and participation in the global automotive seating market, and include identification of
the seating provider for certain vehicle models unidentified by IHS Automotive, among others.
11Our customer portfolio is the envy of the industry and closely
mirrors our customer’s global market share
Others
JLR 4% Ford
BMW 3% 13%
4%
Volvo
4% Key Takeaways
Other
Renault, Peugeot
& Citroen
4%
GM > Industry leading diversification
9%
5%
N. American
> By customer -- largest
Mercedes
European
OEM's
OEM's
34%
customer accounts for 13% of
7% 33% total consolidated sales
FCA
12%
> By platform -- largest platform
Asian accounts for ~5% of total
OEM's
VW
10%
29% consolidated sales
> Ability to leverage products
Toyota
Honda 9% across customers and regions
6%
Hyundai/Kia Nissan > Scale provides leverage to
6% 8%
optimize cost structure
Based on FY16 Consolidated Sales
12Seating – growth market
1 Industry Growth1 2 Mix
> Global light vehicle production remains robust > Mix of Foam/Trim/JIT sourcing and component sourcing
and is expected to reach production levels of > Continued shift towards SUV’s / MPV’s globally
101 million vehicles by 2020
> Increase in luxury / comfort features
> China continues to grow more rapidly than other
major markets (4.2% CAGR), albeit at a lower but
more sustainable rate than in past years
China LV Sales (mm of units) 30.0
28.9
27.6
27.0
26.3
24.4 Content Growth 3
> Increase in passenger-focused technologies:
‒ Occupant sensing
2015A 2016E 2017E 2018E 2019E 2020E
‒ Seat heating / cooling
‒ Massage features
‒ Passenger health and wellness
‒ Advanced seat adjustability
> Connected car / autonomous driving provide large
potential for content growth
‒ Adient offers complete interior solution to potential
new entrants
‒ Autonomous trend likely to have a significant impact
on interior content
1. Source: IHS Automotive.
13The industry is shifting
Trends & key questions 2020 and beyond
Traditional manufacturers ... ... and the new players Industry trends
> Autonomous driving
> Electrification
> Internet of things
> Connectivity
> Urbanization
> Alternative propulsion
> Slim & lightweight
> Smart materials
> Individualization
Examples
> New shapes
> Safety
We address the questions of the traditional OEMs and the new players
> Shared ownership
who accelerate industry trends.
14Opportunities in new markets
Growing outside traditional auto markets
West Coast Commercial
New Players Vehicle Seating
Railway Aircraft
Seating Seating
15Meeting agenda
> Introduction to Adient & business overview
> China / JV overview
> Financial overview
> Q&A
> Appendix
16Adient – Winning in China
> We have nearly 45 percent market share of
the seating business in China, making us the
industry leader
> By leveraging our market position, we expect to
outpace the market, further expanding our share
and strengthening our leadership
> Seating in China (incl. joint ventures) highlights:
Adient Seating China
‒ $7.3 billion revenue in FY16 10
Unconsolidated Sales @ 100% ($B)
‒ 17 joint ventures
8
‒ 3 tech centers
6
‒ 1,300 engineers
‒ 60 manufacturing plants in 32 cities 4
‒ 31,000 employees 2
0
2000 2005 2010 2015 2020E
17Joint venture structure
Tailored Strategy for Each JV Equity Share
Strategic Plan Joint Venture Chinese Group Partner OEM partnered with Chinese Auto Group Adient Partner
> Components for China & SAIC
Asia Pacific
Sub-partners
> Regional growth YFJC 49.99% 50.01%
> Low cost engineering and Chang’An Dongfeng
innovation
> Operational Efficiency
> Leverage current FJC FAW 50.0% 50.0%
relationship
BJC BAIC 51.0% 49.0%
> Separate seating &
interior business GAJC
GAC 52.0% 48.0%
> Growth focus on CGJC
luxury segment
SJJ Brilliance 50.0% 50.0%
JCYM SAIC Supply all non-FAW customers 50.0% 50.0%
Seating > Grow market share
FFJC FAW Supply all FAW customers 50.0% 50.0%
Components
WFJC Wanfang Focus on global OEMs 50.0% 50.0%
> Fabrics capabilities
NNGJC NNG Focus on local OEMs 30.0% 70.0%
Interiors Yanfeng Automotive Interiors (YFAI) 30.0% 70.0%
2016A Equity Income: $357mm & Cash Dividends: $199mm
18Adient China’s current seating market share in each big auto group
% Adient’s JIT market share in each auto group, based on 2016 production volume (PV)
Where competitors have alliance with the auto group
PV seating market share per each big auto group
4.57M units 3.39M units 2.87M units 2.00M units 1.86M units
Daigong
*GHRC
78.0%
62.6%
26.4% 32.0% 28.8%
SAIC Dongfeng FAW Chang’an BAIC
Since 1997, JV model has advantaged us in each main auto group
Both global & local competitors are gradually applying this business model in China, we are no
longer the exclusive partner everywhere – thus value proposition and partnership management
become more important for future success
Source : IHS 201606 Forecast, traditional passenger vehicle ( 2016 total market size:20.4million)
Market share information: JCI internal information
*GHRC =Beijing Guanghua Rongchang
19Market trends strengthening our leading position
> Increasing growth to non-Tier 1 cities > Premium segment remains robust
‒ Well positioned to grow through our JV structure ‒ Strong and growing position with Daimler, BMW,
with all OEMs Audi, and Volvo
‒ Foreign OEMs adding competitive products in non- ‒ Significant driver of content growth
Tier 1 & 2 cities
‒ Local manufacturers recognize Adient’s value
proposition
> Shift to SUV / MPV segment > Ability to offset “price downs”
‒ New business wins with both domestic and global ‒ Scale advantage
manufacturers’ JV programs will grow our share in ‒ Mature business processes / proven capability
segment
‒ High level of localization
‒ Increased content on SUV / MPV vehicles vs.
‒ Leveraging Adient’s customer / JV relationships
sedans / wagons
20Meeting agenda
> Introduction to Adient & business overview
> China / JV overview
> Financial overview
> Q&A
> Appendix
21Adient financial overview
> Financial profile
‒ ~$17bn consolidated net sales Key Metrics Expected Range
> Consolidated seating
Net Leverage1 2.0x
‒ ~200 bps margin improvement expected in mid-term
‒ Lower SG&A
‒ Improved performance in metals business Cash on Balance Sheet 2 $550mm
‒ Wind down of remaining interiors business
Irish Domicile
‒ Strong cash generation Tax Rate
~10–12%
> China
‒ Continued unconsolidated top-line growth Higher to Support
Capital Expenditures
Growth Initiatives
‒ Increasing equity income
‒ Increasing cash dividends In-line with Auto
Dividends
Supplier Peers
1. Refer to appendix for management’s rationale for using these metrics and reconciliation to US GAAP
.
2. Pro forma cash based on preliminary opening cash balance of Adient. Refer to pg 36 for Net Leverage calculation
22Profitability on an upward trajectory
Years Ended September 30, 2015 and 2016
Net Revenues(1)
($ in billions)
$16.7 $16.8
> Consolidated revenue of $16.8M increased 1% vs. FY15 excluding the impact of the Interiors
deconsolidation and foreign exchange.
Adj. for
deconsolidation of > Unconsolidated revenue of approximately $16B in FY16.
Interiors and FX
+1% Sales in China (primarily unconsolidated) increased 46% to $11.9 billion (up 16%
excluding the impact of the deconsolidation of Interiors and foreign exchange).
FY15 FY16
Pro Forma Adjusted EBITDA(2)
($ in millions)
$1,524
$1,361 > Increase in earnings driven by a higher level of equity income, cost savings generated
from restructuring programs (including SG&A savings initiatives), and operational
efficiencies.
+12%
> Pro Forma Adj. EBITDA margin increased 90 basis points to 9.1% in FY16 compared with
FY15.
FY15 FY16
1. Net revenues for FY15 have been adjusted for the impact of deconsolidating YFAI ($2.9M) and foreign currency translation ($0.4M).
2. Refer to appendix for management’s rationale for using these metrics and reconciliation to US GAAP. 23Drivers of future earnings growth
> Positive volume trends and backlog
> Well positioned to capture growth in China
through equity income from market leading JV Increased Profitability
> Improved operational efficiencies driven by:
‒ Implementation of world-class operating system
‒ G&A reduction
‒ Metals and Mechanisms improvement
Increased Cash Flow
‒ Increased use of low-cost footprint (Mexico,
Eastern Europe and China)
‒ Improved product mix (complete seat /
JIT sourcing)
> Significant restructuring program expected to
deliver ~$100mm net earnings benefit Increased Value to Shareholders
> Leaner cost structure expected to result in
~200bps margin improvement
24Earnings growth bridge
4
Key Takeaways
> 200 bps margin improvement identified
Cumulative Savings (% of Sales)
> Key drivers:
3
(0.5-1.5%) ‒ Leaner cost structure
+1-2%
‒ Metals integration &
recovery opportunity
2
(0.5%) > Improvement expected over
+2.0% +2.0% the mid-term
1
‒ Immediate near-term impact from
corporate SG&A opportunities
‒ Longer dated impact for integration
& restructuring associated with the
0
SG&A SG&A China Metals Growth Inv. / Targeted
metals business
Benchmark Support Other Improvement
Savings
Incremental Impact of Key Margin Enhancement Initiatives (% of Sales)
25Adient cash flow profile
> Strong initial free cash flow 1
‒ Low tax rate (Irish domicile ~10-12%)
‒ Minimal working capital needs
‒ Smart reinvestment / capital expenditures (maintenance & growth)
> Growing opportunity
‒ Margin / earnings growth
‒ Increasing equity income and cash dividends
‒ Lower cash restructuring over time
> Strong cash flow profile will enable rapid de-leveraging post-spin
‒ Will allow Adient to transition towards investment grade credit metrics
1. Refer to appendix for management’s rationale for using these metrics
26FCF Growth
Key Takeaways
> FY17 expected results include:
‒ A heightened level of cash outflows
(~$280M) related to restructuring
Cumulative FCF ($ in Millions)
initiatives
‒ Anticipated one-time expenses (~$100M)
(0.5-1.5%) associated with “Becoming Adient”
+1-2%
‒ Elevated CapEx of ~$75M related to IT
and facility capital associated with stand
$250 up costs
‒ ~$20M – 30M lower dividends at YFAI
$250
(not reflective of full year run rate)
$250
> Significant improvement in FCF driven by:
(1)
‒ Lower cash restructuring
2017 FCF Restructuring Becoming Dividends Margin
(1)
Capex/Other 2019 FCF ‒ Margin growth (SG&A improvement and
Adient from JV Growth
metals performance)
Incremental Impact of Cash Flow Items
‒ Increasing dividend growth from China
JVs
1. Excludes equity income from unconsolidated joint ventures
27Adient JV equity income and cash dividend summary
Sources Equity Income Cash Dividends % Conversion
Paid
“Cash rich / low debt”
1
balance sheets 2012A $211 $143 67.8%
maximum
disbursement of 1
earnings after 2013A $302 $148 49.0%
reinvestment Adjusted for
Dividends paid in 2014A $284 $176 62.0% YFAI, %
conversion is
arrears based on prior
68.8%. YFAI
year retained earnings 2015A $295 $193 65.4% expected to
certainty of
generate a
distribution in the
“partial” cash
current year 2016A $357 $199 55.7% dividend in
FY17.
FY12A – FY16A CAGR 14.1% 8.6%
FY12A – FY16A Median 62.0%
Note: Yanfeng Automotive Interiors (YFAI) JV formed on July 2, 2015, and did not generate a cash dividend to Adient in FY2015 or FY2016.
1. Includes $106 million and $3 million of non-cash gains related to fair value adjustments of Adient’s existing cash equity investments in FY2013 and FY2012, respectively. No such gains existed in FY2016, FY2015, or FY2014.
28Looking forward: FY2017 guidance
Revenue $16.8 to $17.0 billion
Adj. EBIT $1.15 to $1.2 billion
(Incl. ~$380 million of E.I.)
Depreciation &
Amortization
$400 million
Interest Expense $145 million
Effective Tax Rate 10 to 12%
Adj. Net Income $850 to $900 million
Capital
$545 to $575 million (includes ~$75 million IT and facility capital associated with stand-up costs)
Expenditures
Free Cash Flow $250 million (includes elevated level of restructuring and capital expenditures)
Reconciliations of non-GAAP measures related to FY2017 guidance have not been provided due to the unreasonable efforts it would take to provide such reconciliations
29Adient’s key investment thesis
Market Position
> Broadest and most complete range of seating products
> Unparalleled customer diversity– market leadership in North America, Europe and China (unique and
longstanding position in China through JV structure); support all major automakers (190+ active platforms)
Earnings Growth
> Lean and improving cost structure (targeting restructuring actions in process)
> Upward trend in profitability expected to continue; ~200 bps margin improvement expected over the mid-term
Cash Generation
> Proven record of generating substantial cash flow
> Cash generation will enable Adient to transition from a levered company to an investment grade company
while enhancing shareholder value through a competitive dividend
> Cash generation will support Adient’s profitable growth strategy (organic & inorganic)
30Meeting agenda
> Introduction to Adient & business overview
> China / JV overview
> Financial overview
> Appendix
31Appendix and
Financial Reconciliations
32Adient debt and maturity profile
Capitalization Detail No Near Term Maturities
($ in millions) $ Amount Coupon
($ in millions)
$ 1,600
Pro Forma Cash $ 550 $ 1,500
Revolving Credit Facility ($1.5bn) due 2021 -
$ 1,200
$1,119
New Term Loan A due 2021 1,500 LIBOR +175
$ 900
Senior Unsecured Notes (EUR) due 2024¹ 1,119 3.500 % $ 800
Senior Unsecured Notes (USD) due 2026 900 4.875 %
$ 400
Other Debt 45
Total Debt $ 3,564
$0
2017 2018 2019 2020 2021 2022 2023 2024 2025 2026
2
Net Debt $ 3,014
Term Loan A EUR Notes USD Notes
Source: Management estimates
1 - USD/EUR exchange rate at time of issuance of 1.10 USD/EUR; USD/EUR conversion for September 30,
2016 management accounts is 1.19 USD/EUR.
2 - Refer to appendix for management’s rationale for using these metrics and reconciliation to US GAAP
33Non-GAAP financial measurements
> Segment EBIT, Pro-forma Adjusted EBIT, Pro-forma Adjusted EBITDA, Free Cash Flow, Net Debt and Net Leverage are not recognized terms under
GAAP and do not purport to be alternatives to the most comparable GAAP amounts. Since all companies do not use identical calculations, our
definition and presentation of these measures may not be comparable to similarly titled measures reported by other companies.
> Segment EBIT, Pro-forma Adjusted EBIT, Pro-forma Adjusted EBITDA and Free Cash Flow are measures used by management to evaluate the
operating performance of the company and its business segments to forecast future periods.
‒ Segment EBIT is defined as income before income taxes and noncontrolling interests excluding net financing charges, restructuring and impairment
costs in accordance with U.S. GAAP, and net mark-to-market adjustments on pension and postretirement plans. General corporate and other
overhead expenses are allocated to business segments in determining Segment EBIT.
‒ Pro-forma Adjusted EBIT is defined as Segment EBIT excluding restructuring related charges, purchase accounting amortization, transaction (gains)
losses and other significant non-recurring items, and pro-forma IT dis-synergies.
‒ Pro-forma Adjusted EBITDA is defined as Pro-forma Adjusted EBIT excluding depreciation and stock based compensation.
‒ Free Cash Flow is defined as cash from operating activities less capital expenditures
‒ Management uses these measures to evaluate the performance of ongoing operations separate from items that may have a disproportionate impact
on any particular period. These measures are also used by securities analysts, institutional investors and other interested parties in the evaluation of
companies in our industry
> Net Debt is calculated as gross debt less cash and cash equivalents
> Net Leverage is calculated as Net Debt divided by Pro Forma Adjusted EBITDA
34Non-GAAP reconciliations
Segment EBIT, Pro-forma Adjusted EBIT, Pro-forma adjusted EBITDA
(in $ millions) Q1-2016 Q2-2016 Q3-2016 Q4-2016 FY16 FY15
Income before income taxes $207 $82 $143 ($42) $390 $959
Net financing charges 2 4 2 14 22 12
Restructuring and impairment costs1 -- 169 75 88 332 182
Pension mark-to-market2 -- -- -- 110 110 6
Segment EBIT $209 $255 $220 $170 $854 $1,159
Separation costs3 $60 $72 $122 $115 $369 $--
Multi-employer pension credit4 (8) (7) (8) (1) (24) (19)
Restructuring related charges5 4 3 3 4 14 16
Purchase accounting amortization6 9 10 9 9 37 23
Transaction gain7 -- -- -- -- -- (137)
Other non-recurring items8 (13) (28) (14) -- (55) --
Pro-forma IT dis-synergies9 (6) (7) (6) (7) (26) (26)
Pro-forma Adjusted EBIT $255 $298 $326 $290 $1,169 $1,016
Stock-based compensation $1 $5 $14 $8 $28 $16
Depreciation 82 81 77 87 327 329
Pro-forma Adjusted EBITDA $338 $384 $417 $385 $1,524 $1,361
1. Reflects qualified restructuring charges for costs that are directly attributable to restructuring activities and meet the definition of restructuring under ASC 420.
2. Reflects net mark to market adjustments on pension and postretirement plans.
3. Reflects expenses associated with the separation and distribution from Johnson Controls International plc.
4. Reflects the removal of multi-employer pension plan credits for pension plans that remained with Johnson Controls International plc.
5. Reflects non-qualified restructuring charges for costs that are directly attributable to restructuring activities, but do not fall into the severance, exit or disposal category and therefore do not meet the definition of
restructuring under ASC 420.
6. Reflects amortization of intangible assets including those related to the YFAI joint venture recorded within equity income.
7. Reflects transactional gains related to divestitures completed by Adient. During fiscal 2015, Adient completed its global automotive interiors joint venture with Yanfeng Automotive Trim Systems and recorded a gain
of $127 million. Also during fiscal 2015, Adient completed a divestiture in the Seating segment and recorded a gain of $10 million.
8. Reflects a first quarter 2016 $13 million favorable commercial settlement, second quarter 2016 $22 million favorable settlements from a prior year business divestitures and a $6 million favorable legal settlement, and
a third quarter 2016 $14 million favorable legal settlement.
9. Reflects IT dis-synergies as a result of higher stand-alone IT costs as compared to allocated IT costs under Johnson Controls International plc.
35Non-GAAP reconciliations
Total leverage and net leverage ratios
(in $ millions)
Sept 30, 2016
Pro forma Cash $ 550
Total debt 3,564
Net debt $ 3,014
FY16 Pro Forma Adjusted EBITDA $ 1,524
Total Leverage: 2.3 x
Net Leverage: 2.0 x
Source: Pro forma cash based on preliminary opening cash balance of Adient; Gross debt derived from management accounts as of
September 30,2016; pg 35 for FY16 pro forma adjusted EBITDA
36You can also read