The Critical Materials Company - Investor Presentation March 11, 2016 - AMG Advanced Metallurgical Group
←
→
Page content transcription
If your browser does not render page correctly, please read the page content below

The Critical Materials Company

Investor Presentation
March 11, 2016

Table of Contents

    About AMG                                         4
    Global Trends                                     5
    Critical Materials Expertise                      6
    Critical Raw Materials                            7
    Critical Materials Price Trends                   8
    Critical Materials Prices: 10 Year Perspective    9
    AMG Business Segments                            10
    Global Footprint                                 11
    Health and Safety Focus                          13
    Financial Highlights                             14
    Strategy & Outlook                               32
    Key Products & End Markets                       35
    Appendix                                         41

2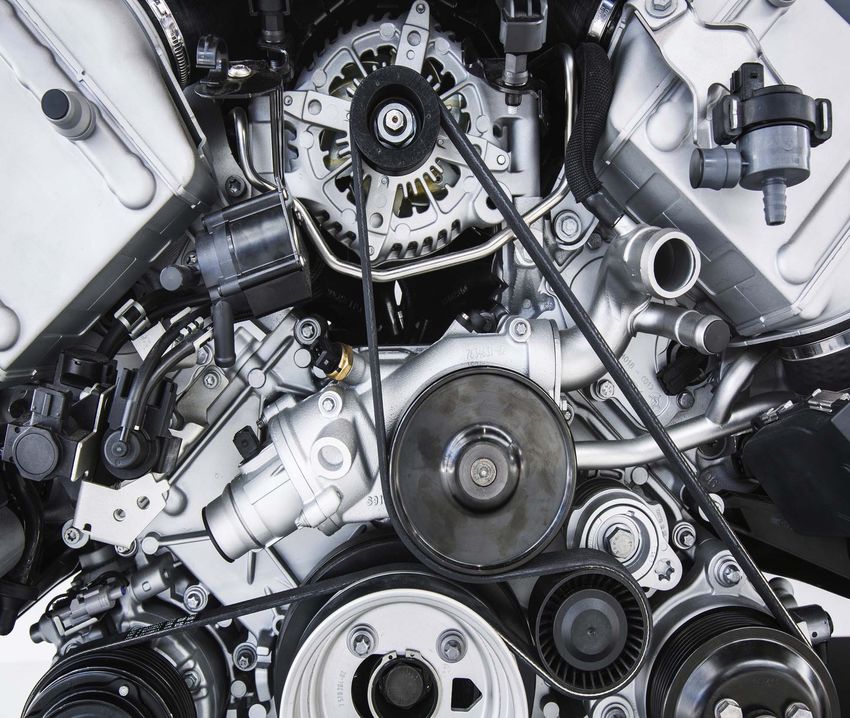
Cautionary Note

    THIS DOCUMENT IS STRICTLY CONFIDENTIAL AND IS BEING PROVIDED TO YOU SOLELY FOR YOUR INFORMATION BY AMG
    ADVANCED METALLURGICAL GROUP N.V. (THE “COMPANY”) AND MAY NOT BE REPRODUCED IN ANY FORM OR FURTHER
    DISTRIBUTED TO ANY OTHER PERSON OR PUBLISHED, IN WHOLE OR IN PART, FOR ANY PURPOSE. FAILURE TO COMPLY WITH THIS
    RESTRICTION MAY CONSTITUTE A VIOLATION OF APPLICABLE SECURITIES LAWS.

    This presentation does not constitute or form part of, and should not be construed as, an offer to sell or issue or the solicitation of an offer to buy or
    acquire securities of the Company or any of its subsidiaries nor should it or any part of it, nor the fact of its distribution, form the basis of, or be relied
    on in connection with, any contract or commitment whatsoever.

    This presentation has been prepared by, and is the sole responsibility of, the Company. This document, any presentation made in conjunction
    herewith and any accompanying materials are for information only and are not a prospectus, offering circular or admission document. This
    presentation does not form a part of, and should not be construed as, an offer, invitation or solicitation to subscribe for or purchase, or dispose of
    any of the securities of the companies mentioned in this presentation. These materials do not constitute an offer of securities for sale in the United
    States or an invitation or an offer to the public or form of application to subscribe for securities. Neither this presentation nor anything contained
    herein shall form the basis of, or be relied on in connection with, any offer or commitment whatsoever. The information contained in this presentation
    has not been independently verified. No representation or warranty, express or implied, is made as to, and no reliance should be placed on, the
    fairness, accuracy or completeness of the information or the opinions contained herein. The Company and its advisors are under no obligation to
    update or keep current the information contained in this presentation. To the extent allowed by law, none of the Company or its affiliates, advisors or
    representatives accept any liability whatsoever (in negligence or otherwise) for any loss howsoever arising from any use of this presentation or its
    contents or otherwise arising in connection with the presentation.

    Certain statements in this presentation constitute forward-looking statements, including statements regarding the Company's financial position,
    business strategy, plans and objectives of management for future operations. These statements, which contain the words "believe,” “expect,”
    “anticipate,” “intends,” “estimate,” “forecast,” “project,” “will,” “may,” “should” and similar expressions, reflect the beliefs and expectations of the
    management board of directors of the Company and are subject to risks and uncertainties that may cause actual results to differ materially. These
    risks and uncertainties include, among other factors, the achievement of the anticipated levels of profitability, growth, cost and synergy of the
    Company’s recent acquisitions, the timely development and acceptance of new products, the impact of competitive pricing, the ability to obtain
    necessary regulatory approvals, and the impact of general business and global economic conditions. These and other factors could adversely affect
    the outcome and financial effects of the plans and events described herein.

    Neither the Company, nor any of its respective agents, employees or advisors intend or have any duty or obligation to supplement, amend, update
    or revise any of the forward-looking statements contained in this presentation.

    The information and opinions contained in this document are provided as at the date of this presentation and are subject to change without notice.

    This document has not been approved by any competent regulatory or supervisory authority.

3
AMG is a critical materials company

    Global Trends           Demand                   Supply: AMG
    CO2 emission            Innovative new           Sources, processes,
    reduction, population   products that are        and supplies the
    growth, increasing      lighter, stronger, and   critical materials the
    affluence, and energy   resistant to higher      market demands
    efficiency              temperatures

4
Global Trends Driving Critical Materials Demand

                                                                                                   Increased
              Global Trends &                             Industry requires                       demand for
            Changes in Regulatory                         Material-Science
               Environments                               based innovation                        Critical Raw
                                                                                                    Materials

    CASE STUDY – Titanium Aluminides

     Global CO2         Aerospace industry driven     Aircraft engines require innovative         AMG develops highly engineered
     reduction trends   toward new technologies       technologies to decrease fuel consumption   Titanium Aluminides for the next
                        delivering weight reduction                                               generation of aircraft engines
                        and fuel efficiency

5
Critical Materials Expertise

                                       Local
                                       Presence
                                                          Complex
                                                          Multi-stage
                                                          Logistics

      Increased                                                         AMG is a global
                                           Legal
     demand for                            Regime                       leader in the
     Critical Raw                          Expertise                    management of
       Materials                                         Product        critical materials
                         Working Capital                 & Process
                         Management &                                   supply chains
                                                         Technology
                         Trade Finance

                                           Risk
                                           Management,
                                           Insurance

6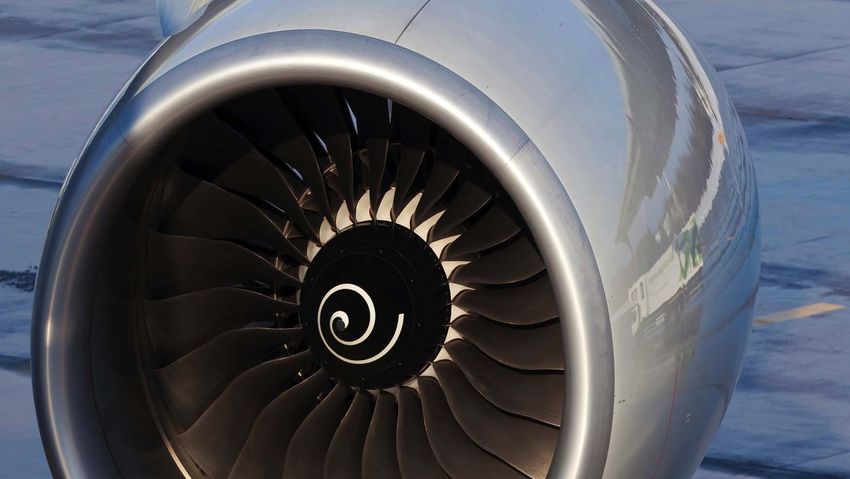
Critical Raw Materials

                                                                                                                                               •   The EU identified 20 critical
                               Heavy REE                                                                                                           raw materials* to the European
                                                                                                                                                   economy in 2014, focusing on
                                                                                                                                                   two determinants: economic
                                                                                                                                                   importance and supply risk

                         Light REE                                                                                                             •   The US identified 30 critical
                                                                                                                                                   materials* which are vital to
                                                                                                                                                   national defense, primarily
                                                                       Antimony                                                                    through assessing supply risk
    Supply Risk

                         Magnesium            Niobium

                                                                                  Natural Magnesite                                            •   AMG has a unique critical
                     Germanium
                                       Gallium                  Fluorspar         Graphite                                                         materials portfolio comprising:
                             Indium               Cobalt                                                    Tungsten
                                                                                                                                                   –5   EU critical raw materials
                                                           Silicon Metal
                                                                                                         Coking Coal
                                                                                                                                                   –4   US critical raw materials
                           Phosphate Rock           Beryllium
                                                   PGMS                                                 Chromium
                          Borate                                                                                                                   – Highlyengineered Titanium
                                                                                                                                                    Alloys for the aerospace
                                 Molybdenum              Tin
                                                                                                                                                    industry
                                                                                                           Vanadium
                          Lithium                                      Tantalum                                                                    – High
                                                                                                                                                        value added Aluminum
                                                                                                          Nickel                                    Master Alloys
                         Titanium alloys                                    Aluminum alloys
                                                                                                                                                   – Vanadium,Nickel and
                                                     Economic Importance                                                                            Molybdenum from recycled
                                                                                                                                                    secondary raw materials
                     Produced by AMG                  Melted or treated by AMG vacuum systems

                     Critical raw materials identified by the US and produced by AMG                       EU Critical Raw Materials

                   *Report on Critical Raw Materials for the EU, May 2014; Strategic and Critical Materials 2015 Report on Stockpile Requirements by Department of Defense in
7                  January 2015.
Critical Materials Price Trends

    250%

                                                                                                                                                              The cumulative average 10 year
    200%                                                                                                                                                      price appreciation of the AMG EU
                                         AMG: EU Critical Materials                                                                                           Critical Materials was 7.6
                                                                                                                             10 Yr                            percentage points higher than LME
    150%                                       10 Yr                                                                         CAGR:
                                                                                                                                                              Metals and 8.8 points higher than
                                               CAGR:                                            AMG Portfolio                3.8%                             oil, while the AMG Portfolio
    100%
                                               4.2%                                                                                                           outperformed LME Metals and oil
                                                                                                                                                              by 7.2 and 8.4 percentage points,
                                                                                                                                                              respectively
    50%                                                             OIL
                                                                10 Yr
     0%                                                         CAGR:                                                LME Metals
                                                                                                       10 Yr
                                                                -4.6%                                  CAGR:
    -50%                                                                                               -3.4%                                                  Critical Material prices
           2006          2007          2008          2009           2010          2011          2012          2013           2014         2015
                                                                                                                                                              outperform the LME

               1. AMG EU Critical Materials                         2. AMG Portfolio                   3. LME Metals                   4. Oil
                                                                       (includes #1)

           Note: Compound annual growth rates are calculated over the period Dec ‘05 through Dec ‘15 using the equation ((Ending Value / Beginning Value) ^ (1 / # of years) - 1) where ending value is
           avg monthly price in Dec ‘15 and beginning value is avg monthly price in Dec ‘05; and where AMG EU Critical Materials include Sb, Cr, Graphite & Si; AMG Portfolio includes Sb, Cr, FeV, Li, Si,
8          Sr, Graphite, Ta, Sn & Ti; and LME Metals include Al, Co, Cu, Pb, Mo, Ni, & Zn. Avg annual growth rates (plotted above) are calculated over the same period using the equation ((Ending Value /
           Beginning Value) -1) and considering the same metal categorizations where ending value is avg monthly price in Dec of the given year and beginning value is avg monthly price in Dec ‘05.
Critical Materials Prices: 10 Year Perspective

                                                                                                                                                           •   Metal prices are measured on a
                                  Dec 2015 Position                                Dec 2014 Position
                                                                                                                                                               scale of 0 to 10, with 0 and 10
                                                                                                                                      Highest                  representing the minimum and
        10                                                                                                                            Price in
                                                                                                                                      10 years                 maximum average quarterly
                                                                                                                                                               prices occurring during the past
                                                                                                                                                               10 years

        7.5                                                                                                                                                •   The positions demonstrate the
                                                                                                     Si                                                        current price level of each metal
                                                                Ti                                                                                             with respect to their various
                                                              Sponge                                6.3          Ta
                                                                                                                5.8                                            historical price points over the
                                                                 5.6                                                                                           past 10 years
Scale

                   Cr                                                                                       [unchanged]
         5                                                                           Graphite
                  4.6                                                                                                       Sb
                                                                                         4.2
                                                                 3.8          Al                                            3.8
                  3.5                                                                               3.3
                                                                             3.2
        2.5
                                          Ni                                             2.2
                              Mo                     FeV
                                          1.6
                              1.2                    1.3                     1.2                                            1.0                           AMG has significant
                              0.2
                                                                                                                                      Lowest              potential upside within
         0                                0.1        0.0                                                                              Price in
                                                                                                                                      10 years            certain critical materials
                                                                                                                                                          based on historical price
                                                                    Metals                                                                                ranges

                        Note: Ta position is unchanged versus YE 2014

              Note: Metal Positions are measured on a scale of 0 to 10, with 0 being the minimum price and 10 being the maximum price. They are calculated using the formula [(Dec ‘05 month avg –
9             min. monthly avg) / (max. monthly avg – min. monthly avg) *10] where maximum and minimum monthly averages are measured over the period 1 Dec ‘05 through 31 Dec ’15.
AMG Business Segments

           AMG Critical Materials           AMG Engineering

       AMG’s conversion, mining,      AMG’s vacuum systems and
       and recycling businesses       services business

       • Vanadium                     • Engineering
       • Superalloys                  • Heat treatment services
       • Titanium Alloys & Coatings
       • Aluminum Alloys
       • Tantalum & Niobium
       • Antimony
       • Graphite
       • Silicon

10
AMG Global Footprint – Critical Materials
UK
Germany
Czech Republic
U.S.A. France
China
Sri Lanka
Mozambique
Brazil Zimbabwe
Chromium Antimony Natural Silicon Titanium Aluminum FeV Tantalum Niobium Nickel Molybdenum
Metal Graphite Metal Alloys & Master Alloys,
Coatings Aluminum
Powders
11AMG Global Footprint – Engineering
Limbach,
Germany
Berlin, Moscow,
Guildford, Russia
UK Germany
Hanau, Germany Krakow,
Wixom (Head Office) Poland
(MI), USA
Grenoble, Tokyo,
Port Huron France Japan
(MI), USA East Windsor (CT), Suzhou,
USA China
Mexico City, Bangkok,
Mexico Mumbai, Thailand
India
Singapore,
Singapore
Headquarters Sales office Production Facility Heat Treatment Services
12Health and Safety Focus
Leading Safety Indicators
• The number of safety improvement items reported
increased by 3% compared to the 12 month period ending
December 2014. These are essential in order to avoid
potential injuries.
• Incidentseverity rate over the 12 months ending December
2015 is down 11% from the previous 12 month period.
• Days away from work resulting from these lost time
incidents are down 22%.
Period Ending Lost Time 12 Month 12 Month
December Incidents Average Lost Average
in the Last 12 Time Incident Incident
Months Rate Severity Rate Rigorous commitment
to safety reflected in
2014 36 1.20 0.19 continually improving
safety records
2015 30 1.03 0.17
13Financial
Highlights
14Full Year 2015 at a Glance
Amounts in $M FY 2015 FY 2014 % Change
(except earnings per share) • Annualized ROCE increased to
12.0% versus 11.9% in FY 2014
Revenue $977.1 $1,093.9 (11%) • Net debt/(cash): ($1.0) million
– $88.9million reduction of net
Gross profit $160.0 $184.3 (13%) debt since Q4 2014
– Net debt to LTM EBITDA: -0.01x
Gross margin % 16.4% 16.8% (2%) • The appreciation of the US Dollar
compared to the Euro in 2015 in
relation to 2014 resulted in a
Profit before income taxes $28.6 $20.7 38% reduction in revenue and EBITDA
of approximately $109 million and
EBITDA $75.6 $85.7 (12%) $10 million, respectively
EBITDA margin % 7.7% 7.8% (1%)
Net (cash) debt ($1.0) $87.8 N/A
Return on Capital Employed (ROCE) 12.0% 11.9% 1%
Net debt reduction of
$88.9 million since Q4
Net Income Attributable to Shareholders $11.1 $21.9 (49%)
2014
Earnings per share 0.40 0.79 (49%)
15AMG Share Price – Performance vs. Key Indices
33.5%
AMG has outperformed
key indices over the
9.7% 7.9%
5.7% 4.1% course of 2015,
achieving share price
-0.7% -2.1% -2.2% -2.5% appreciation of 33.5%
-6.4% during the year
-11.1%
-48.6%
-51.6%
Notes
* Bloomberg Metal refers to the Bloomberg World Metal Fabricate/Hardware Index.
** XME refers to the SPDR S&P Metals and Mining ETF, which tracks an equal-weighted index of U.S. metals and mining companies.
16 AMG and peer share price % changes reflect differences between closing prices on Jan 1, 2015 and closing prices on Dec 31, 2015 per Thomson One,
Bloomberg, and Google Finance.Financial
FinancialHighlights
Highlights
Revenue (in millions of US dollars) Gross Profit (in millions of US dollars)
$260.4 $257.0 $257.4 $44.9 $44.6
$241.9 $43.3
$220.8 $39.7
$32.4
15% 28%
YoY YoY
Q4 14 Q1 15 Q2 15 Q3 15 Q4 15 Q4 14 Q1 15 Q2 15 Q3 15 Q4 15
EBITDA (in millions of US dollars) Order Intake (in millions of US dollars)
$25.1 $81.8
$21.9 $20.4
$20.4 $67.4
56% $56.6 15%
YoY $51.9 YoY
$48.0
$9.7
Q4 14 Q1 15 Q2 15 Q3 15 Q4 15
Q4 14 Q1 15 Q2 15 Q3 15 Q4 15
17Currency
FinancialTranslation Effect&–Operating
Data: Net Debt USD to Euro
Cash flow
Revenue (in millions of US dollars)
• AMG’s financial statements are
$1,093.9 $1,086.6 prepared in US Dollars
$977.1
• Large fluctuations in the
-1% exchange rate between the US
Dollar and other currencies have
YoY a significant effect on reported
results
• The appreciation of the US Dollar
FY '14 FY '15 FY '15 compared to the Euro in 2015 in
Reported Reported Constant Currency
relation to 2014 resulted in a
reduction in revenue and EBITDA
of approximately $109 million and
EBITDA (in millions of US dollars) $10 million, respectively
$85.7 $85.7
$75.6
No change
Unchanged
YoY
YoY
FY '14 FY '15 FY '15
Reported Reported Constant Currency
18Strong Financial Performance; Executing on Strategy
Objectives Progress Update
Strong • FY 2015 Profit Before Income Tax of $28.6 million, a 38% increase versus FY 2014
Financial
• FY 2015 EBITDA of $75.6 million, a decline of 12% versus FY 2014
Performance
• Net Debt decline of $88.9 million
• FY 2015 Cash Flow from Operations of $76.3 million
• AMG Engineering Order backlog of $140.9 million as of December 31, 2015, a 10% increase
versus December 31, 2014
• Q4 ‘15 Engineering EBITDA of $2.6 million in line with $2.7 million in Q4 ’14
• AMG gross margin increased to 17.0% in FY 2015 from 16.8% FY 2014 despite falling metals
prices*
Executing on • Completed the sale of a 40% equity stake in AMG Graphite Kropfmühl GmbH to an affiliate of
Strategy Alterna Capital Partners, by way of a capital increase in combination with a 10.33% equity
interest in Bogala Graphite Lanka PLC to Alterna Capital Partners for a combined cash price
of $38M
• Secured $9.4 million of project financing from DEG for the Ancuabe Mine project in the Cabo
Delgado province of Mozambique. AMG will restart mining operations in the second quarter of
2016, with an initial projected annual production of 6,000 metric tons.
19 *AMG gross margin % excludes non-cash inventory adjustment expenses of $6.5 million FY 20152015 Financial Objectives Update
Financial Objective Description Progress Update
Refinance • Complete syndicated bank debt refinancing • Completed May 2015
by end of Q2 2015
Maintain • Optimize capital structure for financial • Net cash position of $1.0 million at end of
Conservative flexibility Q4 2015
Balance Sheet
Complete • Implement new procurement optimization • Headcount reduction achieved of 50 full
AMG Engineering program and reduce headcount time positions between Q4 2014 and Q4
Cost Reduction 2015
• Annualized savings of approximately $7
Program million per year • Full year savings in line with target of $7
million due to higher than anticipated
savings from procurement optimization
program
Improve • Increase ROCE through operational • FY 2015 ROCE improved to 12.0% from
ROCE improvements and disciplined capital 11.9% in FY 2014
management
Improve • Increase productivity through continuous • AMG gross margin increased to 17.0% in
Gross Margin cost and product mix optimization FY 2015 from 16.8% FY 2014 despite
falling metals prices*
20 *AMG gross margin % excludes non-cash inventory adjustment expenses of $6.5 million FY 20152015
AMG Highlights
2014 Objectives Update
AMG Critical Materials • AMG Vanadium – increased Ferrovanadium sales volumes following successful capacity
expansion completed in 2014
• AMG Graphite – project underway to restart operations at Ancuabe mine in Mozambique in Q2
2016
• AMG Graphite – production capacity increased by approximately 10% following commissioning of
new mill in 2014
• AMG Graphite – completion of sale of 40% Equity Stake in AMG Graphite
• AMG Titanium Alloys and Coatings – sales of TiAl alloys ramping up under long term contracts
signed in 2014
• AMG Silicon – reduction of operating costs achieved following upgrade of third furnace
• AMG Antimony – strong performance driven by increased product differentiation and recycling
activities
• AMG Brazil – Renegotiated long term tantalum contract with receipt of a cash payment from GAM
US and a 10% interest in Global Advanced Metals Pty Ltd.
AMG Engineering • Significantly improved financial results in 2015 compared to 2014
• Stronger order intake due to improving market conditions
• Successful innovation
• Glass-forming furnaces
• Powder metallurgy (additive manufacturing)
• Plasma furnaces (Titanium recycling)
• Cost reduction and project cost management system completed
21Financial Data: ROCE & EBITDA
EBITDA (in millions of US dollars)
• Q4 ‘15 EBITDA down 56%
$25.1 versus Q4 ‘14
$21.9 $20.4
$20.4 • The appreciation of the US
Q4 ‘15 EBITDA Dollar compared to the Euro in
down 56% the fourth quarter of 2015 in
$9.7 relation to the fourth quarter of
versus Q4 ‘14 2014, resulted in a reduction in
EBITDA of approximately
$2 million
Q4 '14 Q1 '15 Q2 '15 Q3 '15 Q4 '15
Annualized ROCE
• FY 2015 ROCE improved to
12.0% from 11.9% in FY 2014
11.9% 12.0%
• ROCE improvements are the
9.2% FY ‘15 ROCE result of efficient use of capital
7.4% improved to and working capital reductions
in 2015
12.0% from
11.9% in FY ‘14
2012 2013 2014 2015
22Financial
FinancialData:
Data:Net
NetDebt
Debt&&Operating
OperatingCash Flow
Cash flow
• Net (cash) debt: ($1.0) million
Net Debt (in millions of US dollars) – $161.5 million reduction on net
$194.2 debt since December 31, 2013
– Net cash position
$160.5
– NetDebt to LTM EBITDA:
$195M -0.01x
reduction in
• AMG’s primary debt facility is a
$87.8 $86.8 net debt since $320 million multicurrency term
2012 loan and revolving credit facility
$41.9
–3 year term (until 2018) with two
$20.3
extension options of one year
-$1.0
each.
2012 2013 2014 Q1 '15 Q2 '15 Q3 '15 Q4 '15 – In
compliance with all debt
covenants
Operating Cash Flow (in millions of US dollars)
• Q4 ‘15 Operating Cash Flow of
$50
$33.6 million, compared to $22.7
million in Q4 ’14
$35
Strong • Operating Cash Flow has
benefited from significant
$20 operating cash reductions in working capital
flow since 2012
$5
-$10
Q1 Q2 Q3 Q4
2012 2013 2014 2015
23Financial
FinancialData:
Data:Free
FreeCash
CashFlow & Capital Expenditures
Flows
Free Cash Flow (in USD millions)
• Second highest full year
$50 free cash flow in 2015 of
$55.8M, due to high cash
generation in H2 ’15
$25 achieved through working
Strong FY ‘15 capital reductions
free cash flow
• Continued focus in 2015
$0 performance
on EBITDA growth, efficient
use of capital and working
-$25
capital reductions to
Q1 Q2 Q3 Q4 generate free cash flow
2012 2013 2014 2015
Capital Expenditures (in millions of US dollars) • Full year 2015 capital
spending of $23.3M versus
Maintenance Growth $24.0M in 2014, a decrease
of 3%
Decrease of 3% • The largest expansion
$6.0
in Full Year 2015 capital project was for
AMG's titanium aluminides
$2.3 vs. 2014
business
$1.8
$1.7 $0.7
$4.4 $5.0
$3.4
$2.1 $2.5
Q4 2014 Q1 2015 Q2 2015 Q3 2015 Q4 2015
24Divisional Financial Highlights – Q4 2015 v Q4 2014
Revenue Gross Margin
Q4 2015 Revenue: $220.8 (in USD millions) Q4 2015 Gross Margin: 14.7%
$166.3 AMG Critical 12.5%
AMG Critical
Materials Materials** 17.0%
$199.5
Q4 2015 Q4 2015
Q4 2014 Q4 2014
AMG 21.4%
AMG $54.6 Engineering 18.2%
Engineering
$60.9
EBITDA Capital Expenditure
Q4 2015 EBITDA: $9.7 (in USD millions) Q4 2015 CAPEX: $11.0 (in USD millions)
AMG Critical $7.0 AMG Critical $10.0
Materials Materials
$19.2 $6.0
Q4 2015 Q4 2015
Q4 2014 Q4 2014
$2.6 AMG $1.0
AMG
Engineering Engineering
$2.7 $0.8
25Working
FinancialCapital Reduction
Highlights
Working Capital Days reduced by 76% since Q3’10
79
69 70 70 70
65 65 65 65 60 days,
62 61 or 76%
Reduction
53
47 47
43 42
31
30 30
28
23
19
Q3 10
Q4 10
Q1 11
Q2 11
Q3 11
Q4 11
Q1 12
Q2 12
Q3 12
Q4 12
Q1 13
Q2 13
Q3 13
Q4 13
Q1 14
Q2 14
Q3 14
Q4 14
Q1 15
Q2 15
Q3 15
Q4 15
Q3 Q4 Q1 Q2 Q3 Q4 Q1 Q2 Q3 Q4 Q1 Q2 Q3 Q4 Q1 Q2 Q3 Q4 Q1 Q2 Q3 Q4
‘10 ‘10 ‘11 ‘11 ‘11 ‘11 ‘12 ‘12 ‘12 ‘12 ‘13 ‘13 ‘13 ‘13 ‘14 ‘14 ‘14 ‘14 ‘15 ‘15 ‘15 ‘15
26AMG Critical
Financial Materials
Data: Net Debt & Operating Cash flow
• Q4 2015 revenue down $33.2
Revenue & EBITDA (in millions of US dollars)
million, or 17%, vs. Q4 2014
due to currency translation
$199.5 $202.3 $201.2 effects and weak metal prices
$187.7 Q4 2015 revenue
$166.3 • Q4 2015 EBITDA down $12.1
impacted by
$21.0 million, or 63%, vs. Q4 2014
$19.2
$17.3 $15.5 foreign currency
translation effects • The appreciation of the US
$7.0
and weak metals Dollar compared to the Euro in
prices the fourth quarter of 2015
compared to the same period
in 2014 resulted in a reduction
Q4 2014 Q1 2015 Q2 2015 Q3 2015 Q4 2015 in EBITDA of approximately
Revenue EBITDA $2 million
Capital Expenditures (in millions of US dollars)
• Capital expenditures
$21.0 $20.5 decreased to $20.5 million in
2015 compared to $21.0
Similar levels of million in 2014
capital spending
• Only significant expansion
FY 2015 vs. FY capital project was for AMG's
2014 titanium aluminides business
2014 2015
27AMG Critical Materials – Annual Revenue Drivers
FY ‘15 FY ‘14 • Revenues were adversely
Key Product Volume Price Currency
Rev ($M) Rev ($M) impacted by falling metals
prices during the year, with all
FeV & FeNiMo $100.2 $130.5 of AMG’s 9 critical materials
experiencing double digit
market price declines in 2015
Al Master Alloys
$181.4 $215.3 • AMG Critical Materials full year
& Powders
2015 sales volumes were largely
Chromium in line with 2014, with the
$80.7 $77.6 exception of Aluminum, which
Metal
decreased due to a planned
Tantalum & reduction in capacity, and Titanium
$75.2 $78.7 Master Alloys, which decreased
Niobium
due to product mix optimization
Titanium Alloys
$85.3 $105.7 • European based operating units
& Coatings were impacted by changes in the
exchange rate between the US
Antimony $90.0 $104.4 Dollar and the Euro
Graphite $58.6 $66.4
Silicon Metal $85.5 $94.8
28AMG Critical Materials – Quarterly Revenue Drivers
Q4 ‘15 Q4 ‘14 • Revenues were adversely
Key Product Volume Price Currency
Rev ($M) Rev ($M) impacted by falling metals
prices during the year, with 7 of
FeV & FeNiMo $16.9 $33.2 AMG’s 9 critical materials
experiencing double digit
market price declines compared
Al Master Alloys to Q4 2014
$43.5 $49.1
& Powders
• Ferrovanadium, Molybdenum and
Chromium Nickel price declines of 47%, 48%
$16.8 $21.6 and 40%, respectively, combined
Metal
with lower volumes in the quarter,
Tantalum & resulted in a reduction in revenue
$18.7 $17.1 compared to Q4 2014
Niobium
• Tantalum revenue increased due
Titanium Alloys
$21.2 $22.1 to timing of deliveries to
& Coatings customers
• European based operating units
Antimony $17.1 $20.3 were impacted by changes in the
exchange rate between the US
Dollar and the Euro
Graphite $13.2 $12.7
Silicon Metal $19.1 $23.1
29Critical Materials – Average Quarterly Prices
Q4 Q1 Q2 Q3 Q4 Q4 ‘15 vs. Q4 Q4 ‘15 vs. Q3
Materials ‘14 % Change ‘15 % Change
2014 2015 2015 2015 2015
Ferrovanadium
($/lb)
$12.80 $11.32 $9.76 $8.90 $6.79 (47%) (24%)
Molybdenum ($/lb) $9.34 $8.47 $7.50 $5.83 $4.85 (48%) (17%)
Nickel ($/MT) $15,786 $14,334 $13,005 $10,557 $9,434 (40%) (11%)
Aluminum ($/MT) $1,966 $1,799 $1,765 $1,591 $1,495 (24%) (6%)
Chrome ($/lb) $4.50 $4.50 $4.50 $4.41 $4.09 (9%) (7%)
Tantalum ($/lb) $87 $82 $80 $74 $59 (32%) (20%)
Niobium Oxide
($/kg)
$40 $35 $33 $28 $25 (36%) (9%)
Ti Sponge ($/kg) $10.00 $9.61 $9.40 $9.40 $9.05 (9%) (4%)
Antimony ($/MT) $9,000 $8,089 $8,617 $6,888 $5,588 (38%) (19%)
Graphite ($/MT) $977 $950 $796 $750 $750 (23%) –
Silicon (cents/lb) $146 $144 $138 $127 $114 (22%) (10%)
30AMG Engineering
Financial Data: Net Debt & Operating Cash flow
Revenue & EBITDA (in millions of US dollars)
$60.9 • Q4 2015 revenue down 10%
vs. Q4 2014, due entirely to
$56.3 EBITDA foreign currency translation
$54.7 $54.1 $54.6 effects
improvement
due to higher • EBITDA stayed in line Q4 2015
with $2.6 million versus the
sales and same period in 2014
$2.7 $3.1 $4.2 $4.9
$2.6
lower costs
Q4 2014 Q1 2015 Q2 2015 Q3 2015 Q4 2015
Revenue EBITDA
Order Intake (in millions of US dollars) • AMG Engineering Order
backlog of $140.9 million as of
$81.8 December 31, 2015, a 10%
$67.4 increase versus December 31,
$56.6 2014
$51.9 Book to bill
$48.0 • AMG Engineering signed $48.0
ratio of 0.88x in million in new orders during the
Q4 2015 fourth quarter of 2015, a 0.88x
book-to-bill ratio
Q4 2014 Q1 2015 Q2 2015 Q3 2015 Q4 2015
31Strategy &
Outlook
32Strategy
AMG’s strategy is to build its critical materials business through industry
consolidation, process innovation and product development
Industry Pursue opportunities for horizontal and vertical industry consolidation
Consolidation across AMG’s critical materials portfolio
Expansion of Pursue opportunities in high-growth areas within the existing product
Existing High portfolio
Growth Businesses
Process Continue to focus on process innovation and product development to
Innovation & improve the market position of AMG’s businesses
Product
Development
Asset Dispositions Divest peripheral assets
332016 Outlook
In this challenging environment, AMG will continue to reduce cost, optimize
its product portfolio and maintain a conservative balance sheet
AMG In this challenging environment, AMG’s management target is to maintain
2015 levels of profitability in 2016 and continue to generate strong operating
cash flow.
Change in The change in AMG’s dividend policy reflects a commitment to return value to
Dividend Policy shareholders and is a result of an improved balance sheet, ample liquidity and
confidence in our ability to generate cash.
AMG Critical Despite weak metals prices, AMG Critical Materials will continue to be
Materials profitable across all business units and generate strong operating cash flows
in 2016.
AMG AMG Engineering expects to return to historic levels of profitability in 2016.
Engineering The high order backlog, successful launch of new product lines and lower cost
base positions the division well for increased levels of profitability.
34Key Products
& End Markets
35Key Products
Revenue Gross Profit
(in millions of US dollars) (in millions of US dollars)
$280 Q4 2014 Q4 2014
$260.4 $44.9
$45
$240 Q4 2015
$220.8 Q4 2015
$32.4
$35
$200
$160 $25
$120
$15
$80
$5
$40
$- $(5)
Q4 2014 Q4 2015 Q4 2014 Q4 2015*
Vacuum Furnaces Ti Master Alloys & Coatings Al Master Alloys & Powders
Vanadium & FeNiMo Chromium Metal Antimony
Tantalum & Niobium Graphite Si Metal
36 *Includes $4.4 million non-cash expense related to vanadium, nickel and molybdenum inventory adjustments in the fourth quarter 2015Critical Materials – Market Trends
Critical Materials Major End Markets Market Trends Major Customers
AMG Antimony
Antimony Trioxide Flame Retardants Plastics
Antimony Masterbatches
Antimony Pastes
Communications &
AMG Brazil Micro Capacitors, Electronics
Tantalum & Niobium Superalloys
Fuel Efficiency
AMG Graphite Expanded Polystyrene Energy Saving
(EPS),
Natural Graphite Battery Anodes Energy Storage
AMG Silicon Aluminum Alloys, Fuel Efficiency
Silicon Metal Solar Clean Energy
Energy Transportation Infrastructure Spec. Metals & Chem.
37Critical Materials – Market Trends
Critical Materials Major End Markets Market Trends Major Customers
AMG Aluminum
Aerospace,
Aluminum Master Alloys Fuel Efficiency
Automotive
Aluminum Powders
AMG Vanadium
Ferrovanadium Infrastructure Infrastructure Growth
Ferronickel-molybdenum
AMG Titanium
Alloys & Coatings Fuel Efficiency
Aerospace
Titanium Master Alloys Energy Saving
& Coatings
AMG Superalloys UK
Aerospace Fuel Efficiency
Chromium Metal
Energy Transportation Infrastructure Spec. Metals & Chem.
38Engineering – Market Trends
Critical Materials Major End Markets Market Trends Major Customers
AMG Engineering Fuel Efficiency
Aerospace,
Capital Goods
Automotive Electronics
(Vacuum furnaces)
AMG Engineering
Aerospace,
Vacuum Heat Treatment Fuel Efficiency
Automotive
Services
Energy Transportation Infrastructure Spec. Metals & Chem.
39A Global
AMG – ASupplier of Criticalof
Global Supplier Materials
Critical Materials
FY 2015 Revenues by End Market
20% Infrastructure
22% Specialty Metals
& Chemicals
Approx. 3,000 $977 million*
employees annual
revenues
18% Energy
40% Transportation
FY 2015 Revenue by Region** AMG is a global supplier of
43% Europe Critical Materials to:
35% North America Specialty Metals
Energy Transportation Infrastructure & Chemicals
17% Asia
5% ROW
Notes: *Based on 2015 Full Year Financial Statements; **ROW refers to the rest of the world.
40Appendix 41
Consolidated Balance Sheet

     As at                          December 31, 2015   December 31, 2014
     In millions of US Dollars          Unaudited
     Fixed assets                        215.8                 237.4
     Goodwill and intangibles             28.9                  31.7
     Other non-current assets             70.2                  68.9
     Inventories                         126.4                 145.4
     Receivables                         124.3                 135.3
     Other current assets                 29.3                  51.6
     Cash                                127.8                 108.0
     TOTAL ASSETS                        722.7                778.4

     TOTAL EQUITY                        153.6                 101.0
     Long term debt                      112.2                 168.0
     Employee benefits                   137.9                 159.7
     Other long term liabilities          69.8                  68.9
     Current debt                         14.5                  27.9
     Accounts payable                    108.0                 134.4
     Advance payments                     44.2                  31.7
     Accruals                             42.9                  53.3
     Other current liabilities            39.6                  33.7
     TOTAL LIABILITIES                   569.1                 677.4
     TOTAL EQUITY AND LIABILITIES        722.7                778.4

42
Consolidated Income Statement
For the twelve months ended December 31, 2015 December 31, 2014
In millions of US Dollars Unaudited
Revenue 977.1 1,093.9
Cost of sales 817.2 909.6
Gross profit 159.9 184.3
Selling, general & administrative 122.3 133.5
Restructuring & environmental 2.3 10.4
Asset impairment expense – 1.9
Other income, net (0.9) (2.1)
Operating profit 36.2 40.6
Net finance costs 8.2 19.5
Share of profit (loss) of associates 0.6 (0.4)
Profit before income taxes 28.6 20.7
Income tax expense (benefit) 18.7 (1.0)
Profit for the period 9.9 21.6
Shareholders of the Company 11.1 21.9
Non-controlling interest (1.2) (0.3)
Adjusted EBITDA 75.6 85.7
43Consolidated Statement of Cash Flows
For the twelve months ended December 31, 2015 December 31, 2014
In millions of US Dollars Unaudited
EBITDA 75.6 85.7
Change in working capital and deferred revenue 21.6 39.0
Finance costs paid, net (11.4) (13.8)
Other operating cash flow (3.8) (9.5)
Cash flows from operations before taxes 82.0 101.4
Income tax paid (5.7) (6.3)
Net cash flows from operations 76.3 95.1
Capital expenditures (23.3) (24.0)
Other investing activities 2.8 0.9
Net cash flows used in investing activities (20.5) (23.0)
Net cash flows used in financing activities (29.1) (57.9)
Net increase in cash and equivalents 26.7 14.2
Cash and equivalents at January 1 108.0 103.1
Effect of exchange rate fluctuations on cash held (6.9) (9.2)
Cash and equivalents at December 31 127.8 108.0
44Investor Presentation March 2016
You can also read