ASIAN PAY TELEVISION TRUST
←
→
Page content transcription
If your browser does not render page correctly, please read the page content below

ASIAN PAY TELEVISION TRUST
                   31 MARCH 2022
IMPORTANT NOTICES AND DISCLAIMERS
Disclaimers

Asian Pay Television Trust (“APTT”) is a business trust registered under the Business Trusts Act 2004 of Singapore and listed on the Main Board of the Singapore
Exchange Securities Trading Limited. APTT Management Pte. Limited (“AMPL”) is the trustee-manager of APTT (the “Trustee-Manager”). The Trustee-Manager is a
wholly owned subsidiary of Dynami Vision Pte. Ltd. (“Dynami”) which is a Singapore-incorporated company fully owned by Mr Lu Fang-Ming, the former Chairman of
Asia Pacific Telecom Co., Ltd.

This presentation has been prepared based on available information. No representation or warranty, express or implied, is made as to the fairness, accuracy,
completeness or correctness of the information, opinions and conclusions contained in this presentation. To the maximum extent permitted by law, neither APTT,
AMPL, their directors, employees or agents, nor any other person accepts any liability for any loss arising from the use of this presentation or its contents or otherwise
arising in connection with it, including, without limitation, any liability arising from fault or negligence on the part of APTT, AMPL or their directors, employees or agents.
In particular, no representation or warranty is given as to the accuracy, likelihood of achievement or reasonableness of any forecasts, prospects or returns contained in
the information. Such forecasts, prospects or returns are by their nature subject to significant uncertainties and contingencies. Each recipient of the information should
make its own independent assessment of the information and take its own independent professional advice in relation to the information and any action taken on the
basis of the information.

General Securities Warning

This presentation is not an offer or invitation for subscription or purchase of or a recommendation of securities. It does not take into account the investment objectives,
financial situation and particular needs of the investor. Before making an investment in APTT, the investor or prospective investor should consider whether such an
investment is appropriate to their particular investment needs, objectives and financial circumstances and consult an investment adviser if necessary.

Information, including forecast financial information, in this presentation should not be considered as a recommendation in relation to holding, purchasing or selling
securities or other instruments in APTT. Due care and attention has been used in the preparation of forecast information. However, actual results may vary from
forecasts and any variation may be materially positive or negative. Forecasts by their very nature, are subject to uncertainty and contingencies many of which are
outside the control of APTT. Past performance is not a reliable indication of future performance.

Investors should note that there are limitations on the rights of certain investors to own units in APTT under applicable Taiwan laws and regulations. Such investors
include individuals or certain corporate entities in the People’s Republic of China (“PRC”), the Taiwan Government and political entities and other restricted entities and
restricted persons. For further information, investors should refer to the prospectus dated 16 May 2013 issued by APTT and the deed of trust constituting APTT dated
30 April 2013.

                                                                                                                                                                                  1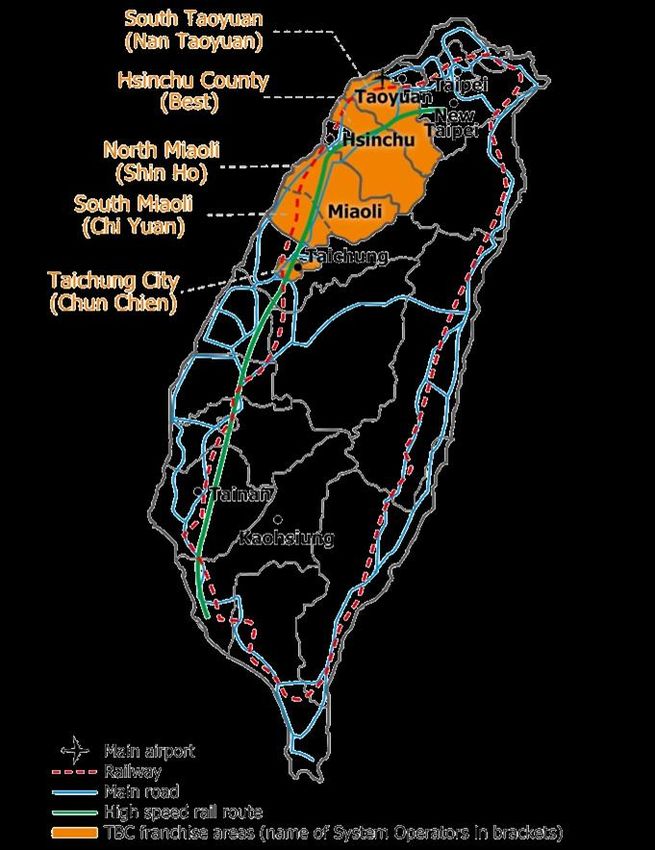
AGENDA
   1

   A

1. 31 MARCH 2022 RESULTS
2. OUTLOOK & STRATEGY
3. BUSINESS OVERVIEW
4. BUSINESS DRIVERS

                           2
31 MARCH 2022
     RESULTS

                3
HIGHLIGHTS
Broadband performance improved in Q1 2022; hedged almost 80% of outstanding onshore facilities to
mitigate risk of rising interest rates
          Lower Q1 2022 EBITDA and EBITDA margin on higher operating expenses
          •   Revenue and EBITDA at S$73.6 million and S$43.2 million; EBITDA margin stood at 58.7%
          •   Decline in EBITDA was due to higher staff costs, pole rental expenses and marketing and selling expenses

          Growing total subscriber base
          •   Premium digital cable TV and Broadband subscribers have been steadily increasing over the past 16 quarters
          •   Added c.8,000 Premium digital cable TV and c.7,000 Broadband subscribers in the quarter, which more than offset Basic cable
              TV churn; total subscriber base increased to c.1,258,000

          Continued Broadband growth momentum
          •   Growth in Broadband subscribers and higher ARPU led to higher revenue in S$ and NT$ for seven consecutive quarters
              compared to the pcp

          Lower capital expenditure
          •   Capital expenditure decreased by 9.7% for the quarter compared to pcp
          •   Aim to use excess cash generated from operations to make debt repayments, subject to operating conditions

          Debt management
          •   Entered into new TAIBOR interest rate swaps to hedge almost 80% of the outstanding onshore facilities through to 30
              June 2025; average fixed rate on these swaps was 0.89%
          •   Lowered gearing to 49.4%

          Distribution
          •   Distribution of 0.25 cents per unit declared for Q1 2022
          •   Re-affirmed distribution guidance of 1.0 cent per unit for 2022, to be paid in quarterly instalments of 0.25 cents per unit, subject
              to no material changes in planning assumptions
          •   There may be some flexibility with respect to distributions after 2022, subject to operating conditions                                4
KEY OPERATING METRICS
Broadband ARPU improved by NT$4 per month alongside c.7,000 more subscribers, reflecting the success of
TBC’s marketing outreach to target Broadband only segment and offer higher speed plans at competitive prices
RGUs1 (’000) ARPU2 (NT$ per month)
As at Quarter ended
31 Mar 2022 31 Dec 2021 31 Mar 2022 31 Dec 2021
Basic cable TV 688 691 472 476
Premium digital cable TV 281 273 73 76
Broadband 289 282 373 369
• Basic cable TV: RGUs decreased by c.3,000 in the quarter to c.688,000 as at 31 March 2022 due to (i) a saturated cable TV market, (ii)
competition from aggressively priced IPTV, (iii) growing popularity of online video and (iv) expectations from consumers for discounts as
they compare with the lower cable TV pricing outside of TBC’s3 five franchise areas, particularly in the Taipei region
• Premium digital cable TV: RGUs increased by c.8,000 in the quarter to c.281,000. ARPU was lower due to promotions and discounted
bundled packages that were offered to generate new RGUs and to retain existing RGUs. Video piracy issues and aggressively priced
IPTV have also impacted ARPU, which decreased by NT$3 per month in the quarter
• Broadband: Despite the competitive conditions from unlimited wireless data offerings from mobile operators, TBC’s focused broadband
growth strategy led to RGUs increasing by c.7,000 in the quarter to c.289,000, while ARPU improved by NT$4 per month in the quarter.
Growth driven by partnership programs with mobile operators to drive fixed-line Broadband only segment, and higher speed plans at
competitive prices. Broadband churn rates remained very low, averaging around 0.7% in Q1 2022
Notes: (1) RGUs refer to Revenue Generating Units, another term for subscribers or subscriptions; the terms are used interchangeably
(2) Average Revenue Per User (“ARPU”) is calculated by dividing the subscription revenue for Basic cable TV or Premium digital cable TV or Broadband, as applicable, by the average
number of RGUs for that service during the period
(3) TBC refers to Taiwan Broadband Communications Group 5
BROADBAND ARPU IMPROVEMENT:
                                   SHIFT TOWARDS HIGHER SPEED PLANS
                                   Increase in take-up rate of higher speed plans since Q1 2020; validates the strength of our Broadband
                                   growth strategy

                                                                                                                                                             Growth Index for uptake of speed
Total gross subscriber additions

                                                                                                                                                               plans compared to Q1-2020
                                                                                                                                                                        (Base=1)
                                    Interpretation of Growth Index from the chart above:
                                    For e.g., in Q1-2020 if there was 1 subscriber taking up higher speed plan with speed ranging from 300 Mbps to 1 Gbps, then in
                                    Q1-2022, there were 3.12 subscribers taking up the higher speed plans.

                                                                                                                                                                                                6
FINANCIAL RESULTS
Aim is to grow cash flows from Broadband business to a level that more than offsets the decline in Basic
cable TV business

                                                        Quarter ended 31 Mar                        In constant Taiwan dollars (“NT$”), total revenue down 2.9%
Group1   (S$’000)                                                                                   for the quarter; foreign exchange contributed to a positive
                                                    2022             2021 Variance2 (%)             variance of 1.8% for the quarter compared to the pcp
Revenue                                                                                              •   Basic cable TV: Down 6.6% for the quarter in constant NT$
                                                                                                         mainly due to lower subscription revenue resulting from the
Basic cable TV                                  54,699           57,477                   (4.8)
                                                                                                         decline in the number of subscribers and lower ARPU as well as
Premium digital cable TV                         3,067             3,353                  (8.5)          lower non-subscription revenue resulting from lower revenue
                                                                                                         generated from channel leasing and airtime advertising sales
Broadband                                       15,800           13,561                   16.5
                                                                                                     •   Premium digital cable TV: Down 10.3% for the quarter in
Total revenue                                   73,566           74,391                   (1.1)          constant NT$. Generated predominantly from TBC’s Premium
                                                                                                         digital cable TV RGUs each contributing an ARPU of NT$73 per
Total operating expenses3                    (30,377)          (29,006)                   (4.7)          month during the quarter for Premium digital cable TV packages
                                                                                                         and bundled DVR or DVR-only services
EBITDA                                          43,189           45,385                   (4.8)
                                                                                                     •   Broadband: Up 14.7% for the quarter in constant NT$. Generated
EBITDA margin                                   58.7%             61.0%                                  predominantly from TBC’s Broadband RGUs each contributing an
                                                                                                         ARPU of NT$373 per month during the quarter for high-speed
                                                                                                         Broadband services

                                                                                                    Total operating expenses: Higher operating expenses for the
                                                                                                    quarter mainly due to higher staff costs, pole rental expenses and
                                                                                                    marketing and selling expenses
Notes: (1) Group refers to APTT and its subsidiaries taken as a whole
       (2) A positive variance is favourable to the Group and a negative variance is unfavourable
       to the Group
       (3) Total operating expenses exclude depreciation and amortisation expense, net foreign
       exchange gain/loss and mark to market movements on foreign exchange contracts, in
       order to arrive at EBITDA and EBITDA margin
                                                                                                                                                                          7
NET PROFIT
Net profit includes non-cash items such as depreciation and amortisation expense, foreign exchange,
mark to market movements and deferred taxes

                                                                                                                                         Quarter ended 31 Mar
Group1 (S$’000)
                                                                                                                              2022                         2021             Variance2 (%)
Total revenue                                                                                                              73,566                       74,391                      (1.1)
Operating expenses
Broadcast and production costs                                                                                           (14,286)                     (14,117)                      (1.2)
Staff costs                                                                                                                (6,968)                     (6,321)                    (10.2)
Trustee-Manager fees                                                                                                       (1,814)                     (1,814)                          -
Other operating expenses                                                                                                   (7,309)                     (6,754)                      (8.2)
Total operating expenses                                                                                                 (30,377)                     (29,006)                      (4.7)
EBITDA                                                                                                                     43,189                       45,385                      (4.8)
Other expenses
Depreciation and amortisation expense                                                                                    (18,777)                     (23,382)                      19.7
Net foreign exchange gain                                                                                                      164                          928                    (82.3)
Mark to market gain on derivative financial instruments                                                                      2,441                          482                    >100
Amortisation of deferred arrangement fees                                                                                    (844)                      (1,137)                     25.8
Interest and other finance costs                                                                                           (9,615)                    (11,101)                      13.4
Income tax expense                                                                                                         (4,322)                      (3,813)                    (13.3)
Total other expenses                                                                                                     (30,953)                     (38,023)                      18.6
Profit after income tax                                                                                                    12,236                        7,362                      66.2

 Notes: (1) Group refers to APTT and its subsidiaries taken as a whole; (2) A positive variance is favourable to the Group and a negative variance is unfavourable to the Group             8
SELECTED FINANCIAL INFORMATION
Selected financial information1 are key financial metrics of APTT’s business

                                                                                                                                     Quarter ended 31 Mar
Group2 (S$’000)
                                                                                                                         2022                       2021             Variance3 (%)
Revenue
Basic cable TV                                                                                                        54,699                     57,477                         (4.8)
Premium digital cable TV                                                                                               3,067                       3,353                        (8.5)
Broadband                                                                                                             15,800                     13,561                         16.5
Total revenue                                                                                                         73,566                     74,391                         (1.1)
Total operating expenses4                                                                                           (30,377)                   (29,006)                         (4.7)
EBITDA                                                                                                                43,189                     45,385                         (4.8)
EBITDA    margin5                                                                                                     58.7%                       61.0%

Capital expenditure
Maintenance                                                                                                            3,501                       4,997                        29.9
Network, broadband and other                                                                                           3,134                       2,353                      (33.2)
Total capital expenditure                                                                                              6,635                       7,350                          9.7

Income tax paid, net of refunds                                                                                      (1,453)                     (1,250)                      (16.2)
Interest and other finance costs paid                                                                                (9,775)                   (11,058)                         11.6

 Notes: (1) Some of the selected financial information includes non-IFRS measures
        (2) Group refers to APTT and its subsidiaries taken as a whole
        (3) A positive variance is favourable to the Group and a negative variance is unfavourable to the Group
        (4) Total operating expenses exclude depreciation and amortisation expense, net foreign exchange gain/loss and mark to market movements on foreign exchange contracts, in order to
        arrive at EBITDA and EBITDA margin
        (5) EBITDA margin is a non-IFRS financial measure and is calculated by dividing EBITDA by total revenue                                                                              9
FINANCIAL POSITION
Strengthening balance sheet and managing debt levels remain a key focus
As at • Cash and cash equivalents: Cash balance of S$127.6
Group (S$’000)
31 Mar 2022 31 Dec 2021 million; approx. S$60 million needed for onshore and
Assets offshore debt repayments in 2022
Current assets
Cash and cash equivalents 127,575 124,664
• Intangible assets: Comprise mainly cable TV licences and
includes value of goodwill, franchise rights and customer
Trade and other receivables 13,408 16,089
relationships
Other assets 5,823 2,591
146,806 143,344
• Borrowings: Decrease is mostly attributable to
Non-current assets repayments of Onshore and Offshore Facilities and
Property, plant and equipment 273,438 292,493 exchange rate movement. Refer to the next slide for
Intangible assets 2,509,216 2,584,991 additional details on borrowings
Other assets 18,226 1,744
2,800,880 2,879,228 • Depreciation/amortisation: Depreciation is computed on
Total assets 2,947,686 3,022,572 a straight-line basis over the estimated useful lives of the
assets as follows:
Liabilities
Current liabilities - Buildings: 3-50 years
Borrowings from financial institutions 64,829 58,395 - Leasehold improvements: 3-10 years
Trade and other payables 61,683 53,510
Income tax payable 7,150 5,970
- Network equipment: 2-10 years
Other liabilities 56,726 63,076 - Transport equipment: 5 years
190,388 180,951
Non-current liabilities
- Plant and equipment: 2-5 years
Borrowings from financial institutions 1,390,366 1,455,097 - Right-of-use assets: 2-30 years
Deferred tax liabilities 109,334 107,194
Other liabilities 34,901 36,528
1,534,601 1,598,819
Total liabilities 1,724,989 1,779,770
Net assets 1,222,697 1,242,802
10BORROWINGS
Lowered gearing to 49.4%; to focus on accelerated debt repayment, with approx. S$60 million earmarked in
2022 to repay onshore and offshore debts
As at
Group debt
31 Mar 2022 31 Dec 2021
Total size available S$ million 1,558 1,619
Total outstanding S$ million 1,475 1,535
Effective interest rate - constant dollar % p.a. Q1 - 2.2 Full year - 2.7
Effective interest rate - SGD % p.a. Q1 - 2.6 Full year - 3.0
Net debt / EBITDA1 Multiple 7.4 7.7
Interest cover2 Multiple 4.0 3.9
Gearing3 % 49.4 50.1
• Borrowings comprised NT$ and S$ denominated loans - NT$27.8 billion (2021: NT$28.0 billion) and S$159.4 million (2021: S$171.9 million)
• Extended maturity date of Offshore Facilities by two years to Jul 2023 and Onshore Facilities by three years to Nov 2028, on the same major
terms; pared down NT$0.8 billion (approx. S$40 million) as part of Onshore Facilities’ extension, using cash on the balance sheet
• To commence discussion with lenders in 2022 to further extend Offshore Facilities to at least 2025
• New TAIBOR swaps were entered into in Q1 to hedge approx. 80% of the outstanding onshore facilities through to 30 June 2025, at an average
fixed rate of 0.89%; aim to enter into more interest rate swaps to hedge a further 10% to 15% of outstanding Onshore Facilities
• Effective interest rate in constant dollar terms of 2.2% p.a. for the quarter compared to 2.7% p.a. for 2021. Actual effective interest rate in SGD
was 2.6% p.a. for the quarter compared to 3.0% p.a. for 2021
• Approx. S$82 million of revolving facilities are available to fund working capital and future initiatives, if required
Notes: (1) Total debt outstanding less cash divided by LTM EBITDA; (2) LTM interest and other finance costs divided by LTM EBITDA; (3) Total debt outstanding (net of unamortised
arrangement fees) divided by total assets 11CAPITAL EXPENDITURE
TBC’s dense fibre network can now comfortably deliver higher speed plans and support mobile operators in the
build out of their 5G networks; network investments projected to be lower compared to the last three years,
focusing on areas that can support TBC’s aggressive push for the Broadband business
140 35%
Column1
31%
120 28% 30%
27%
26% 26% Network, broadband
101 24%
100 25% and other
89
S$ million
87 18 86
Premium digital
80 14 17 75 75 18% 20% cable TV growth
17% 19
19 56 Network expansion
60 54
53
15%
10%
49 55 53 9%
17 47
40 33 37 10% Maintenance
30
12
10 14
20 8 5%
7 Capex / Revenue
21 20 24 19 20 22 19
17 16 3
- 0% 4
1
2013 2014 2015 2016 2017 2018 2019 2020 2021 Q1 2022
• Capital expenditure was higher from 2015 to 2017 due to the regulatory requirement to switch-off analogue broadcasting and complete the digitisation of TBC’s
subscriber base by 2017
• Network investments remain key to future-proof TBC’s network; continue increasing fibre density by bringing down the number of homes served per fibre node,
beyond the current level of less than 250 homes, to (i) meet the growing demand for data and high-speed broadband services; and (ii) support mobile operators
in their 5G network rollouts – multi-year investments that present opportunities for the Trust
• Aggressive targets have been set to tighten capital expenditure; to invest within industry norms
• With lower capital expenditure, the Trustee-Manager aims to use excess cash generated from operations to gradually pay down debt
Capital expenditure in 2022 comprised the following:
- Maintenance capital expenditure to support TBC’s existing infrastructure and business
- Network, broadband and other capital expenditure include items related to expanding the fibre network such as cabling, additional equipment to upgrade the
headends, backbone and fibre nodes, DOCSIS and GPON deployments for higher speed customers, high-speed broadband modems and cable line
extensions for new buildings
Note: (1) Capital expenditure for full year 2013 is included here for information purposes only; APTT’s ownership of TBC only commenced from 29 May 2013 12OUTLOOK & STRATEGY
13POSITIONED FOR THE MID TO LONG-TERM
Initiatives to strengthen operations and drive growth, against an increasingly challenging and
competitive environment
Broadband Growth Strategy Capital Management
• Be data-backhaul ready; the contribution from data backhaul is • Interest rate swaps covering ~80% of outstanding Onshore
growing and expected to add a meaningful income stream to the Facilities hedged through to 30 June 2025
Broadband business within the next few years; multi-year • Average fixed rate on TAIBOR swaps is ~0.89%
investments for mobile operators
• Gearing stood at 49.4% as at 31 Mar 2022 (2021: 50.1%)
• Step up partnership programs with mobile operators to drive fixed-
• In 2021, successfully extended the maturity date of Offshore
line Broadband only segment
Facilities to 2023, on the same major terms; aim to further
• Develop new market segments and increase value-added extend maturity date to at least 2025
solutions that leverage Android gateway
• In 2021, successfully extended the maturity date of Onshore
Facilities to 2028, on the same major terms
• Aim to eliminate offshore debt and bring debt back to onshore to
save on interest costs over the long term
Strengthen Balance Sheet Key Investments
• Cash generated from operations to continue funding capital • Investments to focus on:
expenditure; and not to use bank borrowings
- increasing network capacity and driving higher speed plans
• With network investments past the peak, capital expenditure to be
- positioning APTT to benefit from Taiwan’s 5G rollout and
lower than the last three years; aim to use excess cash generated
drive data backhaul business
from operations to make debt repayments, subject to operating
conditions
• Monitor capital expenditure to focus on areas that can generate
Broadband growth and sustainability for long-term
14IMPACT OF COVID-19
Impact of the COVID-19 pandemic on TBC has been limited to date due to the subscription-based
nature of its business
• While the COVID-19 outbreak in Taiwan is relatively contained as compared to other countries, Taiwan’s
outlook remains uncertain as the expected downturn in other countries will invariably have an impact on
Taiwan’s export-driven economy and GDP growth. A significant and prolonged deterioration in the national
GDP, disposable income or overall economic conditions could in turn adversely affect TBC’s ability to grow or
maintain revenues, and its financial position.
• The Trustee-Manager will continue to:
- Monitor developments of COVID-19 and their related impact on operations; and
- Exercise prudence by managing operational and capital expenditure and strengthening APTT’s debt
management programme. A stronger balance sheet will provide APTT with the flexibility to navigate and
compete more effectively in today’s uncertain economic climate.
• TBC and the Trustee-Manager have activated their respective Business Continuity Plans that adhere to all
regulations and guidelines in their respective jurisdictions.
15OUTLOOK
APTT is positioned to grow in a measured way
GROWTH DRIVERS OPERATING ENVIRONMENT
UP-SELL & CROSS-SELL BROADBAND RGU GROWTH CHALLENGING ENVIRONMENT
• Continue to build on the up-sell & cross- • Intensify marketing efforts by stepping up • ARPUs continue to remain under pressure
sell initiatives across TBC’s subscriber partnership programs with mobile operators to due to growing popularity of online TV,
base to drive growth in future cash flows focus on fixed-line Broadband only segment, and challenges from video piracy issues,
by offering higher speed plans at competitive aggressively priced IPTV and competition
• Leverage TBC’s product offerings and prices from mobile operators offering unlimited
strong subscriber base for growth wireless data
• High fixed broadband penetration in Taiwan;
opportunity to gain more market share • Decline in demand for home shopping and
stronger competition from internet retailing
• Rising demand for higher-speed broadband to continue impacting channel leasing
plans due to rapidly growing demand for data revenue for cable industry
SCALABLE & EFFICIENT COST PREMIUM DIGITAL TV HIGHLY REGULATED
STRUCTURE
• Headroom in network capacity that • Continue to ride on the growth momentum for • Basic cable TV rates for 2022 across all
Premium digital TV RGUs by stepping up five franchise areas were maintained at
allows provision of additional services at
marketing efforts to attract new RGUs the same rates as 2021
limited incremental cost
• Support inorganic growth in future • Consumer preference for better quality video and • All five licences that were due for
interactive services renewal in 2020 and 2021 have been
successfully renewed until 2029 and
• Growing number of HD television sets in Taiwan 2030
Broadband and Premium digital cable TV RGUs to continue increasing in 2022; total revenue will be influenced by the ability to
manage ARPUs which will remain under pressure; total operating expenses in 2022 expected to be higher than 2021 due to the
benefit in 2021 from the reversal of pole rental provisions
16BUSINESS OVERVIEW
17TRUST STRUCTURE
Unitholders APTT
Management
Trust Deed Pte. Limited
(“Trustee-
Manager”)
Offshore
Offshore Holding
companies Companies
Ownership of assets Income from assets
Onshore (Taiwan) Taiwan
companies and
system operators
Broadband
Communications
Group (“TBC”)
18OVERVIEW
FRANCHISE AREAS IN
APTT is a business trust with a mandate to own & operate pay-TV &
NORTHERN & CENTRAL TAIWAN
broadband businesses in Taiwan, Hong Kong, Japan & Singapore
• Independent Directors comprise majority of the Board of Directors (4 out of 7)
• Sole investment in Taiwan Broadband Communications (“TBC”) – Taiwan’s third largest
cable TV operator
Cable TV operator in five franchise areas in Taiwan, with network
coverage of more than 1.3 million homes
• Owns 100% of the advanced hybrid fibre coaxial cable network in the five franchise areas
• Resilient business with high barriers of entry due to high network roll out requirements
• Large customer base makes TBC attractive to local content providers
• Long standing relationship with subscribers; deep understanding of Taiwanese subscribers’
viewing preferences
PRODUCT OFFERINGS
Approx. 89% of revenue is subscription-based from the three product offerings1
BASIC CABLE TV PREMIUM DIGITAL CABLE TV BROADBAND
• Low churn rate of 0.5%1 for Basic cable
Over 100 channels on Basic Up to 68 additional channels Growing market share, with TV (688K1 Revenue Generating Units)
cable TV, majority of the including 67 HD channels, through ability to cross-sell to non-
popular channels are only MPEG4 platform. 41%1 of TBC’s customers on DOCSIS 3.1
• Up-sell Premium digital cable TV and
cross-sell Broadband to large Basic
available on cable TV Basic cable TV subscribers are also enabled HFC network and cable TV subscriber base
Premium digital cable TV current speed offerings up to 1
subscribers; opportunity to upsell to Gbps
the remaining 59%
Note: (1) As at 31 March 2022 19BUSINESS DRIVERS
20TBC’S FRANCHISE AREAS
Network coverage of more than 1.3 million households across five franchise areas in four counties of Taiwan
• Well connected via major railways, road transportation and/or
Number of households
Population CAGR1
international airports CAGR1 (2011-2021)
(2011-2021)
• Increasing population due to workforce seeking employment in 0.70%
1.87%
1.12%
TBC Group’s franchise areas
0.06%
• Population growth in the five franchise areas (0.70%) outstrips
TBC Group Taiwan TBC Group Taiwan
national average (0.06%); Growing number of new households franchise areas average franchise areas average
as more young Taiwanese set up families
South Taoyuan Hsinchu Miaoli (North & South) Taichung City
• Home to Taiwan Taoyuan • Hsinchu Science Park is home • Suburban mountainous • One of the most populous cities in
International Airport and close to high tech companies, the region geographically located Taiwan; home to Taichung
proximity to Taipei city has one of the highest between Hsinchu and International Airport
• Service area covers 918 square
income levels in Taiwan Taichung
• Vibrant, diverse economy: large
km and constitutes over 75% of • Approx. 211K households and • Well connected via major industrial areas and a thriving
the total area in Taoyuan population of 576K railway and road commercial sector that incorporates
County transportation systems traditional businesses, small family-
• Approx. 439K households and • Approx. 196K households run shops & factories
population of close to 1.2 million and population of 537K • Approx. 466K households and
population of 1.2 million
Note: (1) National Statistics, R.O.C. (Taiwan) 2021
21TAIWAN MARKET –
POTENTIAL IN BROADBAND
Relatively lower internet penetration and speed compared to other developed APAC markets
100% •
South Korea
Internet penetration is lowest in Taiwan at 91.0% at the
HUNDREDS
Japan
Hong Kong
start of 2022, compared to South Korea, Japan,
90%
Singapore
Taiwan
Singapore and Hong Kong
80%
Internet Penetration
70% • Taiwan’s average download speed of fixed internet
60% connections is ranked second last among the five
50%
developed APAC markets at approx. 94.63 Mbps; there is
room for Taiwan subscribers to further increase internet
40%
speed
30%
20% • TBC’s Broadband market share in its five franchise areas
10%
is increasing year-on-year
0%
2000 2001 2002 2003 2004 2005 2006 2007 2008 2009 2010 2011 2012 2013 2014 2015 2016 2017 2018 2019 2020
• Opportunity for TBC to gain more market share and meet
rising demand for higher-speed broadband plans due to
International Telecommunications Union rapidly growing demand for data
Region Internet penetration rate Number of Internet users Average download speed of fixed Year-on-year change in
(million) internet connections (Mbps) average speed of fixed
internet connections
Asia-Pacific
Taiwan 91.0% 21.72 94.63 +21.7%
South Korea 98.0% 50.29 98.86 +7.8%
Japan 94.0% 118.3 93.26 +23.9%
Singapore 92.0% 5.45 184.65 +15.2%
Hong Kong 93.0% 7.05 158.19 +31.3%
Datareportal, Digital 2022
22IMPROVING BROADBAND MARKET SHARE
TBC’s broadband market share improving in its franchise areas year-on-year
Broadband RGUs (’000) TBC Group offers competitive prices1 with reliable services
NT$ / month
2010-21 Broadband RGU CAGR: 5.7%
TBC 50Mbps 120Mbps 200Mbps 500Mbps 1Gbps
Primary
60Mbps 100Mbps 300Mbps 500Mbps 1Gbps
competitor
Note: (1) Primary competitor pricing based on NCC data
• DOCSIS 3.1 and GPON enabled network that meets consumer demand for high-speed internet; 1 Gbps launched since 2019
• Competitive pricing and optional bundling with digital TV
• Offering value-added services including Android OTT gateway and karaoke singing box, among others. Will continue to introduce value-
added solutions that leverage the Android gateway
• Developing new market segments, including enterprise clients
• Supporting mobile operators with their network development by leveraging TBC network for data backhaul
23HIGH BARRIERS TO ENTRY
AGAINST CABLE ENTRANTS IN TAIWAN
Cable TV continues to be the dominant TV platform Top 20 channels in Taiwan (2021)
1 TVBS-News
• Superior content portfolio at competitive pricing
2 Sanlih Taiwan Channel
• Affordable services
3 EBC News
• Adoption of superior technology by operators 4 Sanlih E-Television News
• Technological disadvantages of IPTV in Taiwan 5 Formosa TV News
6 Unique Satellite TV
7 TVBS
Barrier to entry against new cable entrants
8 ERA News
• High network roll-out requirements 9 Next TV News
• Long standing relationships with subscribers; strong brand
10 YOYO TV
awareness 11 EBC Financial News
• Deep understanding of Taiwan subscribers’ viewing 12 Star Chinese Channel
preferences 13 Sanlih City Channel
14 GTV Drama
15 Videoland Japanese
16 EBC Variety
17 Videoland On-TV
18 Star Chinese Movies
19 EBC Drama
20 Videoland Movies
245G DATA BACKHAUL OPPORTUNITIES
HOW DATA BACKHAUL WORKS? WHY MOBILE OPERATORS IN TBC’S FIVE FRANCHISE AREAS
NEED DATA BACKHAUL SERVICES?
For data to move from one point to another on the internet, there Demand for higher speed continues to increase
needs to be fibre nodes that allow these points to interface with
each other. Spectrum is expensive, while wireless competition
is intense. CAPEX and OPEX for 5G infrastructure
are costly for a mobile operator
5G Core • TBC is one of two players in its five franchise areas that owns a dense and
distributed underground fibre network; TBC does not compete in the wireless
Backhaul Backhaul space
• More efficient for 5G mobile operators to work with a 5G data backhaul partner
CU (via 10GPON or DOCSIS3.1) to deliver higher speed/lower loss and lower
(Centralized Unit)
interference end-to-end 5G network transmission
• TBC has been increasing fibre density from an average of over 750 end-
Middlehaul Middlehaul
homes per fibre node three years ago to less than 250 end-homes per fibre
DU node on average today; Broadband speeds ranging up to 1 Gbps
(Distribute Unit)
• TBC’s increased fibre density can adequately support mobile operators,
removing network congestion and allowing data to be transmitted at high
speed; allows 5G mobile operators who are building their small cell stations to
tap into TBC’s high speed fibre data backhaul
Fronthaul Fronthaul Fronthaul Fronthaul
• As a proof-of-concept, TBC has been providing data backhaul for 4G networks
to a few mobile operators; although its contribution is still not significant,
revenue from data backhaul over the last three years has been gradually
increasing
• TBC is positioned to benefit from mobile operators’ multi-year investments in
AAU
(Active Antenna Unit) the build out of their 5G networks
255G DATA BACKHAUL OPPORTUNITIES
OPPORTUNITIES FOR TBC AS 5G DATA BACKHAUL PROVIDER
TBC’s advanced hybrid fibre coaxial network • Taiwan government’s push for faster build up of 5G networks
supports both indoor and outdoor coverage
- National Communications Commissions is providing substantial
subsidies to telco operators with a goal of building 39,000 5G base
stations in 2.5 years
• 5G network investment is a multi-year investment for mobile operators;
flexibility to add fibre circuits from TBC as their wireless networks expand
over time
• Explore partnerships with mobile operators to tender for government
projects
- 10GPON and DOCSIS3.1 are used as heterogeneous network
backup in private 5G networks
• Explore a packaged suite of hybrid network environment and office
applications to target the business community
26END
27You can also read