Brain Size Associated with Foot Preferences in Australian Parrots - Research UNE
←
→
Page content transcription
If your browser does not render page correctly, please read the page content below
Article

Brain Size Associated with Foot Preferences in
Australian Parrots
Gisela Kaplan * and Lesley J. Rogers *

                                         School of Science and Technology, University of New England, Armidale, NSW 2351, Australia
                                         * Correspondence: gkaplan@une.edu.au (G.K.); lrogers@une.edu.au (L.J.R.)

                                         Abstract: Since foot preference of cockatoos and parrots to hold and manipulate food and other
                                         objects has been associated with better ability to perform certain tasks, we predicted that either
                                         strength or direction of foot preference would correlate with brain size. Our study of 25 psittacine
                                         species of Australia found that species with larger absolute brain mass have stronger foot prefer-
                                         ences and that percent left-footedness is correlated positively with brain mass. In a sub-sample of
                                         11 species, we found an association between foot preference and size of the nidopallial region of the
                                         telencephalon, an area equivalent to the mammalian cortex and including regions with executive
                                         function and other higher-level functions. Our analysis showed that percent left-foot use correlates
                                         positively and significantly with size of the nidopallium relative to the whole brain, but not with
                                         the relative size of the optic tecta. Psittacine species with stronger left-foot preferences have larger
                                         brains, with the nidopallium making up a greater proportion of those brains. Our results are the
                                         first to show an association between brain size and asymmetrical limb use by parrots and cockatoos.
                                         Our results support the hypothesis that limb preference enhances brain capacity and higher (nido-
                                         pallial) functioning.

Citation: Kaplan, G.; Rogers, L.J.       Keywords: parrots; footedness; brain mass; body mass; nidopallium; optic tectum; optic tecta;
Brain Size Associated with Foot          Wulst; lateral asymmetry
Preferences in Australian Parrots.
Symmetry 2021, 13, 867. https://
doi.org/10.3390/sym13050867

                                         1. Introduction
Academic Editors: Sebastian
Ocklenburg and Onur Güntürkün
                                               Hand and foot preferences (footedness) have often been used as proxy measures of
                                         brain lateralization although there is little evidence that these preferences correlate with
Received: 14 April 2021                  structural differences in the brain [1]. In humans, however, non-right handedness has
Accepted: 10 May 2021                    been associated with particular dysfunctional conditions, although not consistently [2–5].
Published: 12 May 2021                   In non-human species, absence of hand or limb preference has been considered to indicate
                                         weak or absent asymmetry of the brain [6,7]. However, although hand-preference, or
Publisher’s Note: MDPI stays neu-        limb-preference, reflects which hemisphere is in control of motor behaviour [8], its pres-
tral with regard to jurisdictional       ence or absence cannot not necessarily be used as a measure of the strength or direction
claims in published maps and institu-    of asymmetry in the brain itself, either at the individual level or the population level. For
tional affiliations.                     example, in any group of marmosets, approximately half the individuals have a left-hand
                                         preference and the other half a right-hand preference [9]. Nevertheless, almost all indi-
                                         viduals have the same eye preference for viewing particular stimuli [10]. Furthermore,
                                         left-handed marmosets have a negative cognitive bias, whereas right-handed marmosets
Copyright: © 2021 by the authors.
                                         have a positive cognitive bias [11]: a result explained by specialised processing of the
Licensee MDPI, Basel, Switzerland.
                                         hemisphere contralateral to the preferred hand. In marmosets, hand preference is an in-
This article is an open access article
                                         dividual characteristic, whereas eye preference has a population bias. Even when no con-
distributed under the terms and con-
                                         sistent limb preference is present, a species may still have population asymmetry for pro-
ditions of the Creative Commons At-
tribution (CC BY) license (http://cre-
                                         cessing sensory information in the brain.
ativecommons.org/licenses/by/4.0/).
                                               Some researchers adhere to the hypothesis that hand preference in humans is
                                         stronger than any hand or limb preference in non-human species [12]. By extrapolation,

Symmetry 2021, 13, 867. https://doi.org/10.3390/sym13050867                                                     www.mdpi.com/journal/symmetry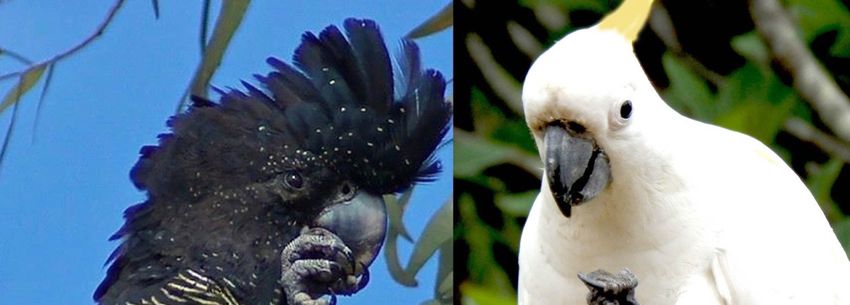
Symmetry 2021, 13, 867                                                                                         2 of 13

                         it has also been argued that brain lateralization is stronger in humans, thereby adhering
                         to a view of a significant discontinuity of brain function between humans and other ani-
                         mals [13,14] but see [15]. Although there is some support for this idea when only the evi-
                         dence for hand preference in primates is considered, that too has been contested [14,16].
                         In fact, we now know that limb preferences present as population-level asymmetries are
                         quite common in vertebrate species [12]. They occur in some amphibians [17,18], and foot-
                         edness has been reported for several avian orders (wildfowl and waders [19], yellow-bel-
                         lied tits, Pardaliparus venustulus, [20] and many species of parrots [21,22]). Cockatoos also
                         display foot preferences [21,23–25] and, in some species, foot preference is as strong as
                         hand preference in humans [21]. Furthermore, the well-studied laterality of a broad range
                         of perceptual functions in chickens and pigeons is as strong as laterality in humans [26–
                         29].
                               Having a lateralized brain has been shown to increase the processing capacity of the
                         brain, to permit complementary and parallel processing of sensory information and to
                         improve motor control [27]. Consistent with this, psittacine species that display foot pref-
                         erences have better ability to perform certain tasks than species with weak on no foot
                         preference [30,31]. This raises questions about potential associations between brain size
                         and foot preference in different psittacine species. Do species with footedness have larger
                         brains, or is footedness a way of compensating for having a smaller brain?
                               In this paper we are concerned with species-level population lateralization of foot
                         use in a range of species of Australian parrots and cockatoos. Psittaciformes are usually
                         subdivided into three superfamilies Cacatuoidea (cockatoos), Psittacoidea (true parrots)
                         and Strigopoidea [32]. Species in Strigopoidea were not included here because they are
                         extant New Zealand parrots. Worldwide, there are about 375 species of parrots, of which
                         about 56 species (depending on taxonomical consideration of counting some birds as sub-
                         species or separate species) are native to Australia. Modern extant parrots and songbirds
                         are of particular interest for evolutionary reasons [33]. Both orders have their origin in
                         East-Gondwana, now Australia [34]. While radiations and departures from the continent
                         eventually occurred, the evolution of the two superfamilies from ancestral surviving lin-
                         eages has been uninterrupted to this day, despite the mass extinction events of 65 million
                         years ago [33,35].
                               Large-brained psittacines, as cockatoos are, have a unique cerebrotype compared to
                         large-brained songbirds: they have a relatively larger subpallium within the telencepha-
                         lon, containing more telencephalic neurons [36]. The subpallium is responsible for neural
                         regulation of feeding, reproduction, voluntary movement, and agonistic and stress behav-
                         iours. It is also associated with reward, memory and learning [37].
                               Parrots are an anomaly amongst avian species in that their brains are lavishly
                         equipped with nuclei for vocalizations, having the same seven nuclei of the song control
                         system as songbirds, although they are not songbirds. Parrots are well-known for their
                         extraordinary ability to mimic and to retain the memory of a large number of sounds that
                         are not species-specific. Why this capacity has developed is not clear because it has so far
                         not been confirmed that parrots use mimicry in the wild on a regular or even just occa-
                         sional basis. Even more puzzling, from a functional point of view, is, as Chakraborty and
                         colleagues [38,39] discovered, that parrots have a core and shell song systems, i.e., an ad-
                         ditional set of nuclei not present in songbirds. It seems to be a structure unique to the
                         parrot brain but its function is still not entirely clear. We now know, however, that within
                         the song control system the magnocellular nucleus of the medial striatum (MMSt) is a
                         prime target for somato-motor outputs from the hyperpallium apicale of the rostral Wulst,
                         the avian equivalent of the mammalian motor cortex [40]. This projection may be signifi-
                         cant in parrots as it potentially mediates control of the body and limbs along with vocali-
                         zation during elaborate, ritualized visual displays [41]. One notes that the song nuclei are
                         largely located in the nidopallium, the part of the forebrain that is involved in cognition.
                               We report associations between foot preference (footedness) in species of Australian
                         parrots and brain size, measured as whole brain mass and as whole brain mass relative to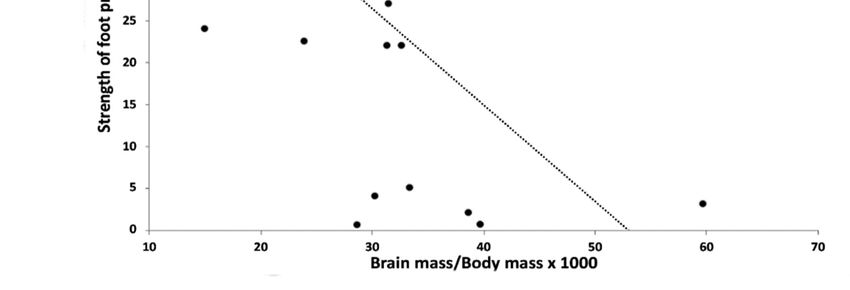
Symmetry 2021, 13, 867                                                                                                 3 of 13

                         body mass, and between footedness and the size of two regions of the brain, the nidopal-
                         lium, including the primary visual centre (entopallium), and the optic tectum. The avian
                         nidopallium (see Figure 1), an analogue to the mammalian cortex, is an important area of
                         the cortical telencephalon of the avian forebrain. Some of its sub-regions, such as the cau-
                         dal nidopallium, the nidopallium caudocentral (NCC), caudomedial (NCM) and caudola-
                         teral (NCL), are considered vital for many complex, higher order cognitive functions in
                         birds [42–44]. Indeed, the NCL is the seat of executive function, functionally equivalent to
                         the prefrontal cortex of mammals [44,45] and, amongst other connections, it is reciprocally
                         connected to sensory areas in all modalities and to basal ganglia and premotor areas [46].
                         It plays a key role in cognitive control of a number of functions, including roles in reward
                         systems [47] and choice behaviour [48]. Although no studies of NCL have yet been con-
                         ducted using parrots, this region of the nidopallium is almost certainly involved in feed-
                         ing using the feet.

                         Figure 1. Brain regions of the parrot brain. Our text focusses on the Nidopallium and Optic tec-
                         tum, as marked. Note that the optic tectum is located laterally on each side of the brain and in this
                         Figure it obscures the midbrain and most of the hypothalamus. The darker section indicates the
                         forebrain (telencephalon). Abbreviations: Hp = Hippocampus, NCM = Caudiomedial nidopallium;
                         MSt = medial striatum; E = Entopallium; OB = Olfactory bulb. Adapted from Chakraborty and
                         Jarvis [39], Kuenzel et al. [49] and Reiner et al. [50]. The Nidopallium includes NCM, E and Ar-
                         coplallium, as well as other regions discussed in the text.

                               The optic tectum is part of the main visual input system of birds and must be in-
                         volved in foot/eye coordination. However, Niederleitner et al. [51] discovered a relay nu-
                         cleus between the inferior colliculus and the optic tectum in the chicken, providing a solid
                         basis for demonstrating visual–auditory integration.
                               We were interested in testing whether limb preference might be associated with the
                         size of these of the optic tectum and the nidopallium because eye preferences and foot
                         preferences are linked, as Brown and Magat showed in 16 species of Australian parrots
                         [52].
Symmetry 2021, 13, 867 4 of 13
2. Materials and Methods
2.1. Subjects
Psittaciformes are subdivided into the superfamilies Strigopoidea (New Zealand par-
rots), Cacatuoidea (cockatoos) and Psittacoidea (true parrots). Species in our samples,
which did not include the New Zealand parrots, belonged to the two superfamilies of
cockatoos (Cacatuoidea) and true parrots (Psittacoidea). Those examined here are exclu-
sively native Australian species, excluding closely related cockatoo species endemic to
islands north of Australia (such as New Guinea, including the Bismarck Archipelago, the
Solomon Islands, or Tanimbar Islands Archipelago (Indonesia). The subjects used were
those for which published data on brain mass, body mass and foot preference are available
(see next section) but for which no previous study exists that has tested a potential asso-
ciation between these variables.
2.2. Source of Data
Data on body mass, brain mass and volumes of brain regions were obtained from
Franklin et al. [53] and Iwaniuk et al. [54]. We compared published data on foot prefer-
ences (see below) with published data on brain mass, relative brain mass and the size of
two regions of the forebrain, the nidopallium and the optic tectum.
Foot preference in 25 species of Australian parrots was obtained from three publica-
tions. Data for nine species were obtained from a previous study by the co-author of this
paper, Rogers [21]. Scores for the budgerigar came from Rogers and Workman [55] and
for another 15 species from Brown and Magat [22] (see Table 1). We used data for two
measures of footedness: (1) percent use of the left foot and (2) strength of foot preference,
regardless of whether the left or right foot is used.
Table 1. Psittacine species used. No = number of individuals scored, % Left = (Left/Left + Right) ×100, and the ratio of brain
mass/body mass × 1000.
Brain Mass
Common Name Latin Species Name No % Left Strength
/Body Mass × 1000
Galah Eolophus roseicapella 58 89 39 21.3509
Sulphur-crested cockatoo Cacatua galerita 98 87 37 20.2646
Little corella Cacatua sanguinea 14 93 43 19.5567
Long-billed corella Cacatua tenuirostris 17 89 39 19.5098
Pink cockatoo Cacatua leadbeateri 24 100 50 22.6742
Yellow-tailed black cockatoo Calyptorhynchus funereus 7 100 50 23.6710
Gang-gang cockatoo Callocephalon fimbriatum 38 100 50 30.9971
Yellow rosella Platycercus f. flaveolus 6 100 50 30.6296
Crimson rosella Platycercus elegans 17 23 27 31.5813
Budgerigar Melopsittacus undulatus 9 51 1 59.7692
Cockatiel Nymphicus hollandicus 20 90 40 28.0889
Red-tailed black cockatoo Calyptorhynchus banksii 20 93 43 18.4779
King parrot Alisterus scapularis 20 8.5 41.5 22.4216
Palm cockatoo Probosciger aterrimus 5 80 30 26.3499
Eclectus parrot Eclectus roratus 20 26 24 15.0394
Turquoise parrot Neophema pulchella 10 45 5 33.4110
Red-winged parrot Aprosmictus erythropterus 10 10 40 25.7329
Australian ringneck Barnardius zonarius 5 20 30 28.6071
Red-capped parrot Purpureicephalus spurius 5 72 22 31.4403
Superb parrot Plytelis swainsonii 20 27.5 22.5 23.9352
Red-rumped parrot Psephotus haematonotus 20 72 22 32.6547
Little lorikeet Glossopsitta pusilla 15 49.3 0.7 39.6925
Varied lorikeet Psitteuleles versicolor 5 48 2 38.6567Symmetry 2021, 13, 867 5 of 13
Rainbow lorikeet Trichoglossus moluccanus 20 46 4 30.3341
Bourke’s parrot Neopsephotus bourkii 20 49.5 0.5 28.7778
The number of individuals scored varied considerably between species (see Table 1)
due to differences in availability of birds to test. Both caged and wild birds were tested
and, for all species apart from the budgerigar, data were collected from multiple locations
in order to make the scores representative of the species.
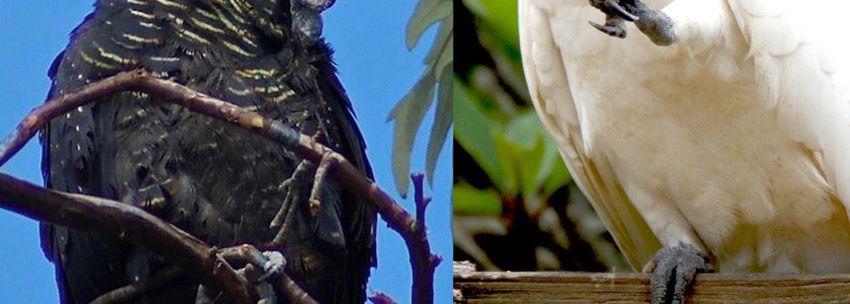
The behavioural score was percent left-foot use to hold food. Brown and Magat [22]
determined foot preferences by scoring the foot used to grasp food items, with 10 trials
per individual bird. Rogers [21] scored the foot used to hold food while eating (Figure 2),
the number of scores per individual varying from 1 to 6. Since budgerigars rarely hold
food in a foot, in this species preferred foot was determined by placing a small piece of
adhesive tape on the dorsal surface of the beak and then scoring the foot used in attempts
to remove the tape (10 scores per bird) [55].
The formula (L/L + R) × 100 was used to determine % Left, where L refers to the
number of times the left foot was used and R to the number of times the right foot was
used. At least five subjects per species were assessed (Table 1). The scores determined
were mean percentages for each species; hence, they represented the %L for each species,
considered as a group or population.
Strength of foot preference was determined as the difference between the scored %
Left and 50% (no preference). Hence, it was an absolute score, not taking into account the
direction of the foot preference. These scores ranged from 0% to 50%.
Out of our main group of species, we selected for more detailed examination 11 spe-
cies for which the volume of various brain regions, relative to the volume of the whole
brain, had been determined using histological sections and Nissl staining by Iwaniuk and
Hurd [56] (see Table 2). We selected to compare % Left and strength of foot preference
with two brain regions: viz., the nidopallium (N) and the optic tectum. Data for these two
regions were given as proportions of the total brain volume.
Table 2. A list of the species in the sub-group tested for correlation between % Left foot use and the
volumes of the nidopallium and the optic tecta relative to the volume of the whole brain (i.e., the
scores are proportions). The figures for the two brain regions are given as proportions of the whole
brain, sourced from Iwaniuk and Hurd [56].
Common Name Scientific Name % Left Nidopallium Optic Tectum
Galah Eolophus roseicapella 89 0.3618 0.0314
Yellow-tailed black cocka- Calyptorhynchus fune-
100 0.3887 0.0196
too reus
Cockatiel Nymphicus hollandicus 90 0.3571 0.0350
Crimson rosella Platycerus elegans 23 0.3401 0.0429
Budgerigar Melopsittacus undulatus 53 0.3210 0.0514
Superb parrot Plytelis swainsonii 27.5 0.3200 0.0556
Red-rumped parrot Psephotus haematonotus 72 0.3540 0.0387
Trichoglossus haema-
Rainbow lorikeet 46 0.3370 0.0339
todus
Bourke’s parrot Neopsephotus bourkii 49.5 0.3586 0.0482
Australian king parrot Alisterus scapularis 8.5 0.3098 0.0424
Eclectus parrot Eclectus roratus 26 0.3534 0.0351Symmetry 2021, 13, 867 6 of 13
Figure 2. Two left-footed cockatoos. Left: female red-tailed black cockatoo (Calyptorhynchus bank-
sia). Right: male sulphur-crested cockatoo (Cacatua galerita). Note that the left foot grasps the food
item and the entire leg is lifted to the beak (Photo credits: left: B. Machini, right: G. Kaplan).
2.3. Statistical Tests
Pearson correlations (in Excel) were performed between % Left and brain mass rela-
tive to body mass (Brain mass/body mass × 1000) and, in the smaller group, between %
Left and the volumes of the two brain regions relative to total brain volume. Where
needed, due to multiple comparisons, Bonferroni corrections were applied. Correlations
were also made using scores for the strength of footedness (absolute value of difference
between score and no preference, 50%).
3. Results
3.1. Association between Foot Preference and Body Mass
First, we tested our data to see whether they showed results similar to those of Brown
and Magat [22] and, consistent with that report, strength of foot preference correlated sig-
nificantly with body mass (R (25) = 0.5339, p = 0.0059, Bonferroni correction α = 0.0166)
and strongly with log10 Body mass (R(25) = 0.7166, p = 0.000056). The larger the bird, the
stronger the foot preference.
3.2. Association between Foot Preference and Brain Mass
Strength of foot preference correlated significantly with brain mass (R (25) = 0.5259,
p = 0.0069, Bonferroni correction α = 0.0166) and with log10 Brain mass (R (25) = 0.7166, p =
0.00005; Figure 3A). Species with larger brains have stronger foot preferences. There was
also a significant association between % Left and Brain mass (R (25) = 0.4857, p = 0.01384)
and log10 Brain mass (R (25) = 0.4525, p = 0.02111). Hence, left-footedness is stronger in
species with a larger brain.Symmetry 2021, 13, 867 7 of 13
Figure 3. Strength of foot preference for the larger sample (n = 25) plotted against (A). Log10 of
Brain mass, and (B). Brain mass/Body mass × 1000. The correlation between Strength of foot pref-
erence and brain mass is significant and positive (see text) and between strength of foot preference
and Brain mass/Body mass is negative and significant (see text).
3.3. Association between Foot Preference and Brain Mass Relative to Body Mass
There was no significant correlation between % Left and brain mass/body mass (R(25)
= −0.1655, p = 0.4291). However, the correlation between strength of foot preference and
brain mass/body mass was significant (R (25) = −0.6032, p = 0.0014, Bonferroni correction
α = 0.0166: Figure 3B). The larger the size (or mass) of the brain relative to body size (or
mass), the weaker the foot preference. This result comes about because body mass in-
creases across species at a greater rate than does brain weight. Hence, species with larger
bodies, and larger brains per se, but not relative to body mass, have stronger foot prefer-
ences.Symmetry 2021, 13, 867 8 of 13
3.4. Association between Foot Preference and Brain Mass in the Smaller Sample
First, this subset of 11 species was tested for Pearson correlation between the strength
of foot preference and brain mass. As for the larger sample, this set showed a significant
positive correlation (R (11) = 0.6410, p = 0.0335). This result shows that the subset was
representative of the larger sample.
A Pearson correlation was applied to % Left scores versus relative volume of the
nidopallial region and a positive association was found (R (11) = 0.7674, p = 0.0058, Bon-
ferroni corrected α = 0.025; Figure 4A). Hence, the larger the volume of the nidopallium
compared to the whole brain, the stronger the left foot preference.
Figure 4. Percent left foot preference plotted against volume of the nidopallium relative to volume of the whole brain (A),
and volume of the optic tecta relative to the volume of the whole brain (B). The positive correlation in A is significant: the
nidopallium is larger, relative to the whole brain, in left footed parrots, and it is smaller in right-footed parrots. There is a
trend for the opposite association between foot preference and size of the optic tecta but it is not significant after Bonferroni
correction (see text).
A negative correlation was found between % Left and the relative volume of the optic
tecta but it failed to be significant once the Bonferroni correction was applied (R(11) =
−0.6129, p = 0.0449, Bonferroni correction α = 0.025; Figure 4B).
Strength of foot preference did not correlate significantly with the volumes of either
the nidopallium or optic tecta regions (nidopallium, R(11) = 0.3393, p = 0.3072; optic tecta,
R(8) = −0.5908, p = 0.0556, Bonferroni correction α = 0.025).
4. Discussion
First, we analysed the data to see whether they supported the finding of Brown and
Margat [22] that, in species of Australian parrots, strength of foot preference correlates
positively with body length, the latter being taken to indicate body size. As we were able
to examine strength of foot preference versus body mass, this gave a better indication of
the relationship between strength of foot preference and body size. By doing so, we found
a significant positive correlation, which supports the findings of Magat and Brown [22]:
the larger the species of parrot, the stronger is the foot preference. Magat and Brown [22]
provided some evidence that this relationship may be due to larger parrots feeding on
larger seeds. Such feeding would require more eye-foot manipulation. In fact, larger spe-
cies often hold a whole seed pod in one foot and manipulate it carefully in order to extract
the seeds (see Figure 1 in [57], p. 27, showing a yellow-tailed black cockatoo feeding on a
large Banksia pod).Symmetry 2021, 13, 867 9 of 13
We also found a positive correlation between strength of foot preference and brain
mass (Figure 3). The larger the brain size, the stronger the preference to hold food or ob-
jects in a preferred foot. In turn, this reflects control by the hemisphere opposite the pre-
ferred foot and use of the specific specialised functions of that hemisphere. However, the
association between strength of foot-preference and brain mass relative to body mass is
negative (Figure 3). To summarise the results so far, although larger birds have stronger
foot preferences and larger brains, they have smaller brain mass relative to body mass:
this means that, across species, the body size increases at a greater rate than does brain
size.
These measures may also correlate with other factors; for example, with genome size
and, hence, neuronal complexity of the brain. In fact, Andrews and Gregory [58] found
that, in 54 species of parrots and cockatoos, genome size correlated negatively with rela-
tive brain size. They attributed this to species differences in neuronal complexity: the
larger the genome, the more complex are the neural connections in the brain [58]. It would
now be worth investigating whether a similar association between brain size and genome
size holds for the species we tested. Since we have found a negative correlation between
strength of footedness and relative brain mass, strength of foot preference may correlate
positively with genome size, and hence, complexity of brain structure. This is merely a
thought for future research. We are aware that whole brain size is a rough measure to
associate with behaviour [59] but it is a starting point leading to investigation of more
specific brain regions associated with particular patterns of behaviour.
Our findings also illustrate the difference between using absolute brain size com-
pared to relative brain size when drawing links between brain and behaviour [60]. We
suggest that absolute brain size (or mass) is a better measure to associate with foot prefer-
ence, and possibly also with cognitive behaviour, than is brain mass relative to body mass.
As Herculano-Houzel [61] emphasised, body mass is very variable and not tightly corre-
lated with the number of neurones in the brain. Nevertheless, although it is preferrable
not to use body mass as a measure related to behaviour or cognition, within Psittaci-
formes, Herculano-Houzel [61] did report a positive relationship between the number of
neurones in the brain and body mass and, more specifically, between the number of neu-
rones in the pallium and body mass. To extrapolate to our data, since foot preferences are
stronger in larger parrots with larger brains, these features may go along with more neu-
rones in the brain and with higher computational capacity or “cognitive power” [36].
The positive relationship between strength of foot preference and brain mass was
also present in our subgroup of 11 species selected in order to examine correlations be-
tween foot preference and regional areas of the brain. In this representative subgroup, we
also found that % Left correlated positively with volume of the nidopallium relative to
whole brain volume (Figure 4). Parrots with proportionately larger nidopallial regions
express stronger left-foot preferences, and hence use of the right hemisphere. Put simply,
the nidopallium is larger in left-footed species than it is in right-footed species.
The nidopallial region measured by Iwaniuk and Hurd [56] included all of the sub-
regions (nucleus basorostralis pallii, entopallium and arcopallium) as well as area tem-
poro-parieto-occipitalis. The entopallium is a primary visual centre, receiving inputs from
the retina, via the optic tectum and nucleus rotundus, and sending outputs to the arcopal-
lium (see Figure 1), which in turn sends outputs to the brain stem and controls motor
function (summarised in [28]). It is a visuo–motor system clearly involved in eye–foot co-
ordination. It is not known whether these regions of the nidopallial complex differ in size
between the hemispheres, and so may be associated with asymmetry of limb use, but re-
search on pigeons has shown that asymmetry is present in the visual pathway sending
inputs to the entopallium: the entopallium in the left hemisphere receives strong inputs
from both eyes, whereas the same region in the right hemisphere receives inputs mainly
from the left eye [28,62,63]. In left-footed birds, therefore, the right hemisphere is being
used rather exclusively to carry out eye-foot co-ordination needed to hold and manipulate
food items [52].Symmetry 2021, 13, 867 10 of 13
Recently, Morandi-Raikova et al. [64] reported asymmetry in entopallial neurones in
domestic chicks: they found more parvalbumin-expressing neurones, most likely
GABAergic inhibitory neurones, in the entopallium of right hemisphere than in the same
region of the left hemisphere. This suggests that primary visual inputs are processed dif-
ferently in the left and right hemispheres. Furthermore, as shown in the pigeon, there is
asymmetry in the arcopallial regions, due to differences in left-to-right versus right-to-left
exchange of visual information via the anterior commissure [65].
We found a trend for a negative correlation between % Left and the relative size of
the optic tecta (Figure 4) but it was not significant in our sample, perhaps due to our small
sample size. Nevertheless, the larger nidopallium, as we found in species with stronger
foot preferences, is not matched by any difference between species in size of the optic
tecta. It seems, therefore, that visual processing in the optic tecta may well be similar
across species. Hence, there is regional specificity in size increase of the nidopallium re-
lated to foot preference. Our data provide an example, across species, of brain structures
contributing differently to whole brain size, a consideration discussed in detail by Wil-
lemet [60].
It is not known whether evolution of the bird brain involved coordination between
the telencephalon and non-telencephalic regions [54] but this seems highly unlikely. The
latter is not necessarily related to cognition. From Striedter and Charvet’s work [66], we
have evidence that certain areas of the brain differ in size relative to the rest of the bird’s
brain in different species from embryonic stage onwards. In a morphometric comparison
between budgerigars, Melopsittacus undulatus, and quails, Colinus virginianus, the re-
searchers showed [66] that species differences in telencephalon and optic tectum size oc-
cur right from the beginning of development of the embryo: the optic tectum being much
larger in the quail than in the budgerigar, whereas the telencephalon occupies more than
60% of the budgerigar brain and slightly more than 40% in the quail [66]. These differences
reflect the cognitive differences between budgerigars and quails.
The evidence is already clear that parrots have brain/body ratios and encephalization
quotients similar to those of primates [54]. However, in most research on the size of the
telencephalon and sub-structures, there has been no consideration of differences between
the left and the right hemispheres. Apart from a recent study of cichlid fish, showing as-
sociations between lateralized behaviour and brain structures, as well as gene expression
[67], research on asymmetry in non-human species has focused on left–right differences
in function rather than structure.
In a range of species, the left hemisphere has been shown to be responsible for top-
down control (such as routine behaviour) and the right hemisphere for environmentally
elicited behaviour such as response to threats and social partners [68]. Social play behav-
iour in parrots and other clades is correlated positively with brain size [69] but, for this
behaviour, there has been no study of differences between the hemispheres. By contrast,
social recognition is known to be largely right-hemisphere controlled [70,71] and, as
Yamazaki at al. [72] concluded, cognition overall may be largely asymmetrical [73].
The significant results shown here concern the relationship between footedness and
the size of the nidopallium, a region of the forebrain with executive and other higher-level
functions. Our finding, coupled with the evidence of parrots’ exceptional vocal and cog-
nitive abilities, indicates that the nidopallium deserves more and detailed attention. Our
finding of a significant positive correlation between % Left foot use and the size of the
nidopallium further suggests that it would be worth looking in future for asymmetries in
the size of the nidopallial regions of the hemispheres and, particularly, the areas that are
included in that region, the entopallium, arcopallium and NCL. We hope that our findings
might encourage future research on left–right differences, not only of gross structure, but
also of neural processing [74], subcellular structures [64] and gene expression [67].Symmetry 2021, 13, 867 11 of 13
Author Contributions: Conceptualization, G.K. and L.J.R.; Data curation, G.K. and L.J.R.; Formal
analysis, G.K. and L.J.R.; Investigation, G.K. and L.J.R.; Methodology, G.K. and L.J.R.; Project ad-
ministration, G.K. and L.J.R.; Writing—original draft, G.K. and L.J.R.; Writing—review & editing,
G.K. and L.J.R. All authors have read and agreed to the published version of the manuscript.
Funding: No funding was requested for this research.
Institutional Review Board Statement: Not applicable.
Informed Consent Statement: Not applicable.
Data availability Statement: The data have been published previously in papers cited in the Meth-
ods.
Acknowledgments: We thank the authors of papers from which we could select data for analysis.
Conflicts of interest: The authors declare no conflict of interest.
References
1. Ocklenburg, S.; Metzen, D.; Schlüter, C.; Fraenz, C.; Arning, L.; Streit, F.; Güntürkün, O.; Kumsta, R.; Genc, E. Polygenic scores
for handedness and their association with asymmetries in brain structure. Res. Sq. 2021, doi:10.21203/rs.3.rs-350445/v1.
2. Dragovic, M.; Hammond, G. Handedness in schizophrenia: A quantitative review of evidence. Acta Psychiatr. Scand. 2005, 111,
410–419.
3. Ocklenburg, S.; Güntürkün, O.; Hugdahl, K.; Hirnstein, M. Laterality and mental disorders in the postgenomic age—A closer
look at schizophrenia and language lateralization. Neurosci. Biobehav. Rev. 2015, 59, 100–110.
4. Packheiser, J.; Schmitz, J.; Stein, C.C.; Pfeifer, L.S.; Berretz, G.; Papadatou-Pastou, M.; Peterburs, J.; Ocklenburg, S. Handedness
and depression: A meta-analysis across 87 studies. PsyArXiv 2021, doi:10.17605/OSF.IO/SX2EW.
5. Sommer, I.E.C.; Aleman, A.; Ramsey, N.; Bouma, A.; Kahn, R. Handedness, language lateralisation and anatomical asymmetry
in schizophrenia—Meta-analysis. Br. J. Psychiatry 2001, 178, 344–351.
6. Chance, S.A.; Crow, T.J. Distinctively human: Cerebral lateralisation and language in Homo sapiens. J. Anthropol. Sci. 2007, 85,
83–100.
7. McGrew, W.C.; Marchant, L.F. On the other hand: Current issues in and meta-analysis of the behavioral laterality of hand
function in nonhuman primates. Yearb. Phys. Anthropol. 1997, 40, 201–232.
8. Hopkins, W.D.; Cantalupo, C. Handedness in chimpanzees (Pan troglodytes) is associated with asymmetries of the primary
motor cortex but not with homologous language areas. Behav. Neurosci. 2004, 118, 1176–1183.
9. Hook, M.A.; Rogers, L.J. Visuospatial reaching preferences of common marmosets: An assessment of individual biases across a
variety of tasks. J. Comp. Psychol. 2008, 122, 41–51.
10. Hook-Costigan, M.A.; Rogers, L.J. Eye preferences in common marmosets (Callithrix jacchus): Influence of age, stimulus and
hand preference. Laterality 1998, 3, 109–130.
11. Gordon, D.J.; Rogers, L.J. Cognitive bias, hand preference and welfare in common marmosets. Behav. Brain Res. 2015, 287, 100–
108.
12. Ströckens, F.; Güntürkün, O.; Ocklenburg, S. Limb preferences in non-human vertebrates. Laterality 2013, 18, 536–575.
13. Crow, T.J. Why cerebral asymmetry is the key to the origin of Homo sapiens: How to find the gene of eliminate the theory. Curr.
Psychol. Cogn. 1998, 17, 1237–1277.
14. Corballis, M.C. Cerebral asymmetry and human uniqueness. In The Evolution of Hemispheric Specialization in Primates; Special
Topics in Primatology; Hopkins, W.D., Ed.; Elsevier: Amsterdam, The Netherlands, 2007; Volume 5, pp. 1–21.
15. Corballis, M.C. Bilaterally symmetrical: To be or not to be? Symmetry 2020, 12, 326.
16. Corballis, M.C. Humanity and the left hemisphere: The story of half a brain. Laterality 2020, 26,
doi:10.1080/1357650X.2020.1782929.
17. Malashichev, Y.B.; Wassersug, R.J. Left and right in the amphibian world: Which way to develop and where to turn? BioEssays
2004, 26, 512–522.
18. Stancher, G.; Sovrano, V.A.; Vallortigara, G. Motor asymmetries in fishes, amphibians, and reptiles. Proc. Brain Res. 2018, 238,
33–56.
19. Randler, C. Foot preferences during resting in wildfowl and waders. Laterality 2007, 12, 191–197.
20. Yu, G.; Guo, J.; Xie, W.; Wang, J.; Wu, Y.; Zhang, J.; Xu, J.; Li, J. Footedness predicts escape performance in a passerine bird. Ecol.
Evol. 2020, 10, 4251–4260.
21. Rogers, L.J. Lateralisation in the avian brain. Bird Behav. 1980, 2, 1–12.
22. Brown, C.; Magat, M. The evolution of lateralized foot use in parrots: A phylogenetic approach. Behav. Ecol. 2011, 22, 1201–1208.
23. Rogers, L.J. Laterality in animals. Int. J. Comp. Psychol. 1989, 3, 5–25.
24. Magrath, D.I. Footedness in the glossy black-cockatoo: Some observations and a review of the literature with a note on the
husking of Allocasuarina cones by this species. Corella 1994, 18, 21–24.Symmetry 2021, 13, 867 12 of 13
25. Woodall, P.F.; Woodall, L.B. Little and long-billed Corellas feeding on hoop pine seeds, and their ’footedness’. Sunbird J. Qld.
Ornithol. Soc. 2001, 31, 30–32.
26. Rogers, L.J.; Vallortigara, G.; Andrew, R.J. Divided Brains: The Biology and Behaviour of Brain Asymmetries; Cambridge University
Press: Cambridge, UK, 2013.
27. Vallortigara, G.; Rogers, L.J. A function for the bicameral mind. Cortex 2020, 124, 274–285.
28. Güntürkün, O.; Strökens, F.; Ocklenburg, S. Brain lateralization: A comparative perspective. Physiol. Rev. 2020, 100, 1019–1063.
29. Ocklenburg, S.; Güntürkün, O. The Lateralized Brain: The Neuroscience and Evolution of Hemispheric Asymmetries; Academic Press:
London, UK, 2018.
30. Magat, M.; Brown, C. Laterality enhances cognition in Australian parrots. Proc. R. Soc. B 2009, 276, 4155–4162.
31. Cussen, V.A.; Mench, J.A. Performance on the Hamilton search task, and the influence of lateralization, in captive orange-
winged Amazon parrots (Amazona amazonica). Anim. Cogn. 2014, 17, 901–909.
32. Joseph, L.; Toon, A.; Schirtzinger, R.E.; Wright, T.F.; Schodde, R. A revised nomenclature and classification for family-group
taxa of parrots (Psittaciformes). Zootaxa 2012, 40, 26–40.
33. Barker, F.K.; Cibois, A.; Schikler, P.A.; Feinstein, J.; Cracraft, J. Phylogeny and diversification of the largest avian radiation. Proc.
Nat. Acad. Sci. USA 2004, 101, 11040–11045.
34. Edwards, S.V.; Bowles, W.E. Out of Gondwana: The origin of passerine birds. Trends Ecol. Evol. 2002, 17, 347–349.
35. Wright, T.F.; Schirtzinger, E.E.; Matsumoto, T.; Eberhard, J.R.; Graves, G.R.; Sanchez, J.J.; Capelli, S.; Müller, H.; Scharpegge, J.;
Chambers, G.K.; et al. A multilocus molecular phylogeny of the parrots (Psittaciformes): Support for a Gondwanan origin dur-
ing the Cretaceous. Mol. Biol. Evol. 2008, 25, 2141–2156, doi:10.1093/molbev/msn160.
36. Olkowicz, S.; Kocourek, M.; Lučan, R.K.; Porteš, M.; Fitch, W.T.; Herculano-Houzel, S.; Němec, P. Birds have primate-like num-
bers of neurons in the forebrain. Proc. Natl. Acad. Sci. USA 2016, 113, 7255–7260, doi:10.1073/pnas.1517131113.
37. Kuenzel, W.J. The Avian subpallium and autonomic nervous system. In Sturkie’s Avian Physiology, 6th ed.; Elsevier: Amsterdam,
The Netherlands, 2014; pp. 135–163.
38. Chakraborty, M.; Jarvis, E.D. Brain evolution by brain pathway duplication. Philos. Trans. R. Soc. Lond. B 2015, 370, 20150056,
doi:10.1098/rstb.2015.0056.
39. Chakraborty, M.; Walløe, S.; Nedergaard, S.; Fridel, E.E.; Dabelsteen, T.; Pakkenberg, B.; Bertelsen, M.F.; Dorrestein, G.M.;
Brauth, S.E.; Durand, S.; et al. Core and shell song systems unique to the parrot brain. PLoS ONE 2015, 10, e0118496,
doi:10.1371/journal.pone.0118496.
40. Wild, J.M.; Williams, M.N. Rostral Wulst in passerine birds. 1. Origin, course, and terminations of an avian pyramidal tract. J.
Comp. Neurol. 2000, 416, 429–450.
41. Wild, J.M. Neural pathways for the control of birdsong production. J. Neurobiol. 1997, 33, 653–670.
42. Güntürkün, O. The avian ’prefrontal cortex’ and cognition. Curr. Opin. Neurobiol. 2005, 15, 686–693, doi:10.1016/j.conb.2005.
10.003.
43. Güntürkün, O. The convergent evolution of neural substrates for cognition. Psychol. Res. 2012, 76, 212–219.
44. Herold, C.; Palomero-Gallagher, N.; Hellmann, B.; Kröner, S.; Theiss, C.; Güntürkün, O.; Zilles, K. The receptor architecture of
the pigeons’ nidopallium caudolaterale: An avian analogue to the mammalian prefrontal cortex. Brain Struct. Funct. 2011, 216,
239–254, doi:10.1007/s00429-011-0301-5.
45. Von Eugen, K.; Tabrik, S.; Güntürkün, O.; Strökens, F. A comparative analaysis of the dopaminergic innervation of the executive
caudal nidopallium in pigeon, chicken, zebra finch, and carrion crow. J. Comp. Neurol. 2020, 528, 2929–2955.
46. Kröner, S.; Güntürkün, O. Afferent and efferent connections of the caudolateral neostriatum in the pigeon (Columba livia): A
retro-and antero-grade pathway tracing study. J. Comp. Neurol. 1999, 407, 228–260.
47. Dykes, M.; Klarer, A.; Porter, B.; Rose, J.; Colombo, M. Neurons in the pigeon nidopallium caudolaterale display value-related
activity. Sci. Rep. 2018, 8, 5377.
48. Kalenscher, T.; Windmann, S.; Diekamp, B.; Rose, J.; Güntürkün, O.; Colombo, M. Single units in the pigeon brain integrate
reward amount and time-to-reward in an impulsive choice task. Curr. Biol. 2005, 15, 594–602.
49. Kuenzel, W.J.; Medina, L.; Csillag, A.; Perkel, D.J.; Reiner, A. The avian subpallium: New insights into structural and functional
subdivisions occupying the lateral subpallial wall and their embryological origins. Brain Res. 2011, 1424, 67–101.
50. Reiner, A.; Perkel, D.J.; Bruce, L.L.; Butler, A.B.; Csillag, A.; Kuenzel, W.; Medina, L.; Paxinos, G.; Shimizu, T.; Striedter, G.; et
al. Revised nomenclature for avian telencephalon and some related brainstem nuclei. J Comp. Neurol. 2004, 473, 377–414.
51. Niederleitner, B.; Gutierrez-Ibanez, C.; Krabichler, Q.; Weigel, S.; Luksch, H. A novel relay nucleus between the inferior collic-
ulus and the optic tectum in the chicken (Gallus gallus). J. Comp. Neurol. 2017, 525, 513–534.
52. Brown, C.; Magat, M. Cerebral lateralization determines hand preferences in Australian parrots. Biol. Letts 2011, 7, 496-498.
53. Franklin, D.C.; Garnett, S.T.; Luck, G.W.; Gutierrez-Ibanez, C.; Iwaniuk, A.N. Relative brain size in Australian birds. Emu 2014,
114, doi:10.1071/MU13034.
54. Iwaniuk, A.N.; Dean, K.M.; Nelson, J.E. Interspecific allometry of the brain and brain regions in parrots (Psittaciformes): Com-
parisons with other birds and primates. Brain Behav. Evol. 2005, 65, 40–59.
55. Rogers, L.J.; Workman, L. Footedness in birds. Anim. Behav. 1993, 45, 409–411.
56. Iwaniuk, A.N.; Hurd, P.L. The evolution of cerebrotypes in birds. Brain Behav. Evol. 2005, 65, 215–230.Symmetry 2021, 13, 867 13 of 13
57. Rogers, L.J. Lateralization in its many forms, and its evolution and development. In The Evolution of Hemispheric Specialization in
Primates; Special Topics in Primatology; Hopkins, W.D., Ed.; Elsevier: Amsterdam, The Netherlands, 2007; Volume 5, pp. 23–
56.
58. Andrews, C.B.; Gregory, T.R. Genome size is inversely correlated with relative brain size in parrots and cockatoos. Genome 2009,
52, 261–267.
59. Healy, S.D.; Rowe, C. A critique of comparative brain studies of brain size. Proc. R. Soc. B 2007, 274, 453–464.
60. Willemet, R. Reconsidering the evolution of brain, cognition, and behavior in birds and mammals. Front. Psychol. 2013, 4, 396.
61. Herculano-Houzel, S. Numbers of neurons as biological correlates of cognitive capability. Curr. Opin. Behav. Sci. 2017, 16, 1–7.
62. Güntürkün, O.; Hellmann, B.; Melsbach, G.; Prior, H. Asymmetries of representation in the visual system of pigeons. Neuroreport
1998, 9, 4127–4130.
63. Güntürkün, O.; Stüttgen, M.C.; Manns, M. Pigeons as a model species for cognitive neuroscience. Neuroforum 2014, 5, 86–92,
doi:10.1007/s13295-014-0057-5.
64. Morandi-Raikova, A.; Danieli, K.; Lorenzi, E.; Rosa-Salva, O.; Mayer, U. Anatomical asymmetries in the tectofugal pathway of
dark-incubated domestic chicks: Rightwards lateralization of parvalbumin neurons in the entopallium. Laterality 2021, 26,
doi:10.1080/1357650X.2021.1873357.
65. Xiao, Q.; Güntürkün, O. The commissura anterior compensates asymmetries of visual representation in pigeons. Laterality 2021,
26, doi:10.1080/1357650X.2021.1889577.
66. Striedter, G.F.; Charvet, C.J. Developmental origins of species differences in telencephalon and tectum size: Morphometric com-
parisons between a parakeet (Melopsittacus undulatus) and a quail (Colinus virgianus). J. Comp. Neurol. 2008, 507, 1663–1675.
67. Lee, H.J.; Schneider, R.F.; Manousaki, T.; Kang, J.H.; Lein, E.; Franchini, P.; Meyer, A. Lateralized feeding behavior is associated
with asymmetrical neuroanatomy and lateralized gene expressions in the brain in scale-eating cichlid fish. Genome Biol. Evol.
2017, 9, 3122–3136.
68. MacNeilage, P.; Rogers, L.J.; Vallortigara, G. Origins of the left and right brain. Sci. Am. 2009, 301, 60–67.
69. Kaplan, G. Play behaviour, not tool using, relates to brain mass in a sample of birds. Sci. Rep. 2020, 10, 20437, doi:10.1038/s41598-
020-76572-7.
70. Zucca, P.; Sovrano, V.A. Animal lateralization and social recognition: Quails use their left visual hemifield when approaching
a companion and their right visual hemifield when approaching a stranger. Cortex 2008, 44, 13–20.
71. Salva, O.R.; Regolin, L.; Mascalzoni, E.; Vallortigara, G. Cerebral and behavioural asymmetries in animal social recognition.
Comp. Cogn. Behav. Rev. 2012, 7, 110–138, doi:10.3819/ccbr.2012.70006.
72. Yamazaki, Y.; Aust, U.; Huber, L.; Hausmann, M.; Güntürkün, O. Lateralized cognition: Asymmetrical and complementary
strategies of pigeons during discrimination of the “human concept”. Cognition 2007, 104, 315–344.
73. Kaplan, G. Audition and hemispheric specialization in songbirds and new evidence from Australian magpies. Symmetry 2017,
9, 99, doi:10.3390/sym9070099.
74. Costalunga, G.; Kobylkov, D.; Rosa-Salva, O.; Vallortigara, G.; Mayer, U. Light-Incubation effects on lateralisation of single unit
responses in the visual Wulst of domestic chicks. Brain Struct. Funct. 2021, doi:10.1007/s00429-021-02259-y.You can also read