CONTRIBUTION OF FISHERIES TO FOOD AND NUTRITION SECURITY IN THE SADC REGION
←
→
Page content transcription
If your browser does not render page correctly, please read the page content below

CONTRIBUTION OF FISHERIES
   TO FOOD AND NUTRITION
SECURITY IN THE SADC REGION
                              1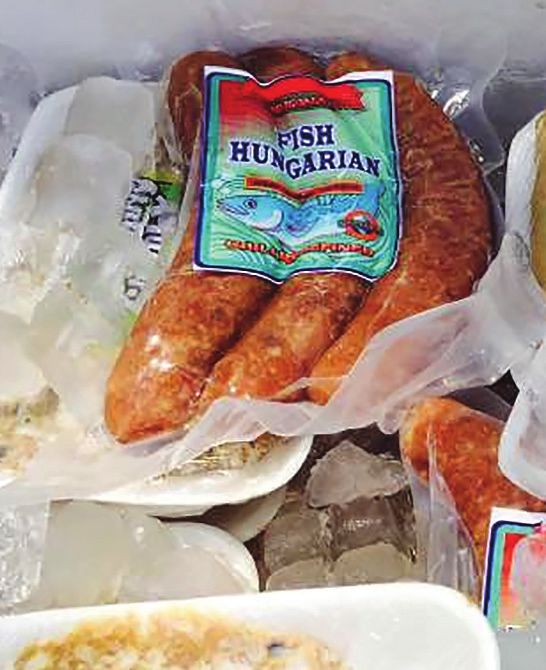
Contribution of Fisheries to Food and
 Nutrition Security in the SADC region

                April 2019

2
Contents

1 Executive Summary.................................................................................................9
2 Introduction............................................................................................................12
   2.1 Background......................................................................................................12
   2.2 Context of the study..........................................................................................13
      2.2.1 Biological sustainability underpinning fisheries development debate........13
      2.2.2 Accounting for the true cost of fisheries.....................................................14
      2.2.3 Gender and equity......................................................................................14
      2.2.4 Nutrition and fisheries.................................................................................14
      2.2.5 Governance of SADC’s fisheries resources...............................................15
3 Food and nutrition security......................................................................................16
   3.1 What is food and nutrition security?..................................................................16
      3.1.1 Global Status of food and nutrition security................................................16
      3.1.2 Food and nutrition security in SADC..........................................................16
   3.2 Regional Fish Production..................................................................................18
   3.3 Contribution of fish to regional food and nutrition security................................21
      3.3.1 Fish as dietary source of nutrients..............................................................21
      3.3.2 Health Benefits from Fish...........................................................................24
      3.3.3 Fish as a source of income........................................................................25
      3.3.4 Role of fish trade in food and nutrition security...........................................28
      3.3.5 Blue Economy Strategy..............................................................................30
4 Systematic Analysis of the Regional Fish Value Chains ........................................34
   4.1 Criteria for regional value chains......................................................................34
   4.2 Analysis of Selected Value Chains in the Region..............................................36
      4.2.1 Hake Value Chain – Namibia.....................................................................36
      4.2.2 Horse Mackerel – Namibia, Angola, South Africa.......................................36
      4.2.3 Small pelagic species value chains – Malawi.............................................37
      4.2.4 Marine and Freshwater fisheries value chains – Mozambique...................38
      4.2.5 The Kapenta value chain – Lake Kariba....................................................39
      4.2.6 Lake Victoria Dagaa (Rastrineobola argentea) value chain in Tanzania....39
      4.2.7 Tinned sardines – South Africa and Namibia.............................................40
      4.2.8 The Aquaculture (Tilapia) Value Chain – Zambia.......................................41
   4.3 Challenges and Proposed Interventions for the regional Value Chains............42
5 Fish Post-Harvest Losses and Food and Nutrition Security...................................44

                                                                                                                          3
5.1 Case Studies of Fish Post-Harvest Management Strategies............................45
      5.1.1 Improved Processing Technologies............................................................45
      5.1.2 Increased Access to Ice.............................................................................46
   5.2 Gender Considerations in Post-Harvest Losses...............................................46
   5.3 Challenges faced in Fish Post- Harvest Management by Women....................47
   5.4 Gendered Management of post-harvest losses.................................................47
      5.4.1 Development of Gendered fisheries management and aquaculture
              production approaches...............................................................................48
      5.4.2 Empowerment of women in in fish-related businesses..............................49
      5.4.3 Increased participation in co-management to increase access to
              fisheries resources.....................................................................................50
6 Update the 2016 SADC report: Country Specific Analysis for Attaining
  Increased Per Capita Consumption.........................................................................51
   6.1 Angola...............................................................................................................52
   6.2 Botswana..........................................................................................................52
   6.3 Comoros...........................................................................................................54
   6.4 Democratic Republic of Congo (DRC)..............................................................55
   6.5 Eswatini.............................................................................................................55
   6.6 Lesotho............................................................................................................57
   6.7 Madagascar.....................................................................................................57
   6.8 Malawi.............................................................................................................58
   6.9 Mauritius.........................................................................................................59
   6.10 Mozambique...................................................................................................60
   6.11 Namibia...........................................................................................................61
   6.12 Seychelles.......................................................................................................62
   6.13 South Africa.....................................................................................................63
   6.14 Tanzania.........................................................................................................64
   6.15 Zambia............................................................................................................65
   6.16 Zimbabwe.......................................................................................................66
   6.17 Sub-Strategy on Fisheries and Aquaculture...................................................67
7 Recommendations..................................................................................................80

4
ACRONYMS

AMCEN: 		   African Ministerial Conference on the Environment
AMU: 			    Arab Maghreb Union
ASF: 			    Animal Source Foods
AU: 			African Union
AU-IBAR: 		 African Union
CAADP: 		   Comprehensive Africa Agriculture Development Programme
CCARDESSA:  Centre for Coordination of Agricultural Research and
            Development for Southern Africa
DRC: 			    Democratic Republic of Congo
ECCAS: 		   Economic Community of Central African States
ECOWAS: 		  Economic Community of West African States
EEZ: 			    Exclusive Economic Zone
FAO: 			    Food and Agricultural Organisation
FTA: 			Free Trade Area
GDP: 			    Gross Domestic Product
GDP: 		     Gross Domestic Product
GHI: 			    Global Health Index
IUU: 			    Illegal, Unreported and Unregulated
KWFPA: 		   Kafue Women’s Fish processing Association
MALDECO: 		 Malawi Development Cooperation
MCS: 			    Marine Conservation Society
NEPAD: 		   New Partnership for African Development
PSMA: 		    Port State Measures
RASAP: 		   Regional Aquaculture Strategy and Action Plan
RSW: 			    Refrigerated Seawater
SADC: 		    Southern African Development Cooperation
SDG: 			    Sustainable Development Goal
SDG: 			    Sustainable Development Goal
SSF: 			    Small Scale Fisheries
TOR: 			    Terms of Reference
UN: 			     United Nations
WHO: 			    World Health Organisation

                                                                     5
List of Tables

Table 1: Prevalence of undernourishment and Food Insecure Population
in SADC Member States, 2016...................................................................................19
Table 2: Fish production distribution and supply in 2016 in the SADC States.....................21
Table 3: Share of selected economic groupings imports and exports in
total African trade as of 2016......................................................................................22
Table 4: The nutrient content of fish and other foods (per 100 g)................................26
Table 5: Number of people employed in Aquaculture and fisheries related
activities in Selected SADC countries........................................................................27
Table 6 : Contribution of Fisheries to National Economic Growth (measured
as GDP) .................................................................................................................... 29
Table 7: Estimated quantities of fish and fishery products informally traded
between (a) Zambia and (b) Malawi, and neighboring countries................................31
Table 8: Challenges and Proposed Interventions.......................................................45
Table 9: Participation of Women in Usipa and Kapenta Value Chains.......................50
Table 10: Fish Supply Projections for Angola.............................................................56
Table 11: Fish Supply Projections for Botswana.........................................................57
Table 12: Fish Supply Projections for Comoros..........................................................58
Table 13: Fish Supply Projections for Democratic Republic of Congo........................59
Table 14: Fish Supply Projections for Eswatini...........................................................60
Table 15: Fish Supply Projections for Lesotho............................................................61
Table 16: Fish Supply Projections for Madagascar.....................................................62
Table 17: Fish Supply Projections for Malawi.............................................................63
Table 18: Fish Supply Projections for Mauritius..........................................................64
Table 19: Fish Supply Projections for Mozambique....................................................64
Table 20: Fish Supply Projections for Namibia...........................................................65
Table 21: Fish Supply Projections for Seychelles.......................................................66
Table 22: Fish Supply Projections for South Africa.....................................................67
Table 23: Fish Supply Projections for Tanzania..........................................................68
Table 24: Fish Supply Projections for Zambia............................................................69
Table 25: Fish Supply Projections for Zimbabwe.......................................................70

6

List of Figures

Figure 1: Trade Balance in Southern Africa................................................................21
Figure 2: Per capita fish supply in SADC....................................................................23
Figure 3: Trends in Per Capita Fish Consumption In SADC.......................................24
Figure 4: Contribution of Fish to animal and total proteins in SADC Member states..25
Figure 5: Protein contribution of selected animals sources in Southern Africa
in 2013.......................................................................................................................25
Figure 6: Proposed pathways linking fish, food security and human nutrition,
developed based on HLPE, 2014; with additional dimensions from Herforth
& Harris, 2013, revised by Julia Bruyn 2018..............................................................28
Figure 7: Generic fisheries value chain.......................................................................37
Figure 8: Female Participation in Trade......................................................................52

                                                                                                                              7
Acknowledgements

This SADC report on “Contribution of fisheries to food and nutrition security in the
SADC region” is the outcome of the collaborative process by SADC Secretariat, NEPAD
Regional FishNode at Lilongwe University of Agriculture and Natural Resources
(LUANAR) and WorldFish. It was supported through the European Union (EU) 11th
EDF project entitled: Towards Operationalisation of the SADC Regional Agricultural
Policy, implementation of the SADC Food and Nutrition Security Strategy.

The preparation of this report was led by Professor Emmanuel Kaunda and Dr. Sloans
Chimatiro, with support from Ms. Edith Gondwe, Mr. Boniface Nankwenya, Mrs.
Chimwemwe German and Ms. Msekiwa Matsimbe from LUANAR. The review was
undertaken between November 2018 and February 2019.

Special thanks to SADC Member States fisheries and aquaculture focal points for
providing relevant data and information and for validating this report.

8

1    Executive Summary

Introduction: Fish can play an important role in improving Southern Africa’s food
security and nutritional status, as more than 100 million people in the region eat fish
regularly. Although the region has made considerable strides towards attaining improved
nutrition status, the number of food insecure people in the region is still alarmingly high,
as 38.4 million people were estimated to be food insecure in the 2016/17 consumption
year representing 11.5 % of the total population. Twelve of the 15 Member states fall
among the top 50 countries with high prevalence of undernourishment; and only 5
(Eswatini, Namibia, Seychelles, South Africa and Zimbabwe) are on track to eradicate
stuntedness among children under the age of five years.

Enhancing to access to fish and products to address nutritional and food needs of the
region would imply increase fish supply to countries. This negative trade balance helps
the region to attain an overall healthy fish supply estimated at about 2.9 Million tons,
considering exports, imports and 13% of fish production used as non-food1. However,
it is clear that the region’s demand far outweighs its local production. Therefore, for
strategic reasons, it might be important for the region to attain some level of self-
sufficiency put in place strategies to enhance production.

Pathways of Contribution of Fish to Food and Nutrition Security: The contribution
of fish to food and nutrition security is in two ways, either as a direct source of nutrients
or as a source of income with which fishing communities can use to buy other types
of food. While sources of protein intake in many SADC countries is predominantly
animal ,fish and fisheries products have the potential to have a significant impact on
food security and good nutrition in the region. The current per capita consumption
of fish in the region is pegged at 11.3kg, which is way lower than the recommended
global per capita consumption of 19kg. Except for Mauritius, Seychelles and Angola,
per capita fish consumption for all other SADC countries remains grossly below the
global average and also below the average for Africa of 9.9kg/capita/year. In terms
of income contribution, the fisheries and aquaculture sector employs a total of about
3.3 million people, equivalent of about 1 % of the SADC population. Noteworthy is the
fact that in 2016, overall, women accounted for nearly 14 percent of all people directly
engaged in the fisheries and aquaculture primary sector. At a macroeconomic level,
the importance of the sector is reflected owing to the fact that fisheries and aquaculture
sectors account for an estimated 3.5% of the region’s gross domestic product (GDP)
and 9% of the region’s agriculture GDP.

Role of Fish Trade: The role of trade, especially informal trade, further reveals that
fish and food nutrition in the security can be achieved through improving the flow of
fish products in the region and addressing the challenges that limit the flow of the fish
products.

Role of Regional Value Chains: Value chain participation is a crucial element of the
Industrialization Strategy because it has the potential to extend production possibilities
and enable cross-border utilization of natural and human resources of the region.

1 FAO 2018 State of Aquaculture and Fisheries
                                                                                           9
Therefore, SADC region stands to gain by developing fish and fishery product
regional value chains, within the framework of the SADC Industrialisation Strategy,
because fish accomplishes the two objectives of the Strategy, because (i) fish is can
form viable regional value chains capable of interacting with global value chains;
and (ii) fish can be a tool for accelerating the economic empowerment of youth and
women. The Horse Mackerel value chain in Namibia is one example of the regional
value chains. Horse mackerel is currently marketed as one of the cheapest protein
sources in African markets, with the majority of horse mackerel being sold to high end
consumers in Zambia, Mozambique, the Democratic Republic of Congo and South
Africa. The Kapenta value chain from Lake Kariba also serves as a regional product,
being supplied to Malawi, Mozambique, DRC, South Africa and Namibia. It is however
observed that these value chains are marred by several challenges such as poor
infrastructure and limited knowledge by traders on export and import procedures.
Post-Harvest Losses: Improving food security requires making better use of fish of
fish produced by reducing post-harvest losses and increasing the percentage of fish
available for human consumption. Most countries in the region have high post-harvest
losses hence threatening the supply of fish to consumers. These losses are incurred
both in physical, economic and nutritional aspects. It is noted that combatting post-
harvest losses requires improved technologies such as Improved Processing (case
of solar tent dries in Malawi and Zambia) and increased access to ice (case of Ice
in Seychelles). Owing to the fact that 91.5% of the women involved in fisheries are
employed in post-harvest activities as processors and traders, it is considered important
that gendered strategies be employed in mitigating post-harvest losses in the region.
Such strategies include empowerment of women in fish related businesses, increased
access to finance and increased participation in co-management to increase access
to fisheries resources.
Country Specific Analysis for Attaining Increased Per Capita Consumption: In
its recent report, EAT-Lancet Commission (2019)2, focused on two “end-points” of
the global food system: final consumption (healthy diets) and production (sustainable
food production); because these factors disproportionately impact human health
and environmental sustainability. Guided by the EAT-Lancet commission approach,
the report undertook analysis on projected fish supply to maintain current per capita
fish consumption under increased populations and projected fish supply to reach
recommended per capita consumption. Countries in the region need to achieve fish
increases of between 55% and 1,635% to achieve recommended per capita fish
consumption of 19kg. The strategies to meet this required increase in fish supply
therefore include increased aquaculture production, increased formal and informal
trade and increase research in fisheries.
Recommendations: The following recommendations are drawn to ensure that fish
continues to contribute to increased food and nutrition security in the region:
• Member countries should adopt guidelines for the implementation of the AU
Policy Framework and Reform Strategy which are consistent with the SADC
Protocol on fisheries.
2 Willet, W. et al. 2019. Food in The Anthropocene: the EAT-Lancet Commission on Healthy Diets From
Sustainable Food Systems. https://doi.org/10.1016/S0140-6736(18)31788-4
10• Beyond the SADC boundaries, Member States should be guided by the various
global instruments, including PSMA and others. Member states should focus
on sustainable development of fisheries and aquaculture through better and
more effective rules, knowledge and research
• SADC should strive to attain the Sustainable Development Goal 2 “End
Hunger”, in order to (i) achieve food security, (ii) improve nutrition, and (iii)
promote sustainable food systems through fisheries and aquaculture by 2030.
• SADC should pursue the drive towards a common vision on domestic and
regional fish trade and together with AU and NEPAD continue to build a shared
understanding of the role of fish trade as a potential pathway to food and
nutrition security and livelihood.
• SADC Member States should aim to reduce food-fish loss and waste by
concretely reduce by half of current level, in line with SDG target 12.3, by
adopting the EAT-Lancet Commission (2019)
• SADC and Member States should foster innovation and research in order to
improve fisheries, aquaculture food systems.
• SADC and Member States should promote market-led sustainable aquaculture.
Key outcome to be monitored at country level must be in line with the SADC
Regional Aquaculture Strategy,
• SADC and Member States should emphasise on transforming the role of
women, by promoting transformative approach, making sure that interventions
benefit and empower women and men.
• SADC should strive to attain the Sustainable Development Goal 14 (Life Below
Water) “Conserve and sustainably use the oceans, seas and marine resources
for sustainable development” by adopting appropriate governance structures
within the sector
Proposed Strategies: The following strategies are proposed to ensure that member
countries attain goal of increased contribution of fish to food and nutrition security:
• Promote supply of fish through improved production and governance
• Increase access to high quality and adequate fish for improved livelihoods,
food and nutrition security
• Improve utilization of fish as part of nutritious, healthy, diverse and safe diet
• Improved domestic and regional value chains
• Integrate fish in national and regional plans
• Enhance adoption of Transformative Approach to inclusion of women regional
value chains
• Reduce fish post-harvest losses
• Promote active youth engagement and participation in aquaculture and
fisheries sector
• Develop and harness SADC Regional Strategy on Blue Economy
112 Introduction 2.1 Background Fish can play an important role in improving Southern Africa’s food security and nutritional status, as more than 100 million people in the region eat fish regularly. Fish is a critical source of dietary protein and micronutrients for many isolated communities in rural areas. Fish may also be the sole accessible and/or affordable source of animal protein for poor households in urban, peri-urban, as well as those in remote fishing villages. Fish also contributes indirectly to national food self-sufficiency through regional and international trade. Fish is more nutritious than some of the staple foods such as cereals, because it provides essential fatty acids, vitamins and micronutrients and can play an extremely important role in improving the nutritional status of individuals, in particular those at risk such as children during their first 1,000 days of life and pregnant and/or lactating mothers. Fish is an efficient converter of feed into high quality food, and it has a lower carbon footprint compared to other domesticated animal production systems. Because of all these attributes, fish should definitely be on the menu in the region. Indeed the SADC region has responded to the importance of fish as a source of food and nutrition security by putting in place a number of regional agreements, both voluntary and legally binding ones. The SADC Protocol on Fisheries3 was the first regional agreement of its kind in Africa, to be signed by Heads of State and Government. The Protocol aims “to promote responsible and sustainable use of the living aquatic resources and aquatic ecosystems of interested State Parties” in order to (i) promote and enhance food security and human health, (ii) safeguard livelihoods of fishing communities, and (iii) alleviate poverty. Subsequently, the Dar es Salaam Declaration on Agriculture and Food Security4 identified short term (2004-2006) goals on fisheries and aquaculture that aimed to increase aquaculture and marine farming and improve fish stock management and fish production quality through pre and post- harvest handling, processing and storage, in accordance with the SADC Protocol on Fisheries. The Medium-term (2004-2010) goals included (i) promote conservation, management and sustainable utilization of plants and animals, including fisheries, forestry and wildlife; and (ii) harmonize and accelerate implementation of natural resources management policies and programs and increase investments in processing of natural products. While the recent SADC Food and Nutrition Security Strategy (2015-2025)5 clearly outlines strategies aimed at “Significantly reduce food and nutrition insecurity in the Region by 2025”, a sub-strategy on the contribution of fisheries and aquaculture to the SADC Regional Strategy has not been developed. An attempt was made by SADC Secretariat, through CCARDESSA, to prepare a report on “The role of Fisheries in Food and Nutrition Security in the SADC Region6”. Whilst the report revealed 3 SADC. 2001. SADC Protocol on Fisheries. Southern African Development Community, Gaborone, Botswana. 4 SADC. 2004. Dar es Salaam Declaration on Agriculture and Food Security in the SADC Region. SADC Heads of State & Government Declaration. SADC Secretariat, Gaborone, Botswana. 5 SADC. 2014. Food and Nutrition Security Strategy (2015-2025). SADC Secretariat, Gaborone, Botswana. 6 Davies, S. 2015. The Role of Fisheries in Food and Nutrition Security in the SADC Region. Centre for Coordination of Agriculture Research and Development in the South Africa (CCARDESSA) 12
important issues for the role of fish in the region, key drivers of the fisheries sector
in the region such as regional value chains, management of postharvest losses,
and country specific analysis of required improvements in the fish sector were not
highlighted. Therefore, this study was commissioned in order to (i) determine the
extent to which fish contributes to food and nutrition security in SADC; (ii) assess
the consumption requirements and foresight production levels for sustained role of
fish in alleviating malnutrition in member states of the region; (iii) present options for
harnessing the SADC regional instruments to augment regional fish value chains; (iv)
point to potential fisheries and aquaculture targets for countries to address in order
to achieve sustainable food systems for a growing population of SADC; (v) identify
critical regional and country level investments in order for SADC to achieve Regional
Food and Nutrition Security Strategy; and (vi) recommend policy options for countries
to align the SADC fisheries and aquaculture strategies with Sustainable Development
Goals 2 and 14.

This report, therefore, serves to guide countries in addressing the potential targets for
the fisheries and aquaculture goal, in order to achieve sustainable food systems for
a growing population of SADC. It is envisaged that the report will be used to inform
regional and country level investments that are aligned with the SADC Regional
Food and Nutrition Security Strategy and other continental (e.g. CAADP and Policy
Framework and Reform Strategy for Fisheries and Aquaculture in Africa) and global
instruments (e.g. various FAO Voluntary Guidelines).

2.2     Context of the study

2.2.1    Biological sustainability underpinning fisheries development debate

Fisheries debates have been concentrating predominantly on questions of biological
sustainability and on the economic efficiency of fisheries, neglecting issues linked
to its contribution to reducing hunger and malnutrition and supporting livelihoods. At
the regional level, food security experts and decision makers seem unfamiliar with
the critical role that fisheries and aquaculture are playing and likely to play in the
future. According to the outcome of the SmartFish study titled “Flavoring Fish into
Food Security”7this lack of integration of fisheries in the food security policy scenario
is attributed to the low participation, if any, of national fishery officers in the design of
policies. Assessing the performance of fisheries development investment in Africa,
Cunningham and Neiland (2010)8 concluded that by and large, fisheries assessments
have tended to focus on fisheries production (output) and the status of the fish stocks
(environmental criteria), and have not considered the economic and social dimension
to the same extent. As a result, the policy agenda has been dominated by other
disciplines, especially fish biology or fisheries science, with a resulting overemphasis
on the fish stock.

Therefore, fish deserves more attention in food policies than it currently receives

7 Kurien and LopezRios, 2013
8 Stephen Cunningham, S. and A.E. Neiland. 2010. African fisheries development aid. In Leal, D. ed. 2010.
Political Economy of Natural Resource Use: Lessons for Fisheries Reform Prepared for the Global Program on
Fisheries (PROFISH). April 2010. Agriculture and Rural Development Department. The World Bank. Washington
DC.
                                                                                                        13
due to its importance in the food basket, its unique nutritional properties, its higher efficiency of production and carbon footprint compared to other forms of animal production systems. Some challenges which need to be addressed include making fish more affordable for the poor, improving the environmental sustainability of the sector, access to fish and fish-related employment, tension between small-scale and commercial producers and climate change. 2.2.2 Accounting for the true cost of fisheries In addition to the challenges outlined above, a lot of fishing operations incur costs from many different aspects; these include the vessel/boat itself, fuel, fishing equipment, crew, licenses, and so forth. The amount of fishing effort and hence the catch will depend on the cost of producing fishing effort, so overexploitation is linked to the potential value or wealth of the fishery, and hence it is the most valuable fish stocks that are overexploited first (PAF Governance Working Group 2016). Making sure every bit of a catch counts as income is essential especially where fishers are running on tight margins. Wilen (2005)9 pointed out that fisheries reform (in particular towards secure rights) would change fish resource exploitation patters in ways that will both increase revenue and decrease costs. Decreasing costs entails managing or reducing fishing effort. Whilst some may focus on improving catch efficiencies, losses can occur throughout the supply-chain. These ‘post-harvest losses’ are the most prevalent in small-scale fisheries, especially in poor fishing communities of the SADC region. Post- harvest losses aren’t just an economic concern, but a food and nutrition security issue as well as a gender challenge. 2.2.3 Gender and equity Generally, women play a role as workers in fishing, marketing and processing as well as caregivers to fishing community families. Often less educated, they tend to concentrate on the low value end of the value chains. Men tend to dominate commercial channels of high commercial value species such as tilapia, perch, tuna and swordfish, while women mainly have access to lower economic value species such as small pelagic, for local markets and direct consumption. Considering the existence of gendered roles in the fisheries sector, especially in informal fish processing and trading, it is important to adopt and use a gender transformative approach. This approach ensures that interventions engage with both women and men, addresses power relations and unequal power dynamics across social groups and crosses scales, challenges oppressive norms, practices and structures. Gender mainstreaming is a first approach towards gender transformative approach. In this regard, it is critical to ensure that gender is mainstreamed in all the planning, implementation, monitoring and evaluation of the fisheries and aquaculture development interventions and project activities. 2.2.4 Nutrition and fisheries The oceans, lakes, rivers and floodplains are a source of highly nutritious food for humanity; hence, researchers estimate that if current trajectories of fishery decline 9 Wilen, J. (2005) “Property rights and the texture of rents in fisheries”. In: D. Leal (editor) Evolving property rights in marine fisheries. Lanham, USA: Rowman and Littlefield 14
persist, 845 million people could become at risk of diseases associated with
malnutrition10. The SADC stakeholder consultation at the 6th Pan African Fisheries
Association conference held in Malawi on 25th September, 2018 noted that the state of
malnutrition in the SADC region is severe and chronic; especially stuntediness. This
is compounded by high population growth and slow economic growth which is leading
to poverty. Therefore, the proportion of malnutrition is rising, there is a need to identify
options for enhancing the role of fisheries to address malnutrition; and these could
include strategies to rebuild degraded fish stocks, including collaborative management
for shared fisheries; and promoting cross-border fish trade.

2.2.5    Governance of SADC’s fisheries resources

In a recent report by NEPAD, five major transitions were identified, namely demographic
tsunami, technology, natural systems, human development and governance11. Within
the framework of the UN Sustainable Development Goals (SDGs), particularly SDG
2, SADC seeks to renew momentum and rally its member states around the target
to end hunger, achieve food security and improve nutrition and promote sustainable
agriculture. However, effective governance of SADC’s fisheries resources remains key
to sustainable utilization and management of these resources for efficient contribution
to food and nutrition security. Among other strategies, there is a need for SADC
members to develop strategies in line with their commitment to FAO Guideline on
Responsible Governance of Tenure of Land, Fisheries and Forestry, as well as their
commitment to CAADP through the Malabo Declaration.

Drawing on the issues above and the TORs provided by SADC, this report reviewed
and updated the 2016 SADC on the contribution of fish to food and nutrition security.
Specifically, the report attempts to provide strategies to allow SADC countries to meet
per capita fish consumption in countries.

10 Sustainable Ocean Alliance. 2019. State of Our Ocean. Davos, Switzerland
11 AUDA-NEPAD. 2019. “Africa’s path to 2063: choice in the face of great transformations”
                                                                                            15
3 Food and nutrition security
3.1 What is food and nutrition security?
The concept of food and nutrition security has evolved dramatically in the past several
decades both in theory and practice. In SADC Food And Nutrition Security Strategy
2015 - 2025 food and nutrition security is defined as; when all people at all times
have physical, social and economic access to food, which is safe and consumed in
sufficient quantity and quality to meet their dietary needs and food preferences, and is
supported by an environment of adequate water and sanitation, health services and
care, allowing for healthy and active life.
The three pillars of food and nutrition security are:
• Availability which is achieved when adequate food is at the disposal of
individuals;
• Accessibility is when households and individuals have sufficient resources to
secure appropriate foods in terms of quantity and quality (through production,
purchase or donation) for a nutritious diet; and
• Utilization which refers to the ability of the human body to ingest and metabolize
food. The food should be nutritious and safe for consumption under adequate
biological and social environment with proper health care.
3.1.1 Global Status of food and nutrition security
Although substantial progress in reducing hunger worldwide has been made this
century, millions of people still lack access to an adequate supply of nutritious food12.
One in nine people in the world today are undernourished, with poor nutrition causing
45 % of deaths in children under five years old13. The immensity and urgency of this
global challenge is reflected in the Unites Nations Sustainable Development Goals
(SDGs), with goal two specifically aiming to end hunger, achieve food security and
improved nutrition. There is a need to foster sustainable ways to provide adequate
food and nutrition to the world’s growing population which is estimated to grow by
another billion by the year 2030 and to reach 9.8 billion by 205014.
3.1.2 Food and nutrition security in SADC
Despite the huge resource endowments, the regional food and nutrition security situation
remains unstable and unpredictable. The proportion of food insecure households in
the SADC remains high despite improved food production in some Member States
in recent years. Available evidence indicates continued existence of chronic food
insecurity, marked with high levels of poverty and disease burden. Vulnerability to
food and nutrition insecurity amongst children, women and youth is known to be high
in many SADC countries.
12 UN (United Nations). 2015. Transforming Our World: The 2030 Agenda for Sustainable Development. New
York: United Nations
13 (http://www.un.org/sustainabledevelopment/hunger/)
14 UN DESA (UN Department of Economic and Social Affairs). 2017. World Population Prospects: The 2017
Revision, Key Findings and Advance Tables. Working Paper No. ESA/WP/248. New York: United Nations,
Department of Economic and Social Affairs, Population Division.
16About 38.4 million people were estimated to be food insecure in the 2016/17
consumption year representing 11.5 % of the total population.
In 2013, ten of the SADC Member States experienced stunting rates of close to or
above 30% which according to the WHO, are classified as high or very high. Maternal
under- nutrition is a major contributor to foetal growth restriction, which increases the
risk for neonatal deaths and, for those that survive, of stunting by 2 years of age.
Twelve of the 15 Member states fall among the top 50 countries with high prevalence
of undernourishment; and only 5 (Eswatini, Namibia, Seychelles, South Africa and
Zimbabwe) are on track to eradicate stuntedness among children under the age of
five years (Table 1).
17Table 1: Prevalence of undernourishment and Food Insecure Population in SADC
Member States, 2016
Prevalence of un- % of food % children un- Global Hunger
Country dernourishment insecure der 5 year who Index (2018)4
(% of population) population are stunted~
* #
Ranking
Angola 23.9 2.6 38 95
Botswana 28.5 2.6 31 84
Congo, DR 26 7.5 43 -
Comoros 31 101
Eswatini 20.7 47.5 27 76
Lesotho 12.8 32.2 33 78
Madagascar 43.1 4.6 41 116
Malawi 26.3 37.0 37 87
Mauritius 5.8 14 47
Mozambique 30.5 6.9 43 102
Namibia 25.4 29.4 23 80
Seychelles 14.5 8 -
South Africa 6.1 25.6 27 60
Tanzania 32 0.6 35 95
Zambia 44.5 5.9 40 115
Zimbabwe 46.6 25.2 27 107
Source: *World Bank Data, #SADC Member States; @AU-AfDB (2019); 4von Grebmer
et al (2018).
Global Hunger Index (GHI) of between 20 and 34.9 is considered serious and those
above 50 are extremely alarming. Therefore, the 2018 Global Hunger Index (GHI)
indicates that the level of hunger and undernutrition worldwide fell into the serious
category, at a value of 20.9, casting doubt as to whether the world will achieve
Sustainable Development Goal (SDG) 2 (von Grebmer et al 2018)15. From Table 1
above, it is clear that SADC as a region is not doing better either.
3.2 Regional Fish Production
Fisheries and aquaculture remain important to the economies of SADC Member
States. In many countries, fish is the only affordable source of dietary animal protein
15 von Grebmer, K., Bernstein, J. Patterson, F., Sonntag, A., Klaus, L.M., Fahlbusch, J., Towey, O., Foley, C., Gitter,
S., Ekstrom, K., and H. Fritschel. 2018. Global Hunger Index: Forced Migration and Hunger. Welthungerhilfe and
Concern Worldwide, Dublin and Bonn.
18and therefore, of overwhelming importance for food and nutrition security. More than
97% of this production comes from a diversified capture fisheries sub-sector, which
has been stagnating around 2.5 million tons in last 10 years or so, but has recently
increased to about 3 million. Although aquaculture’s contribution to total fish production
is relatively small, it is growing at an exponential rate. The sub-sector has recently
increased from 44,991.64 metric tonnes (2010) to 102,329 metric tonnes (2016)16. To
support future needs, capture fisheries will need to be sustained and where possible
enhanced, and aquaculture developed rapidly, to increase by an annual average
of more than 8.3% by 2026, in line with the SADC Regional Aquaculture Strategy
and Action Plan (RASAP). The current growth of an average 15% is because most
countries are growing from a zero or low base.
In additional to fish production, intra-regional trade in Southern Africa can also
influence fish supply in the countries. Although there is high level intra-southern Africa
trade, which, to some extent, is facilitated by the SADC’s Free Trade Area, due to high
demand for fish in the region, SADC region is recoding a negative trade balance, as
shown in Figure 1. This negative trade balance helps the region to attain an overall
healthy fish supply estimated at about 2.9 Million tons (Table 2), considering exports,
imports and 13% of fish production used as non-food17. However, it is clear that
the region’s demand slightly outweighs its local production. Therefore, for strategic
reasons, it might be important for the region to attain some level of self-sufficiency put
in place strategies not only to enhance production, but also local fish consumption.
Figure 1: Trade Balance in Southern Africa
16 FAO STAT 2018
17 FAO 2018 State of Aquaculture and Fisheries
19Table 2 show the fish production, distribution and supply for countries in the SADC
Region in 2016.
Table 2: Fish production distribution and supply in 2016 in the SADC States
Aquaculture Capture Fisher- Fish Total Fish
Exports
Country production in ies production Imports Supply
(tons)
2016 (tons) in 2016 (tons) (tons) (tons)*
Angola 655 486,490 143,112 19,321 547,607
Botswana 15 38 5,680 18 5,708
Comoros 0 38,218 1,575 0 12,045
Congo, Dem.
Rep. of the 3,161 237,372 128,316 88 337,492
Eswatini 100 65 i7i498 0 7642
Lesotho 1,050 52 8i927 2i660 3,362
Madagascar 25,998 142,333 14,463 22,045 138,866
Malawi 7,646 152,852 2,356 14 141,976
Mauritius 1,021 18,062 193,736 79,675 133,144
Mozambique 1,180 299,591 37,788 10,390 289,069
Namibia 591 503,878 27,150 404,151 61,887
Seychelles - 127,128 75,684 166,801 19,484
South Africa 7,994 622,070 193,079 205,840 535,395
Tanzania 12,547 370,966 25,033 44,469 314,221
Zambia 30,285 83,918 126,924 315 225,966
Zimbabwe 10,085 15,711 22,536 3,223 45,109
SADC total 102,329 3,060,526 998,827 956,917 2,799,428
Source: FAO STAT (2018). *Own calculations based on fish production data, fish trade
data
An analysis of imports and exports data from a selected Regional Economic groupings
shows that SADC is a key player in the continents export of fish and fisheries products.
Exports from SADC alone constitute 36 percent of the total exports from within Africa,
second after Arab Maghreb Union (AMU). This shows the important role that SADC
plays in addressing the region’s food and nutrition insecurity through trade. For
instance, in 2017 South Africa and Namibia exported 1583 tons and 2464 tons of
frozen fish to ECOWAS, respectively, while Mozambique exported 279 tons of fish to
the Economic Community of Central African States (ECCAS) in 201718 .
18 Trade Map, 2018
20Table 3: Share of selected economic groupings imports and exports in total African
trade as of 2016
Selected Economic Exports Imports Share of Share of
Regions (tons) (tons) exports (%) imports (%)
ECCAS 25368 1166712 0.96 26.12
SADC 956829 873664 36.37 19.56
EAC 71848 83479 2.73 1.87
ECOWAS 343721 1738549 13.07 38.92
AMU 1179022 189377 44.82 4.24
Others 54036 414875 2.05 9.29
Africa 2630824 4466656 100 100
Source: Authors computations from FAOSTAT data (2018)
3.3 Contribution of fish to regional food and nutrition security
Fish contributes to food and nutrition security in two ways, either as a direct source
of nutrients or as a source of income with which fishing communities can use to buy
other types of food.
3.3.1 Fish as dietary source of nutrients
Sources of protein intake in many SADC countries is predominantly animal (see Figure
4 below). While bearing in mind that diets are influenced by culture (for example, fish
is uncommon in diets of pastoralist societies), fish and fisheries products have the
potential to have a significant impact on food security and healthy diets in the region.
FAO19 reports that global fish consumption has grown from 9.0 kg in 1961 to 20.2 kg in
2015, at an average rate of about 1.5 percent per year. However, except for Mauritius,
Seychelles and Angola, per capita fish consumption for all other SADC countries
remains grossly below the global average and also below the average for Africa of
9.9kg/capita/year (Figure 2). The per capita fish consumption has only increased from
10kg to 11.3kg from 2010 to 2013 despite the increase in fish production as shown
in Figure 3. Population growth further compounds the challenges of maintaining a
sufficient supply of fish to meet food security needs.
19 FAO (2018) – State of Aquaculture and Fisheries
21Figure 2: Per capita fish supply in SADC Figure 3: Trends in Per Capita Fish Consumption in SADC In the context of the Blue Economy, food security is very closely related to the sustainable use of biodiversity particularly where it pertains to the exploitation of wild fisheries. 1 billion people in developing countries depend on seafood for their primary source of protein. In SADC region, more than 100 million people eat fish every day and fish is the main sources of animal protein in many member states countries. Some countries (e.g. Seychelles, Mozambique and DRC) obtain more than 30% of their 22
animal-source protein from fish and certain individual communities are nearly entirely
dependent on fish for protein – Figure 4. For example, in Velondriake, Madagascar,
fish constitute 99 percent of meals with concentrated protein20.

Fish is often one of the only animal protein sources available for increasing dietary
diversity in populations where starch-based staples predominate, especially because
fish is often less costly and more accessible than other animal-source foods21
Monotonous diets based on starchy staple crops are a primary reason for continuing
high rates of undernutrition. Animal-source foods (ASFs), including fish, meat, milk
and eggs provide high-quality animal protein, essential fatty acids and important
micronutrients that are difficult or impossible to obtain in adequate amounts from plant-
source foods alone22.

Figure 4: Contribution of Fish to animal and total proteins in SADC Member states

The protein contribution of fish is almost similar to that of Eggs and greater than the
individual contributions of pig meat, bovine meat, mutton and goat – Figure 5. Poultry
meat and Bovine meat are the leading sources of animal protein in southern Africa

20 Bennett, Abigail, Pawan Patil, Kristin Kleisner, Doug Rader, John Virdin, and Xavier Basurto. 2018.
Contribution of Fisheries to Food and Nutrition Security: Current Knowledge, Policy, and Research. NI Report 18-
02. Durham, NC: Duke University, http://nicholasinstitute.duke.edu/publication.
21 Belton and Thilsted 2014
22 Neumann et al, 2002
                                                                                                             23
Figure 5: Protein contribution of selected animals sources in Southern Africa in 2013 3.3.2 Health Benefits from Fish Fish provide essential macro and micronutrients which are necessary to end malnutrition and reduce the burden of communicable and non-communicable disease around the world. Specifically, Fish provide a healthy lean protein, crucial fatty acids, including omega-3 polyunsaturated fatty acids, and essential micronutrients, including vitamins A, D, and B and calcium, zinc, iron, and iodine necessary for cognitive development and function, in particular those at risk such as children and women. In many resource-poor settings, they are the most accessible form of animal-source food and greatly enhance the nutritional adequacy of diets based largely on starchy staple crops. Beyond their own nutrient content, animal-source foods also increase the uptake of nutrients such as iron from plant-source foods. Protein from fish is said to be 5-15% more digestible than that from plants, and fish protein improves the digestion of plant protein23. Table 4 shows comparison of fish (indigenous to the SADC region) with plant-source foods and other animal-source foods. 23 Bene, C. and Nozomi, K. (2011). The potential role of small fish species in improving micronutrient deficiencies in developing countries 24
Table 4: The nutrient content of fish and other foods (per 100 g)
 Common                                   Total Polyunsaturated
                       Protein (g)                                              EPA (g)         DHA (g)
 name                                     Fatty Acids (PUFA) (g)
 Carp                  17.83              1.43                                  0.238           0.114
 Tilapia               20.80              0.476                                 0.007           0.113
 Sardine               24.60              5.148                                 0.470           0.509
 Ground beef           14.30              0.696
 Chicken breast        14.70              3.340
 Chicken egg           35.60              7.555                                 0.004           0.037
 Cow’s milk            3.28               0.136
 Cassava               1.40               0.048
 Rice                  2.69               0.323
 Kidney beans          8.67               0.278
 White Corn            9.47

3.3.3    Fish as a source of income

In addition to direct consumption, fisheries contribute to food and nutrition security
through income generation, increasing the household’s ability to purchase food and
providing a source of employment for women who participate in fishing and postharvest
activities24.

The most recent official statistics indicate that 59.6 million people globally were
engaged in the primary sector of capture fisheries and aquaculture in 2016, with 19.3
million people engaged in aquaculture and 40.3 million people engaged in fisheries.
Asia (85%) and Africa (10%) contribute to about 95 percent of the global population
engaged in the fisheries and aquaculture sectors in 2016. This is due to higher
population growth and increasing economically active populations in the agriculture
sector have shown a generally positive trend for the number of people engaged in
capture fishing and even higher rates of increase in those engaged in aquaculture. It
is estimated that in 2016, overall, women accounted for nearly 14 percent of all people
directly engaged in the fisheries and aquaculture primary sector25. In SADC region, the
fisheries and aquaculture sector employs a total of about 3.3 million people, equivalent
of about 1 % of the SADC population – Table 5.

24 Kawarazuka, N., and C. Béné. 2010. “Linking Small-scale Fisheries and Aquaculture to Household Nutritional
Security: An Overview.” Food Security 2(4): 343–357.
25         FAO (2018). The State of World Fisheries and Aquaculture 2018
                                                                                                           25
Table 5: Number of people employed in Aquaculture and fisheries related activities in
Selected SADC countries
Total em- Total em- Total Em-
ployed % Fe- ployed ployment in
Country Male Female
(fisher- male (aqua-cul- fish related
ies) ture) sectors
Angola 453,426 267 453,693
Botswana 581 581
Congo, Dem.
376,274 183,047 193,227 51 2,035 378,309
Rep. of the
Comoros
Eswatini 615 441 1,056
Lesotho 714 708 1,422
Madagascar 166,013 158,359 7,654 5 15,250 181,263
Malawi 164994 149957 15037 9 8,334 173,328
Mauritius 6,839 6,669 170 2 346 7,185
Mozambique 374,026 368,877 5,149 1 4,167 378,193
Namibia 388,105 1,132 389,237
Seychelles 160,249 160,249
South Africa 506,917 7,168 514,085
Tanzania 517,126 372,824 144,302 28 24,307 541,433
Zambia 148,694 6,490 155,184
Zimbabwe 30,786 4,685 35,471
Total 3,303,693 74,135 3,377,828
Source: de Graaf and Garibaldi (2014)26
The small-scale sector, making up 90 percent of the fishers, is especially important in
terms of enhancing food and nutrition security through income generation. In theory,
capture fisheries could also enhance national food security through macro-economic
contributions to countries’ GDP, for example, through exports or licensing fees paid
by foreign fishing vessels. In practice, the extent to which such contributions translate
into improved nutrition and food security depends on a range of governance and
political factors that vary by country and that are difficult to measure27. SADC region
needs more empirical research in order to evaluate the connections between capture
fisheries and food security through multiple pathways beyond direct consumption of
fish. HLPE, 2014 and Herforth & Harris, 2013 proposed pathways linking fish, food
security and human nutrition as shown in Figure 6.
26 de Graaf, G. and Garibaldi, L. 2014. The Value of African Fisheries. Food and Agriculture Organization of the
United Nations. FAO Fisheries and Aquaculture Circular No. 1093, Rome, Italy.
27 Bennett, Abigail, Pawan Patil, Kristin Kleisner, Doug Rader, John Virdin, and Xavier Basurto. 2018.
Contribution of Fisheries to Food and Nutrition Security: Current Knowledge, Policy, and Research. NI Report 18-
02. Durham, NC: Duke University, http://nicholasinstitute.duke.edu/publication.
26Figure 6: Proposed pathways linking fish, food security and human nutrition, developed
based on HLPE, 2014; with additional dimensions from Herforth & Harris, 2013, revised
by Julia Bruyn 2018.
Specifically Fisheries GDP ranges from 0.2 to 52.4%, depending on the size of the
economies; and fisheries GDP as a percentage of agriculture GDP ranges from 0.2 to
17.7%; also depending on the size of the agriculture sector. Overall it is clear that many
countries in the SADC may not be able to achieve the CAADP target of 6% annual
growth of the agriculture sector, and by the same token, these countries will not be
able to attain the SDG 2 (Zero Hunger) without accounting for the role of fisheries and
aquaculture. Likewise, if SADC as a region, is going to optimize the role of fisheries
and aquaculture in food and nutrition security, there is a need to pay attention to the
SDG 14, by safeguarding the sustainability of its fisheries resources.
27Table 6: Contribution of Fisheries to National Economic Growth (measured as GDP) Country Fisheries & aquaculture as Agric. GDP (%) Fisheries GDP (%) Angola 3 1.7 Botswana 0.16 0.002 DRC 6.31 5.53 Comoros 8 Eswatini 0.094 0.013 Lesotho 0.15 0.021 Madagascar 28 6.7 Malawi 5.87 3.83 Mauritius 3.76 0.19 Mozambique 10 2 Namibia 52.42 6.5 Seychelles 20.68 17.73 South Africa 6.73 0.25 Tanzania 6.8 2 Zambia 8 1.6 Zimbabwe 2.73 0.56 3.3.4 Role of fish trade in food and nutrition security The SADC Protocol on Fisheries urges State Parties (i) to reduce barrier to trade and investment in order to promote regional food security; (ii) to promote trade in fish products and (iii) establish favourable cross-border investment regimes, including compliance with standards on quality control (Article 16). Therefore, the role of fisheries in food and security should not only be considered in terms of the ability of SADC countries being self-sufficient, but also their ability to purchase or import fish products from other countries. Fish and fishery products represent one of the most traded commodities in the world food sector, with about 78% of seafood products estimated to be traded internationally (FAO, 2016). In 2015, world seafood exports totalled US$101 billion, while imports were US$97 billion. SADC countries exported US$2.8 billion and imported US$1 billion worth of seafood in 2015 (ITC, 2015). The 1996 SADC Protocol on Free Trade (SADC, 1996) led to the establishment of a Free Trade Area in 200828 as part of the SADC’s agenda for regional integration and eradication of poverty. The establishment of the Free Trade Area resulted in the signing of free trade agreements among member states that reduced tariffs on 85% of intra- regional imports, leading to increased trade among member states after 2008. Recent data from the FishTrade Program (a collaborative WorldFish-AU-IBAR-NEPAD) has revealed that imports into the SADC countries are either fish or fishery products for direct consumption or raw materials to be processed for domestic consumption of re- export to other SADC countries. 28 http://www.sadc.int/about-sadc/integration-milestones/free-trade-area 28
You can also read