Covid-19 emergency services and disease prediction system
←
→
Page content transcription
If your browser does not render page correctly, please read the page content below
ITM Web of Conferences 40, 03042 (2021)                                                                 https://doi.org/10.1051/itmconf/20214003042
ICACC-2021

     Covid-19 emergency services and disease prediction system
     Shreshtha Mankala1, Nirzara Patil1, Simran Rathore1,and Mrs. Jyoti Joshi2
     1 Department   of Information Technology, Ramrao Adik Institute of Technology, Nerul, India
     2   Mentor from Department of Information Technology, Ramrao Adik Institute of Technology, Nerul, India

                    Abstract- A medical emergency can be referred to as a medical or behavioral condition, which occurs
                    suddenly and has severe symptoms, including severe pain, such that if a person delays medical
                    attention it can cause: (1) loss of life;(2) serious impairment to the person’s body; or (3) serious
                    damage. Admitting a patient to a healthcare is a complex process which should be managed efficiently,
                    which otherwise may cause serious consequences and patient dissatisfaction. The registration aspect
                    of a patient admission is tedious and cumbersome, which is not at all suitable during a medical
                    emergency. There is a need of a system through which user could fill the form for getting admitted to
                    the hospital beforehand in order prevent delay in treatment. After the registration, the goal is to create
                    a web application for hospital staff to manage the patients’ data. The web application also analyses
                    the types of patients in particular hospital and represent the data in the form of charts. The
                    implementation of this system is carried out with the help of machine learning algorithms which also
                    analyze Covid data and represent it continent wise, predict future cases in India, and conduct Covid
                    detection by chest scan of a patient.

     1. Introduction
     A medical emergency can be referred to as a medical or                   number of beds available, and the number of beds occupied
     behavioral condition, which occurs suddenly and has severe               for each hospital will be updated to a web application
     symptoms, including severe pain, such that if a person                   consisting of admin module. So, patient would not get the
     delays medical attention it can cause: (1) loss of life; (2)             option to fill the form for a hospital which has no beds
     serious impairment to the person’s body; or (3) serious and              available. Covid-19 (Coronavirus) has affected the daily life
     permanent damage.[1] Admitting a patient to a healthcare is              and is alleviating country economy as much as a decade
     a complex process which should be managed efficiently,                   worth. This pandemic has affected many people, who are
     which otherwise may cause serious consequences and                       getting sick or get killed , many families are being
     patient dissatisfaction. Also, during an emergency, it is                destroyed. Many people have also lost their livelihood and
     difficult to locate nearby hospitals and get the directions to           jobs. Covid-19 has alleviated businesses, disrupted the
     it. This system consists of a mobile application through                 world trade and movement across the globe.[2]
     which the patients can register themselves and fill a                    Identification of the disease at an early stage can help in
     particular hospital’s admission form beforehand and can                  controlling the spread of the virus as well as for saving a
     also get directions to the selected hospital. There can be a             life. This system uses machine learning algorithms such as
     situation where after reaching the hospital, the patient                 K-means clustering, Polynomial regression, Inception -v3
     comes to know that there is no availability of beds which                for analyzing Covid-19 data, represent it continent wise,
     will lead to delay in the treatment of the patient. Through              and conduct Covid detection through chest scan.
     this system, this confusion will also be avoided as the

  © The Authors, published by EDP Sciences. This is an open access article distributed under the terms of the Creative Commons Attribution License 4.0
  (http://creativecommons.org/licenses/by/4.0/).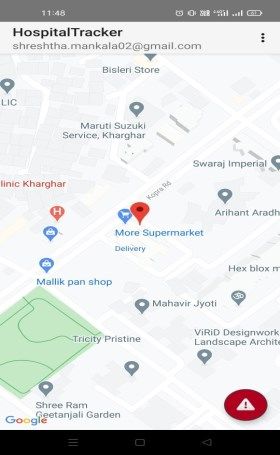
ITM Web of Conferences 40, 03042 (2021)                                                           https://doi.org/10.1051/itmconf/20214003042
ICACC-2021

     2. Motivation                                                         of coronaviruses that can infect human beings. The one
                                                                           which reasons SARS emerged in southern China in 2002
                                                                           and fast unfold to twenty-eight different countries. More
     Though there are computerized systems available for                   than 8,000 humans had been inflamed via way of means of
     booking appointments in hospitals and healthcare and for              July 2003, and 774 died. A small outbreak in 2004 worried
     maintaining records, there is no such existing system                 simplest 4 extra instances. This coronavirus reasons fever,
     available where the patient can view the nearby hospitals             headache, and breathing issues including cough and
     and get admitted to any of them by filling the form                   shortness of breath. MERS commenced in Saudi Arabia in
     previously. Through this system, not only can the patient             2012. Nearly 2500 instances had been of the individuals
     book a bed in advance but can also get the directions to the          who travelled to Middle East. This coronavirus is much less
     hospital. Also, during this Covid-19 situation, it is important       contagious than SARS however extra dangerous, killing
     to manage related data in an efficient manner. Visualization          858 humans. It has the equal breathing effects ,however it
                                                                           can also cause kidney problems. [4]
     of Covid cases, records in the web application part of the
     project will help in the efficient management of the data.
     Also, this application consists of a feature where through            Following papers have been referred for the project:
     images of chest scan of a patient, it can be detected whether
     the patient has Covid which can help the doctors with the             3.1. Regression Analysis of Covid-19 using
     diagnostic and treatment procedures.                                  Machine Learning Algorithms :
                                                                           The trend of Covid cases in India is analysed. The paper
     3. Literature Survey                                                  makes use of regression analysis as the dataset being
                                                                           analysed is continuous dataset. It aims at predicting the
     History of Covid-19:                                                  future Covid cases so as to take preventive measures. The
     The Covid-19 pandemic has caused many Cancellations                   analysis was performed using Support Machine vector and
     like clinical conferences , journey restrictions, social              Polynomial regression both. SVM and Polynomial
     distancing, and different unprecedented preventive steps or           regression both are supervised machine learning algorithms.
     procedures.                                                           The paper also presents charts to visualize death rate, active
     1. What are the Covid causing virus ? Coronaviruses are a             cases, and total confirmed cases. The analysis performed
     huge own circle of relatives of zoonotic viruses. These               raises some questions such as “Why is the mortality rate of
     viruses can motive illnesses like not unusual place bloodless         India lowest as compared to other countries?”.[5]
     to even extreme breathing illnesses like SARS and MERS.
     Zoonotic manner those viruses can transmit themselves                 3.2. A Comprehensive Analysis of Covid-19
     from animals to human beings. There are numerous
                                                                           Outbreak situation in India :
     coronaviruses recognized to be circulating in one of a kind
     animal population which have now no longer but inflamed               In this study, trends and patterns were presented based on
     human beings.[3] Covid-19 is the maximum current one to               data from different state units of India and Ministry of
     contaminate human beings. Common symptoms and
                                                                           Health and Family Welfare. The data was till 8th of April
     symptoms of Covid-19 contamination are similar to cold
     and consist of signs such as dry cough, fever, shortness of           2020. This study tried to answer six questions related to
     breath, and respiration problems. In extreme instances, it            current coronavirus spread in comprehensive manner. The
     causes pneumonia infection, extreme acute breathing                   research questions were regarding        the change in the
     syndrome, kidney failure, or even death.                              country post lockdown, prediction of current cases, mobility
     ➢From where the Coronavirus came into existence?                      changes in various regions of India, community outbreak
     According to the medical experts, SARS-CoV-2 has                      spread due to conduction of religious and cultural events,
     originated in bat species. That’s additionally how the                prominent clusters formed with respect to Covid-19
     coronaviruses at the back of Middle East breathing                    outbreak in India, etc. The findings were mostly related to
     syndrome (MERS) and extreme acute breathing syndrome                  impact of mass events and social distancing on affected
     (SARS) were given commenced. SARS-CoV-2 commenced                     areas, short term predictions for infected cases ,network
     infecting human beings at one of Wuhan’s open-air “moist              analysis and classification on infected patients.[6]
     markets.”
     ➢Coronavirus Evolution: Scientists first found a human
                                                                           3.3. Deep learning-based detection and analysis of
     infecting coronavirus in 1965. It precipitated a not unusual
                                                                           Covid-19 on chest x-ray images :
     place bloodless. Later that decade, researchers discovered a
     collection of comparable human and animal viruses. They               The paper explains how image screening of Chest scans and
     had been named 'coronaviruses' because of their crown-like            CT-scans can help detect Covid patients. An algorithm was
     appearance. It was found that there are at least seven types
                                                                           developed using three different models which were

                                                                       2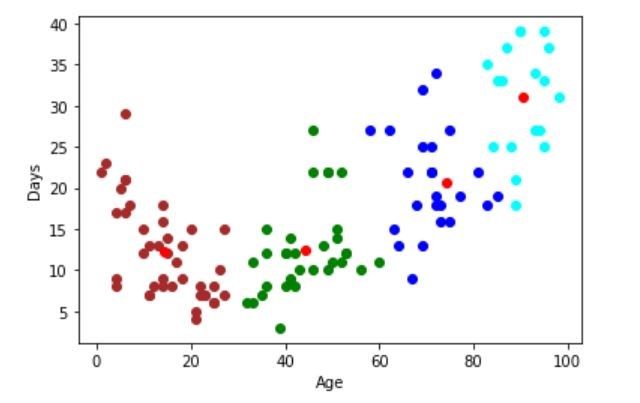
ITM Web of Conferences 40, 03042 (2021)                                                         https://doi.org/10.1051/itmconf/20214003042
ICACC-2021

     Inception, Xception and ResNeXt models. These are Deep              dataset. The data is preprocessed by reshaping and fit into
     learning models which are best known for image                      polynomial feature of degree 5. The data is then fit into a
     recognition. The dataset was collected from Kaggle and had          linear regressor model and the accuracy of the model is
     total of 6432 images. 5467 images were used for training            found out to be 99.765%. The model is presented as a flask
     and 965 for testing. The images were cleaned, resized and           app which uses Html CSS and JavaScript and the result is
     augmented for better results. Augmentation includes                 rendered on the web app hosted on Heroku.
     rotation, zoom size and some other factors. This paper has                     y= b0+b1x1+ b2x12+ b2x13+...... bnx1n (1)
     presented steps in which the detection can be done. First the           The deep learning algorithm Inception-v3 is used to train
     image is preprocessed, then it is applied to a pretrained           a model on ImageNet using Keras module.[10,11] The
     model and the output obtained is flattened to (n-1) and then        images were changed from BGR to RGB for better
     passed through different layers depending on the model              modelling. Normalization was formed so as to avoid
     used. The accuracy of Xception model was found to be                overfitting. Then the data was split into training and testing
     better than other two. [7]                                          data for Covid and Non-Covid chest scans .Label binarizer
                                                                         was used to convert the results into form of 0’s and
                                                                         1’s.Finally the Inception-v3 model is applied on the
     4. Proposed System                                                  prepared data, model is compiled using Adam optimizer.
                                                                         Image data generator is used to change the rotations and
     The proposed system consists of following modules:                  make all the images even. The model is built and now the
     1. Mobile Application for patient to search for bed and get         model is trained by fitting with a batch size of 32 and epochs
     admitted in the nearest hospital in case of emergency.[8]           of 500.The model is then saved in a .h5 format and then used
      2. A web application for hospital staff to manage the              to make predictions.
     patients’ data generated from the mobile application. The
     web application also analyses the types of patients in
     particular hospital and represent the data in the form of
     charts.[9]
     3. A Machine learning algorithm run on the backend of the
     web app which analyses the Covid data around the world
     and represents it continent wise. It also retrieves and
     analyses the current Covid cases in India from Jan 2020 to
     March 2021.
     4. Another Machine Learning Web app is used to predict the
     cases of India in the future.
     5. And lastly a web-based Machine Learning app is used for
                                                                                         Fig 1. Block diagram of mobile app
     Covid detection from a patient’s Chest scan.
                                                                             The mobile app is connected to the Firebase. Firebase
         The mobile app is made using android studio and
                                                                         provides various services including registering a new
     firebase for taking user details and symptoms. The user can
                                                                         account via email and password using Firebase
     send emergency message to contact and make emergency
                                                                         authentication service or login into an existing account
     call to helpline number. The web application is made using
                                                                         using the same. It also provides a real time database for
     Vue.js and Vuetify. The user data is passed to the web app
                                                                         storing retrieval f user data. The main page of app displays
     through firebase. The web app consists of different graphs
                                                                         a map with current location of user and markers for hospitals
     representing total available beds and total occupied beds.
                                                                         nearby along with an emergency button. Emergency button
     The graph is displayed continent wise for total cases,
                                                                         is used to call the nearest helpline number and send SMS to
     recoveries, and deaths from a real time API.
                                                                         user’s personal contacts which can be set by user. Select
                                                                         hospital provides two services, uploading a photo from
         The Covid patients data is clustered using k-means
                                                                         phone or clicking a picture in app as well as a patient form
     algorithm based on the number of days they require to
                                                                         which is submitted to the selected hospital and uploaded to
     discharge and age , which is used to determine the average
                                                                         the firebase database. Firebase Database is further
     number of days required to get discharged with respect to
                                                                         connected to the web app.
     age. The number of clusters ‘k’ which is a hyper parameter
     is defined as 4 and the centroids were chosen accordingly.
     The data points have been clustered on the basis of squared
     distance between them.

        The confirmed cases in India per day are put under
     polynomial regression model to determine the confirmed
     cases for near future days. The data is collected from Kaggle

                                                                     3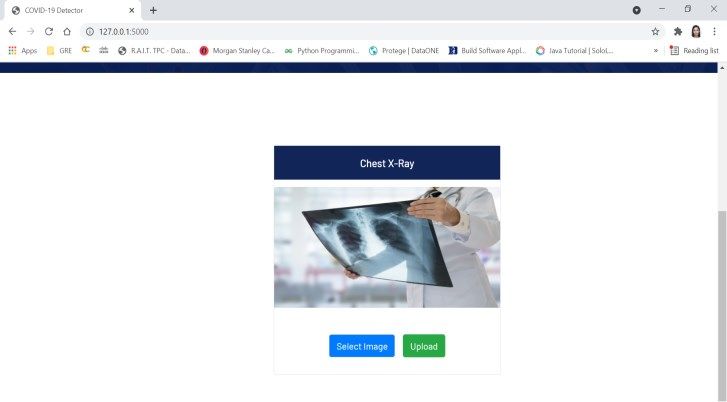
ITM Web of Conferences 40, 03042 (2021)                                                        https://doi.org/10.1051/itmconf/20214003042
ICACC-2021

                      Fig 2. Block diagram of web app

         The web app is connected to the Firebase like the mobile
     app. Firebase provides login into an existing staff account                              Fig 3. Login page
     via email and password using Firebase authentication
     service. It also provides a real-time database for storing         This is the first page that is displayed to the user on the
     retrieval of user data. The admin or the hospital staff can        application. The user can login or else the user can click on
     handle multiple functionalities such as CRUD operations,           register button if he is first time user.
     Analysis and graphs, Covid cases prediction and Covid
     Detection system. Data generated by user from the mobile
     app can be or created, retrieved, updated, deleted using the
     web app. Analysis is done in the same data and represented
     in the form of graphs and charts. Covid Prediction system is
     Machine learning system which uses Polynomial regression
     to predict the Covid cases in the future. Finally Covid
     detection system is a Machine learning system which
     analyses the Chest can of patient and detects the existence
     of Covid-19 virus and generates a report.

     5. Results
     We have created an android app which can be used by the
     patient to get admitted to a nearby hospital by filling an
     application form. The user can also inform his emergency
     contacts and make an emergency call using the app in case                             Fig 4. Registration page
     of emergency. The app also shows the fastest route to the
     selected hospital using google map api. The number of              The user can register using a valid email id and password.
     available beds can be seen for any hospital.

         The records of patients can be accessed using the web
     app by the admin. The web app shows many graphs relating
     to Covid updates such as everyday cases, deaths, ICU
     patients using live data from api. Through web app admin
     can change the status of patient from admitted to discharge
     or just to admit the patient. The number of available beds
     can also be updated.

         In the web app we can see the clusters of Covid patients
     (as shown in fig. 10) to determine the average number of
     days required to discharge in association to age.[12] The
     web app can also predict number of confirmed cases of India
     for any day in the near future. The model has an accuracy of
     99.65%. The web app can also analyze a chest scan to detect
     if a person is suffering through Covid-19 using Inceptionv3                                Fig 5. Maps
     and deep learning and the results will be displayed.

                                                                    4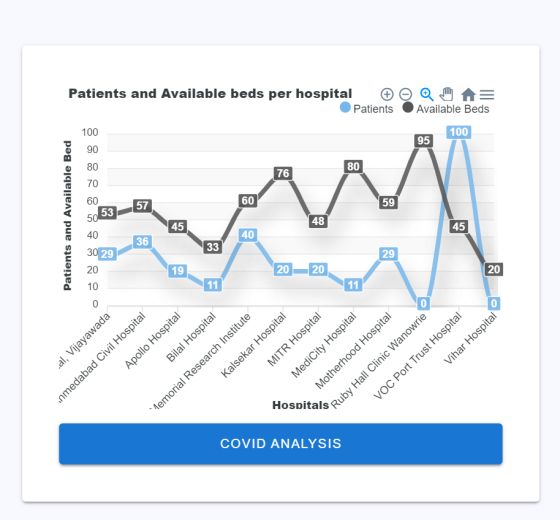
ITM Web of Conferences 40, 03042 (2021)                                                        https://doi.org/10.1051/itmconf/20214003042
ICACC-2021

     As soon as the user logins the google maps are displayed           Web app login for admin, uses email id and password as
     indicating the user’s current location and the nearby              credentials.
     hospitals. The user can select one of the hospitals.

            Fig 6. Add emergency contacts from phonebook .                           Fig 9. Graph for hospital occupancy

     The emergency contacts can also be added.                          The graph shows the available and occupied number of beds
                                                                        hospital-wise.

                                                                                           Fig10. Clustering graph

                                                                        This graph shows clustering of patient data that depicts the
                        Fig 7. Application form
                                                                        average number of days required to discharge from the
     The user needs to fill the form and upload his image or take       hospital with respect to age. X-axis depicts the patients age
     it using the camera hardware. The user then submits the            and Y-axis depicts the number of days required by different
     application form and is redirected to the maps.                    patients to fully recover. The bright red dot represents the
                                                                        average number of days to recover. This visualization can
                                                                        help the hospital management to plan accordingly and
                                                                        monitor the patients recovery. It also gives insight if the
                                                                        number of beds should be increased if the recovery time has
                                                                        increased, making the bed availability scarce.

                          Fig 8.Admin login

                                                                    5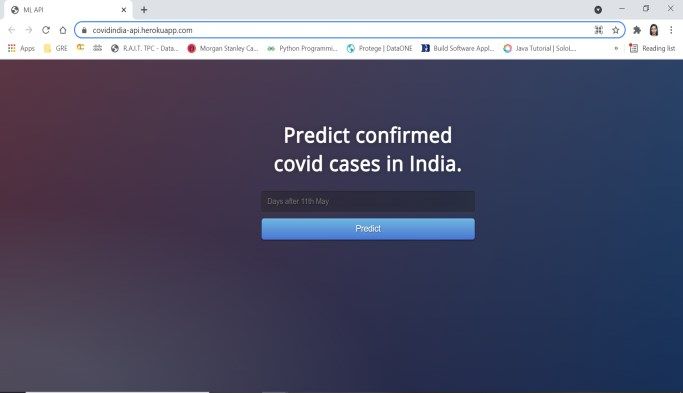
ITM Web of Conferences 40, 03042 (2021) https://doi.org/10.1051/itmconf/20214003042
ICACC-2021
Fig 14. Covid cases predictor
Fig 11. Hospital list
Type the number of days and get an estimation of total
This is the list of names of hospital that have registered confirmed cases of India after that many days.
in the app and can be seen by users for getting admitted.
Fig 15.Chest scan analyzer
Fig 12. Records of patients The chest scan is to be uploaded by selecting an image
from the system so as to make a decision if a patient is
The records of patients of a particular hospital which also
suffering from Covid or not.
shows a pi chart for different disease count and male female pi
chart. The records can be added, deleted, and updated.
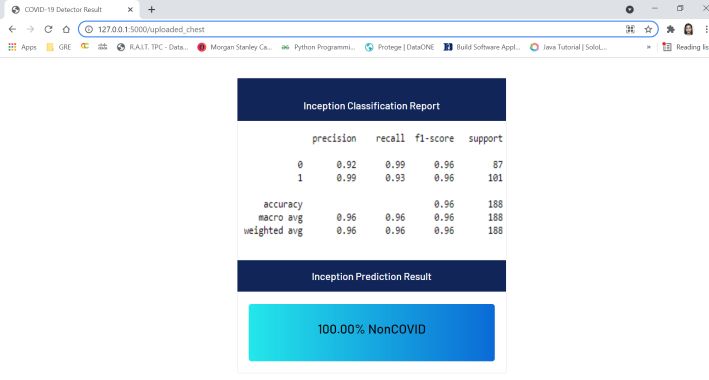
Fig 16. Chest scan result
The result or report of the scan is shown to decide if the
Fig 13. Covid dashboard patient is suffering from Covid or not. The accuracy of
model is 96% as shown in Fig16. The Inception-v3 model
The total cases, recovered, and deaths for different uses 500 epochs and 32 batch size for getting best accuracy.
continents can be seen and other graphs such as daily cases,
everyday deaths, recovered, ICU patients for India can be
seen.
6
ITM Web of Conferences 40, 03042 (2021) https://doi.org/10.1051/itmconf/20214003042
ICACC-2021
professionals for any practical use case of this project. We
do not intend to develop a perfect detection mechanism but
only research about possible economically feasible ways to
combat this disease. Such methods may be pursued for
further research to prove their real case implementation.[7]
7. Future Scope
Currently the user has to provide login credentials in order
to use the app or if the account does not exist the user has to
register and then login. We can create a functionality where
user can login using his/her google account. Secondly, we
can also display the hospitals based on the emergency. For
example, if the patient has a heart attack, then all the heart
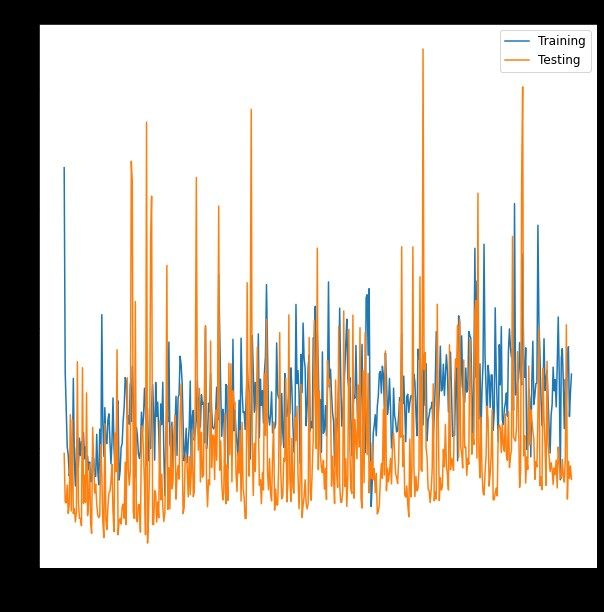
Fig 17. Model Loss care hospitals with their location will be suggested.
Fig 17 depicts the loss of Inception-v3 model during the
training and testing phase. The loss in the testing data has 8. References
declined significantly towards the 500th epoch as compared
1. https://www.columbiaindiahospitals.com/health-
to the training data. The maximum loss observed is
articles/medical-emergency-vs-urgent-care-medical-
approximately 4% during the training phase and less than
conditions
3% during the testing phase, achieving the best results.
2. Mokter Hossain, The effect of the Covid-19 on sharing
economy activities, (2020)
3. Dr.Ramesha.T ,Effect of COVID-19 and Historical
Background – An Overview 7 , Issue 4 (2020)
4. https://www.webmd.com/lung/coronavirus-history
5. Ekta Gambhir, Ritika Jain, Alankrit Gupta, Uma Tomer,
Regression Analysis of COVID-19 using Machine Learning
Algorithms, CFP20V90-ART; ISBN: 978-1-7281-5461-9
(2020)
6. Rajan Gupta, Saibal K. Pal and Gaurav Pandey, A
Comprehensive Analysis of COVID-19 Outbreak situation
in India (2020)
7. Rachna Jain, Meenu Gupta, Soham Taneja, Jude
Hemanth D, Deep learning-based detection and analysis of
COVID-19 on chest X-ray images(2020)
Fig 18. Model Accuracy 8. https://localpress.co.in/mumbai/doctor-launches-hero-
app-help-people-locate-hospital-beds-mumbai/
Fig 18 depicts the accuracy of Inception-v3 model during 9. Jürgen Stausberg, Priv-Doz Dr med, Dietrich Koch, Josef
the training and testing phase. The model achieved the Ingenerf, Dr Rer Nat, and Michael Betzler, Prof Dr Med,
accuracy of 96% and got stable results while close to 500 Comparing Paper-based with Electronic Patient Records:
epochs. X-axis shows number of epochs and Y-axis Lessons Learned during a Study on Diagnosis and
represents the accuracy metrics. Procedure Codes, 10(5): 470–477 (2003)
10. Jia Deng; Wei Dong; Richard Socher; Li-Jia Li; Kai
Li; Li Fei-Fei, ImageNet: A large-scale hierarchical image
6. Conclusion database (2009)
Covid-19 pandemic is a growing exponentially daily. With 11. Alex Krizhevsky, Ilya Subserve, Geoffrey E. Hinton,
the ever-increasing number of cases, bulk testing of cases ImageNet Classification with Deep Convolutional Neural
swiftly may be required. We have successfully categorized Networks (2012).
covid-19 scans, and it encourages the possible 12. Wenjing Ye Weiwei Lu, Yanping Tang, Identification
implementation of such techniques in the near future to of COVID-19 Clinical Phenotypes by Principal
automate diagnosis tasks. It is advised to consult medical Component Analysis-Based Cluster Analysis. (2020)
7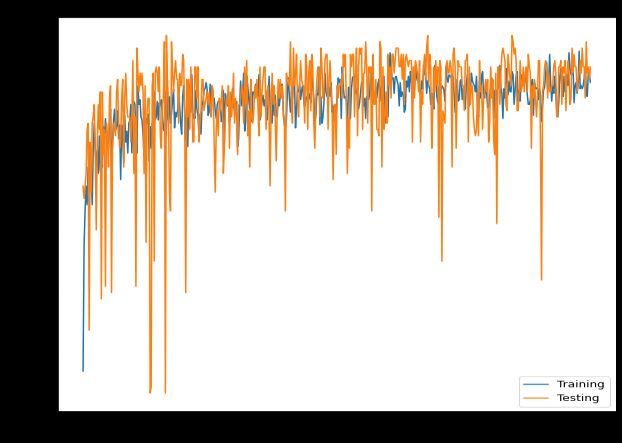

You can also read