DEMAND ANALYSIS Transportation Pathways 2021 - Minnesota State Transportation Center of ...
←
→
Page content transcription
If your browser does not render page correctly, please read the page content below
DEMAND
ANALYSIS
Transportation Pathways
2021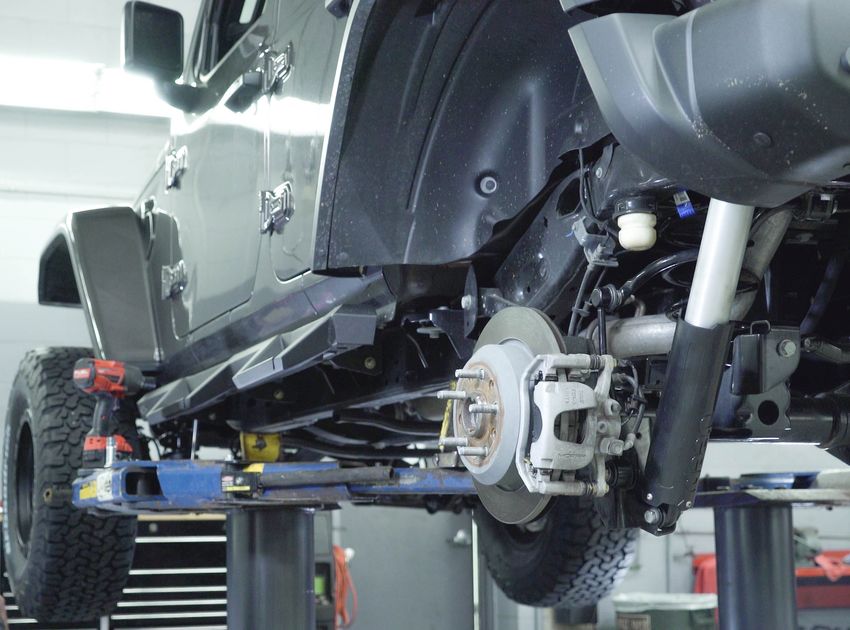
Developed for the Minnesota State
Transportation Center of Excellence
        by RealTime Talent

          January 2022
Introduction
This report is the second annual in a series developed by RealTime Talent to highlight the labor market supply and
demand in critical career pathways of Transportation. These insights are intended to provide a snapshot of the
market demand for talent in these pathways as of the second quarter of 2021 and provide guidance for education
and training programs for development of talent with the necessary skills and certifications to meet the needs of
Minnesota employers.

The six pathways shown here divide up the critical transportation function occupations in-demand in Minnesota.

                                               Transportation Pathways in Minnesota – Baseline Forecast, 2021Q21

                                                              Current                                5-Year History                     5-Year Baseline Forecast
                                                Avg Ann                     Unempl      Online     Empl                   Total                               Empl    Ann %
Occupation                           Empl       Wages2     LQ     Unempl     Rate      Job Ads3   Change      Ann %      Demand       Exits     Transfers    Growth   Growth

Automotive Technology Pathway       21,614      $61,300    1.03    753       3.4%       1,263       163        0.2%        8,991      2,619         6,697     -324    -0.3%

Aviation Pathway*                    8,773      $122,300   0.88    346       3.9%        210       -674        -1.5%       3,844      1,121         2,688      35      0.1%

Collision Repair Pathway             6,864      $46,900    1.14    324       4.6%        376       -307        -0.9%       3,524      1,042         2,480      2       0.0%
Diesel Equipment and Truck
                                    12,889      $56,000    1.20    344       2.7%        487       -451        -0.7%       6,292      1,919         4,383     -10      0.0%
Pathway
Marine and Power Sports
                                     5,181      $41,900    1.07    373       6.8%        58         80         0.3%        3,109       963          2,131      15      0.1%
Pathway
Truck Driving Pathway               95,261      $44,600    0.96    6,493     6.60%      8,796      -843        -0.2%      57,082     22,543         33,247   1,293     0.3%
Transportation Occupations          147,533     $51,600    0.99    8,573     5.6%      11,284      -1,891      -0.3%      81,732     29,859         50,858   1,015     0.1%

Total - All Occupations            2,920,850    $58,900    1.00   145,886    4.9%      181,745    -83,089      -0.6%     1,672,986   625,772   1,016,164     31,051    0.2%
*This pathway includes Drone Technology careers as of 2021, which were not included in the 2020 estimates of career pathway employment or demand.

If you have questions about the content provided in this report, please contact Erin Olson, Director of Strategic
Research for RealTime Talent at erin@realtimetalentmn.org.

Minnesota’s Industries
The largest industry in Minnesota is Health Care and Social Assistance, employing 500,877 workers. The next-largest
sectors in the region are Manufacturing (313,617 workers) and Retail Trade (295,879). High location quotients (LQs)
indicate industries in which a region has high concentrations of employment compared to the national average. The
industries with the largest LQs in the region are Management of Companies and Enterprises (LQ = 1.95),
Manufacturing (1.31), and Finance and Insurance (1.23). Minnesota industries with the highest average wages per
worker are Management of Companies and Enterprises ($138,792), Utilities ($119,646), and Finance and Insurance
($119,347). Industries with the best job growth (or most moderate job losses) over the last 5 years are Health Care
and Social Assistance (+18,816 jobs), Management of Companies and Enterprises (+8,997), and Construction
(+8,673).

Over the next 5 years, employment in Minnesota is projected to expand by 31,075 jobs in a baseline, pessimistic
forecast. The fastest growing sector in the region is expected to be Health Care and Social Assistance with a +1.1%
year-over-year rate of growth. The strongest forecast by number of jobs over this period is expected for Health Care
and Social Assistance (+29,001 jobs), Professional, Scientific, and Technical Services (+6,684), and Accommodation
and Food Services (+4,233). Transportation and Warehousing, which currently employs about 117,118 people in
Minnesota, is forecast to grow by an average of 0.2% annually (the same forecast as estimated in 2020) adding about
1,155 people in a low-growth, tight labor market forecast over the next five years.

Source: RealTime Talent analysis of Chmura Economics JobsEQ®, http://www.chmuraecon.com/jobseq
                                                                                                                                                                         1
Employment data are derived from the Quarterly Census of Employment and Wages, provided by the Bureau of Labor Statistics and imputed where necessary. Data are updated through 2021Q1 with preliminary
estimates updated to 2021Q2.

                                                                                        Minnesota, 2021Q21
                                                                  Current                           5-Year History                                         5-Year Forecast
                                                                Avg Ann                          Empl                           Total                                           Empl           Ann %
NAICS                   Industry                   Empl          Wages             LQ           Change          Ann %          Demand            Exits        Transfers        Growth          Growth
   62    Health Care and Social Assistance        500,877       $56,775           1.16          18,816           0.8%          270,888         118,937         122,950          29,001           1.1%
   31    Manufacturing                            313,617       $71,227           1.31           -9,676          -0.6%         152,873          59,415         101,737          -8,278          -0.5%
   44    Retail Trade                             295,879       $34,490           0.97          -13,954          -0.9%         188,588          86,265         108,996          -6,673          -0.5%
   61    Educational Services                     219,143       $55,484           0.93           -8,573          -0.8%         105,197          49,015          52,888          3,293            0.3%
         Accommodation and Food
   72                                             183,038       $20,919           0.82          -47,213          -4.5%         153,655          66,131          83,291          4,233            0.5%
         Services
         Professional, Scientific, and
   54                                             174,921       $99,046           0.84           2,910           0.3%           82,630          28,203          47,742          6,684            0.8%
         Technical Services
   23    Construction                             156,424       $69,711           0.90           8,673           1.1%           78,413          27,588          49,360          1,466            0.2%
   52    Finance and Insurance                    150,503      $119,347           1.23           7,088           1.0%           69,612          26,492          43,491           -371            0.0%
         Administrative and Support and
   56    Waste Management and                     134,279       $47,264           0.72          -11,796          -1.7%          80,537          32,999          45,013          2,525            0.4%
         Remediation Services
   92    Public Administration                    131,233       $64,881           0.91           3,104           0.5%           59,230          25,385          34,541           -696           -0.1%
   42    Wholesale Trade                          126,517       $91,479           1.14           -8,346          -1.3%          63,481          24,759          41,033          -2,311          -0.4%
         Other Services (except Public
   81                                             126,495       $35,084           1.00          -10,178          -1.5%          74,619          33,072          39,482          2,065            0.3%
         Administration)
         Transportation and
   48                                             117,118       $55,509           0.81           4,843           0.8%           63,725          26,589          35,981          1,155            0.2%
         Warehousing
         Management of Companies and
   55                                             86,686       $138,792           1.95           8,997           2.2%           40,566          14,517          24,777          1,271            0.3%
         Enterprises
         Agriculture, Forestry, Fishing and
   11                                             50,519        $52,422           1.23           -2,068          -0.8%          24,180          11,360          15,321          -2,501          -1.0%
         Hunting
   51    Information                              47,949        $91,234           0.83           -9,120          -3.4%          21,695           8,233          14,599          -1,137          -0.5%
         Arts, Entertainment, and
   71                                             45,907        $42,248           0.98          -12,379          -4.7%          34,230          14,637          18,079          1,514            0.7%
         Recreation
         Real Estate and Rental and
   53                                             40,921        $61,147           0.80           -3,304          -1.5%          19,943           9,336          11,182           -575           -0.3%
         Leasing
   22    Utilities                                13,328       $119,646           0.86            -837           -1.2%           4,757           2,092          3,686           -1,021          -1.6%
         Mining, Quarrying, and Oil and
   21                                              5,493        $89,314           0.55            -78            -0.3%           2,968            920           1,910            138             0.5%
         Gas Extraction
   99    Unclassified                                1          $54,290           0.00             1              n/a              1               0               0               0             0.6%
         Total - All Industries                  2,920,850      $64,321           1.00          -83,089          -0.6%        1,628,547        682,768         914,704          31,075           0.2%
Employment data are derived from the Quarterly Census of Employment and Wages, provided by the Bureau of Labor Statistics and imputed where necessary. Data are updated through 2021Q1
with preliminary estimates updated to 2021Q2. Forecast employment growth uses national projections adapted for regional growth patterns.

Source: RealTime Talent analysis of Chmura Economics JobsEQ®, http://www.chmuraecon.com/jobseq
                                                                                                                                                                                                        2
Industry/Occupation Mix
Transportation function roles are found among General Freight Trucking companies (10.8% of total transportation
function employment), Automotive Repair and Maintenance (6.7%), and School and Employee Bus Transportation
(5.1%). The importance in particular of Diesel Engine and Truck Driver talent is evident in this initial look at the top
industries of employment for transportation talent. However, all industries rely to some degree on transportation
talent in their workforce.

Source: RealTime Talent analysis of Chmura Economics JobsEQ®, http://www.chmuraecon.com/jobseq
                                                                                                                           3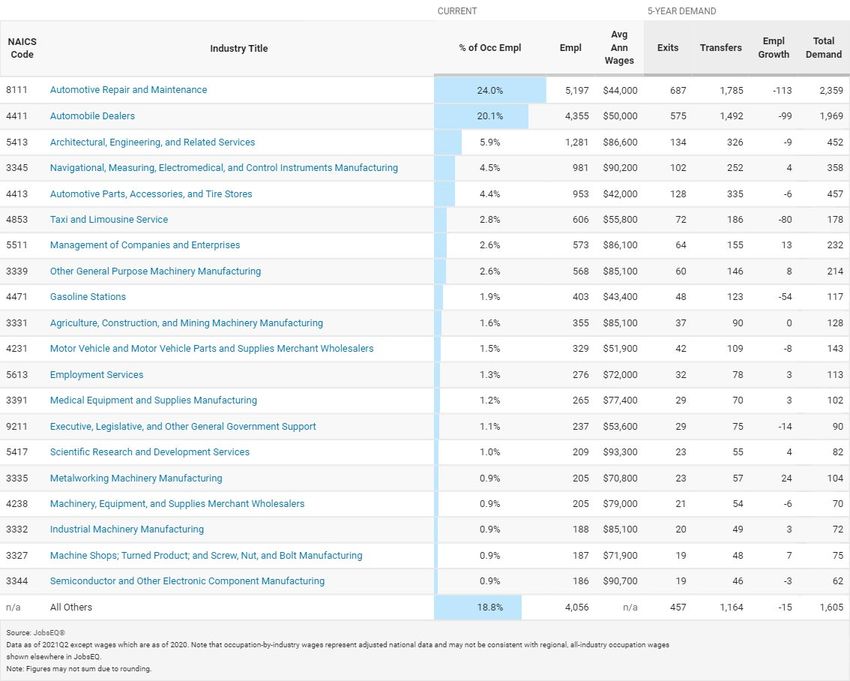
Top Industries of Employment for Transportation Occupations in Minnesota, 2021Q2

Source: RealTime Talent analysis of Chmura Economics JobsEQ®, http://www.chmuraecon.com/jobseq
                                                                                                         4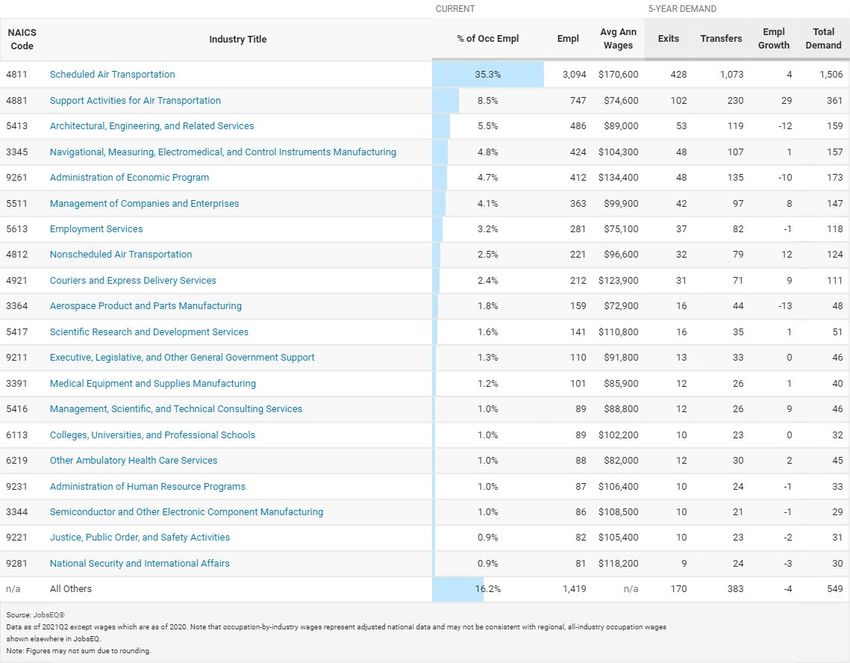
AUTOMOTIVE
TECHNOLOGY
     Demand Analysis
               2021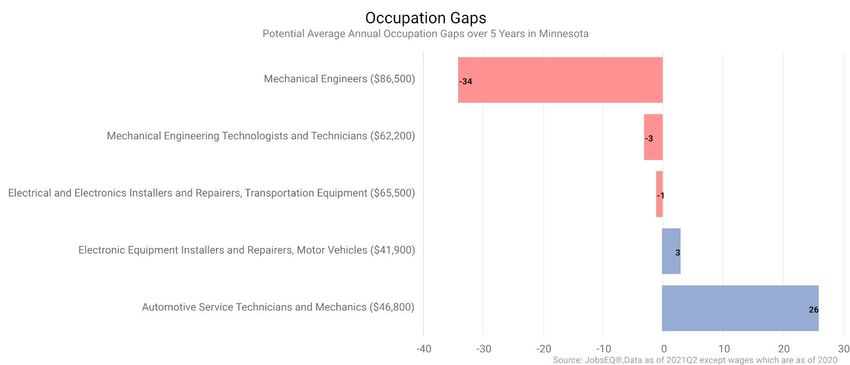
Introduction and Sector Overview ................................................................................................................... 2
Industry/Occupation Mix ................................................................................................................................4
Pathway Detail ...............................................................................................................................................4
Employment Types ........................................................................................................................................ 7
Job Posting Trends ........................................................................................................................................ 7
   Top Employers by Volume of New Job Postings in 2021, With Change from Prior Year .............................................. 8
   Top Skills by Volume of New Job Postings, With Change from Prior Year .................................................................... 8
   Top Knowledge Areas, Tools, and Tech by Volume of New Job Postings, With Change from Prior Year ..................... 8
   Top Certifications by Volume of New Job Postings, With Change from Prior Year ...................................................... 9

                                                                                                                                                           1
Introduction and Sector Overview
This report highlights the importance of the Automotive Technology career pathway for Minnesota’s Transportation
Industry. Professionals in Automotive Technology work in diverse roles from automotive service technicians to farm
equipment mechanics, serving industries as diverse as Navigational Manufacturing and Automobile Dealerships. In
all, about 21,614 people work in Automotive Technology roles in Minnesota as of the second quarter of 2021—a -
1.6% decrease (345 workers) from a year prior.

Overall employment in Minnesota has declined by nearly -92,000 workers (-3.1%) between the second quarter of
2020 and 2021, and the five-year forecast dropped from 49,053 expansion of employment over five years to just
31,051 from 2021 through 2026 as of the most current baseline forecasts, or about 0.2% average annual growth. An
optimistic forecast assuming reduction in labor force exits, economic conditions improving, and lessening impacts of
COVID-19 on key industries forecasts up to 1.2% average annual growth over the next five years, or a total of 172,340
people newly employed by 2026. During this time frame, Automotive Technology employment is anticipated to drop
moderately in Minnesota by about -324 total jobs (-0.3% annually) due to a tight talent pool, but could grow by about
431 (0.4% annually) in an optimistic forecast model. Total baseline demand for Automotive Technology talent is
anticipated to be around 8,991 professionals needed to fill positions due to job exits and transfers, such as
retirements and job changes.

                                                        Transportation Pathways in Minnesota – Baseline Forecast, 2021Q21

                                                                            Current                                           5-Year History                             5-Year Baseline Forecast
                                                          Avg Ann                              Unempl        Online        Empl                         Total                                      Empl        Ann %
 Occupation                                   Empl        Wages2         LQ      Unempl         Rate        Job Ads3      Change         Ann %         Demand          Exits       Transfers      Growth       Growth

 Automotive Technology Pathway               21,614        $61,300      1.03        753         3.4%          1,263         163           0.2%           8,991         2,619         6,697          -324         -0.3%

 Aviation Pathway*                            8,773       $122,300      0.88        346         3.9%           210          -674          -1.5%          3,844         1,121         2,688           35          0.1%

 Collision Repair Pathway                     6,864        $46,900      1.14        324         4.6%           376          -307          -0.9%          3,524         1,042         2,480            2          0.0%
 Diesel Equipment and Truck
                                             12,889        $56,000      1.20        344         2.7%           487          -451          -0.7%          6,292         1,919         4,383           -10         0.0%
 Pathway
 Marine and Power Sports
                                              5,181        $41,900      1.07        373         6.8%           58            80           0.3%           3,109          963          2,131           15          0.1%
 Pathway
 Truck Driving Pathway                       95,261        $44,600      0.96       6,493        6.60%         8,796         -843          -0.2%         57,082        22,543        33,247         1,293         0.3%
 Transportation Occupations                 147,533        $51,600      0.99       8,573        5.6%         11,284        -1,891         -0.3%         81,732        29,859        50,858         1,015         0.1%

 Total - All Occupations                   2,920,850       $58,900      1.00     145,886        4.9%        181,745       -83,089         -0.6%       1,672,986      625,772      1,016,164       31,051         0.2%
*This pathway includes Drone Technology careers as of 2021, which were not included in the 2020 estimates of career pathway employment or demand.

Source: JobsEQ®
Data as of 2021Q2 unless noted otherwise
Note: Figures may not sum due to rounding.
1. Data based on a four-quarter moving average unless noted otherwise.
2. Wage data are as of 2020 and represent the average for all Covered Employment
3. Data represent found online ads active within the last thirty days in the selected region; data represents a sampling rather than the complete universe of postings. Ads lacking zip code information but designating a
place (city, town, etc.) may be assigned to the zip code with greatest employment in that place for queries in this analytic. Due to alternative county-assignment algorithms, ad counts in this analytic may not match
that shown in RTI (nor in the popup window ad list).

Source: RealTime Talent analysis of Chmura Economics JobsEQ®, http://www.chmuraecon.com/jobseq/. Job Posting Trends section uses data from Gartner TalentNeuron Plan, accessed
1/10/2022 at talentneuronplan.gartner.com                                                                                                                                 2
As Minnesota’s economy continues to sustain loss of workers due to the pandemic and overall talent shortage, and
with unknown ongoing impacts of the COVID-19 pandemic on our economy and public health, employment forecasts
are changing rapidly. Supply chain impacts, the drive to automation and technological innovation mean that the
transportation industry, in particular, may look very different in five years from what it looks like today. The
componding impacts of a tight labor market prior to the start of the pandemic and significant, rapid layoffs of non-
essential workers across service industry positions creates a complex landscape of employer demand and an
available workforce. Forecasting future needs under current conditions with an eye to anticipated talent pipelines
into Automotive Technology suggest that there may be shortages of talent across a large share of occupations in this
career pathway unless more talent decides to enter the field. The pathway forecast has soured since estimates in late
2020, with a baseline forecast of about -0.3% decline in overall employment by the second quarter of 2026.

                        Automotive Technology Employment Forecast Under Baseline Scenario, Minnesota

Source: RealTime Talent analysis of Chmura Economics JobsEQ®, http://www.chmuraecon.com/jobseq/. Job Posting Trends section uses data from Gartner TalentNeuron Plan, accessed
1/10/2022 at talentneuronplan.gartner.com                                                                                                                                 3
Industry/Occupation Mix
Automotive Technology talent is primarily concentrated in the Automotive Repair and Maintenance industry (24.0%),
increasing in its concentration from estimates in 2020 by 1.5 percentage points. The next highest industry of
employment concentration is Automobile Dealers (20.1%), but are important across a wide range of transportation,
manufacturing, and agriculture sub-industries.
Top Industry Distribution for Automotive Technology Pathway Occupations in Minnesota
Pathway Detail
Of all occupations found in the Automotive Technology pathway, the specific occupations of Mechanical Engineers
and Mechanical Engineering Technicians are uniquely concentrated in Minnesota to a higher degree than seen in the
nation overall. On average, Automotive Technology careers pay about $61,300 per year (up from $60,100 last year)—
about $2,600 higher than the average wage statewide across all positions.
Source: RealTime Talent analysis of Chmura Economics JobsEQ®, http://www.chmuraecon.com/jobseq/. Job Posting Trends section uses data from Gartner TalentNeuron Plan, accessed
1/10/2022 at talentneuronplan.gartner.com 4Automotive Technology Pathway in Minnesota - COVID, 2021Q21
Current 1-Year History 5-Year Baseline Forecast
Avg Ann Unempl Online Job Empl Total Empl Ann %
SOC Occupation Empl Wages2 LQ Unempl Rate Ads3 Change Ann % Demand Exits Transfers Growth Growth
Automotive Service Technicians and
49-3023 13,151 $46,800 0.94 529 3.9% 817 -206 -1.5% 5,862 1,730 4,486 -354 -0.5%
Mechanics
17-2141 Mechanical Engineers 7,013 $88,300 1.20 174 2.5% 405 -52 -0.7% 2,446 670 1,727 50 0.1%
Mechanical Engineering
17-3027 1,122 $63,400 1.36 35 3.2% 12 -28 -2.4% 544 185 359 0 0.0%
Technologists and Technicians
Electronic Equipment Installers and
49-2096 178 $43,900 0.95 9 5.1% 12 -19 -9.4% 75 21 73 -19 -2.2%
Repairers, Motor Vehicles
Electrical and Electronics Installers
49-2093 and Repairers, Transportation 150 $70,100 0.80 6 3.6% 17 -19 -11.3% 63 13 52 -1 -0.2%
Equipment
Automotive Technology Pathway 21,614 $61,300 1.03 753 3.4% 1,263 -324 -1.5% 8,991 2,619 6,697 -324 -0.3%
Total - All Occupations 2,920,850 $58,900 1.00 145,886 4.9% 181,745 -91,909 -3.1% 1,672,986 625,772 1,016,164 31,051 0.2%
Source: JobsEQ®
Data as of 2021Q2 unless noted otherwise
Note: Figures may not sum due to rounding.
1. Data based on a four-quarter moving average unless noted otherwise.
2. Wage data are as of 2010 and represent the average for all Covered Employment
3. Data represent found online ads active within the last thirty days in the selected region; data represents a sampling rather than the complete universe of postings. Ads lacking zip code information but designating a
place (city, town, etc.) may be assigned to the zip code with greatest employment in that place for queries in this analytic. Due to alternative county-assignment algorithms, ad counts in this analytic may not match
that shown in RTI (nor in the popup window ad list).
By 2026, it is likely that Minnesota will see a growing shortage of Mechanical Engineers and Mechanical Engineering
Technologists and Technicians (shown in red below). The estimated annual shortage of Mechanical Engineers,
Mechanical Engineering Techs, and Electrical and Electronics Equipment Installers and Repairers have worsened since
2020 estimates.
Estimated Occupation Gaps over Five Years in Minnesota
Looking out the next ten years, three occupations in the Automotive Technology pathway are anticipated to
experience talent shortages. The shortage of Mechanical Engineers and Mechanical Engineering Techs have
Source: RealTime Talent analysis of Chmura Economics JobsEQ®, http://www.chmuraecon.com/jobseq/. Job Posting Trends section uses data from Gartner TalentNeuron Plan, accessed
1/10/2022 at talentneuronplan.gartner.com 5worsened from estimates in 2020, while shortages of Automotive Service Technicians at the statewide level have
been reduced to zero.
Estimated Occupation Gaps over Ten Years in Minnesota

Source: RealTime Talent analysis of Chmura Economics JobsEQ®, http://www.chmuraecon.com/jobseq/. Job Posting Trends section uses data from Gartner TalentNeuron Plan, accessed
1/10/2022 at talentneuronplan.gartner.com                                                                                                                                 6
Employment Types
About 90% of people employed in Automotive Technology in Minnesota work for private employers, while an
estimated 6% are self-employed (a slight decrease from 2020). The remaining 4% work for state, federal, or local
government entities.
Employment Types, Minnesota 2021Q2
Government Self Employment
4% 6%
Private
90%
Self Employment Private Government
Job Posting Trends
Data in this section focuses on jobs newly advertised between January 1 and December 31, 2021 in Automotive
Technology roles across Minnesota. All data in this section comes from Gartner TalentNeuron. Overall, there were
4,699 new jobs advertised in Automotive Technology during this time frame, an increase of 64% from the prior 12-
month period (2020). Volume of posted positions advertised by staffing and temp agencies in the Automotive
Technology pathway increased dramatically in 2021 compared to 2020, implying dramatic increases in challenges
finding talent in this career pathway and direct employers resorting to using new strategies to find talent.
Volume of Career Pathway Online Job Postings in 2020 and 2021
Source: RealTime Talent analysis of Chmura Economics JobsEQ®, http://www.chmuraecon.com/jobseq/. Job Posting Trends section uses data from Gartner TalentNeuron Plan, accessed
1/10/2022 at talentneuronplan.gartner.com 7Top Employers by Volume of New Job Postings in 2021, With Change from Prior Year
Percent Change
Employer between 2020 and 2021
1. Lube-Tech Services, LLC 0%
2. Honeywell 231%
3. 3M 171%
4. Aerotek 61%
5. Medtronic 95%
6. Actalent 0%
7. Polaris 67%
8. TraneTech 406%
9. Xcel Energy 158%
10. GPAC 82%
New Job Postings Advertised in Minnesota by Employer Type
Staffing Agencies
23%
Direct
Employers
77%
Staffing Agencies Direct Employers
Top Skills by Volume of New Job Postings, With Change from Prior Year
1. Communication (+7%)
2. Analysis (+2%)
3. Testing (-4%)
4. Troubleshooting (+14%)
5. Problem Solving (-5%)
Top Knowledge Areas, Tools, and Tech by Volume of New Job Postings, With Change from
Prior Year
1. Mechanical Engineering (+14%)
2. Computer-Aided Design (-13%)
3. Scheduling (+56%)
4. SolidWorks CAD (+12%)
5. Project Management (+47%)
Source: RealTime Talent analysis of Chmura Economics JobsEQ®, http://www.chmuraecon.com/jobseq/. Job Posting Trends section uses data from Gartner TalentNeuron Plan, accessed
1/10/2022 at talentneuronplan.gartner.com 8Top Certifications by Volume of New Job Postings, With Change from Prior Year
1. American Society of Mechanical Engineers – Y14.5 Dimensioning and Tolerancing (+40%)
2. Accreditation Board for Engineering and Technology (+144%)
3. Class D Driver’s License (+35%)
4. Engineer-in-Training (+147%)
5. Computer-Aided Engineering (+115%)
Source: RealTime Talent analysis of Chmura Economics JobsEQ®, http://www.chmuraecon.com/jobseq/. Job Posting Trends section uses data from Gartner TalentNeuron Plan, accessed
1/10/2022 at talentneuronplan.gartner.com 9Supply
This supply section is a new addition to the 2021 Demand Analysis. This data provides insight on the
Automotive Program Completers by Degree Level in Minnesota | 2019 - 2020
CIP Code Program Title Cert1 Assc Assc+ Bach Total
Automotive Engineering Technology/
15.0803 0 0 0 28 28
Technician
Automobile/Automotive Mechanics
47.0604 71 112 109 0 292
Technology/Technician
High Performance and Custom Engine
47.0617 0 0 0 0 0
Technician/Mechanic
Total 71 112 109 28 320
Assc = Associate’s degree
Bach = Bachelor’s degree or equivalentAVIATION
Demand Analysis
2021Introduction and Sector Overview ................................................................................................................... 2
Industry/Occupation Mix ................................................................................................................................4
Pathway Detail ...............................................................................................................................................4
Employment Types ........................................................................................................................................ 7
Job Posting Trends ........................................................................................................................................ 7
Top Employers by Volume of New Job Postings in 2021, With Change from Prior Year .............................................. 8
Top Skills by Volume of New Job Postings, With Change from Prior Year .................................................................... 8
Top Knowledge Areas, Tools, and Tech by Volume of New Job Postings, With Change from Prior Year ..................... 8
Top Certifications by Volume of New Job Postings, With Change from Prior Year ...................................................... 9
1Introduction and Sector Overview
This report highlights the importance of the Aviation career pathway for Minnesota’s Transportation Industry.
Professionals in Aviation work in diverse roles from piloting, air traffic controlling, and aircraft maintenance
technician, as well as designing, servicing, or piloting drones. 1 In all, about 8,773 people work in Aviation roles in
Minnesota as of the second quarter of 2021—a -8.0% decline (-758 workers) from a year prior.
Overall employment in Minnesota has declined by nearly -92,000 workers (-3.1%) between the second quarter of
2020 and 2021, and the five-year forecast dropped from 49,053 expansion of employment over five years to just
31,051 from 2021 through 2026 as of the most current baseline forecasts, or about 0.2% average annual growth. An
optimistic forecast assuming reduction in labor force exits, economic conditions improving, and lessening impacts of
COVID-19 on key industries forecasts up to 1.2% average annual growth over the next five years, or a total of 172,340
people newly employed by 2026. During this time frame, Aviation employment is anticipated to grow moderately in
Minnesota by about 35 total jobs (0.1% annually) due to a tight talent pool, but could grow by about 667 (1.5%
annually) in an optimistic forecast model. Total baseline demand for Aviation talent is anticipated to be around 3,844
professionals needed to fill positions due to job exits and transfers, such as retirements and job changes.
Transportation Pathways in Minnesota – Baseline Forecast, 2021Q21
Current 5-Year History 5-Year Baseline Forecast
Avg Ann Unempl Online Empl Total Empl Ann %
Occupation Empl Wages2 LQ Unempl Rate Job Ads3 Change Ann % Demand Exits Transfers Growth Growth
Automotive Technology Pathway 21,614 $61,300 1.03 753 3.4% 1,263 163 0.2% 8,991 2,619 6,697 -324 -0.3%
Aviation Pathway* 8,773 $122,300 0.88 346 3.9% 210 -674 -1.5% 3,844 1,121 2,688 35 0.1%
Collision Repair Pathway 6,864 $46,900 1.14 324 4.6% 376 -307 -0.9% 3,524 1,042 2,480 2 0.0%
Diesel Equipment and Truck
12,889 $56,000 1.20 344 2.7% 487 -451 -0.7% 6,292 1,919 4,383 -10 0.0%
Pathway
Marine and Power Sports
5,181 $41,900 1.07 373 6.8% 58 80 0.3% 3,109 963 2,131 15 0.1%
Pathway
Truck Driving Pathway 95,261 $44,600 0.96 6,493 6.60% 8,796 -843 -0.2% 57,082 22,543 33,247 1,293 0.3%
Transportation Occupations 147,533 $51,600 0.99 8,573 5.6% 11,284 -1,891 -0.3% 81,732 29,859 50,858 1,015 0.1%
Total - All Occupations 2,920,850 $58,900 1.00 145,886 4.9% 181,745 -83,089 -0.6% 1,672,986 625,772 1,016,164 31,051 0.2%
*This pathway includes Drone Technology careers as of 2021, which were not included in the 2020 estimates of career pathway employment or demand.
Source: JobsEQ®
Data as of 2021Q2 unless noted otherwise
Note: Figures may not sum due to rounding.
1. Data based on a four-quarter moving average unless noted otherwise.
2. Wage data are as of 2020 and represent the average for all Covered Employment
3. Data represent found online ads active within the last thirty days in the selected region; data represents a sampling rather than the complete universe of postings. Ads lacking zip code information but designating a
place (city, town, etc.) may be assigned to the zip code with greatest employment in that place for queries in this analytic. Due to alternative county-assignment algorithms, ad counts in this analytic may not match
that shown in RTI (nor in the popup window ad list).
1
Drone Technology careers were added to the Aviation Pathway in this report, but were not included in the prior 2020 version of
this report. Another way that this pathway has been described in other reports is Aviation and Drone Technology Pathway.
Source: RealTime Talent analysis of Chmura Economics JobsEQ®, http://www.chmuraecon.com/jobseq/. Job Posting Trends section uses data from Gartner TalentNeuron Plan, accessed
1/10/2022 at talentneuronplan.gartner.com 2As Minnesota’s economy continues to sustain loss of workers due to the pandemic and overall talent shortage, and
with unknown ongoing impacts of the COVID-19 pandemic on our economy and public health, employment forecasts
are changing rapidly. Supply chain impacts, the drive to automation and technological innovation mean that the
transportation industry, in particular, may look very different in five years from what it looks like today. The
componding impacts of a tight labor market prior to the start of the pandemic and significant, rapid layoffs of non-
essential workers across service industry positions creates a complex landscape of employer demand and an
available workforce. Forecasting future needs under current conditions with an eye to anticipated talent pipelines
into Aviation suggest that there may be shortages of talent across a large share of occupations in this career pathway
unless more talent decides to enter the field. The pathway forecast has soured since estimates in late 2020, with a
baseline forecast of about 0.1% growth in overall employment by the second quarter of 2026.
Aviation Employment Forecast Under Baseline Scenario, Minnesota
Source: RealTime Talent analysis of Chmura Economics JobsEQ®, http://www.chmuraecon.com/jobseq/. Job Posting Trends section uses data from Gartner TalentNeuron Plan, accessed
1/10/2022 at talentneuronplan.gartner.com 3Industry/Occupation Mix
Aviation talent is primarily concentrated in the Scheduled Air Transportation Industry (35.3%) but are critical to a
wide range of air transportation and aerospace industries in Minnesota.
Top Industry Distribution for Aviation Pathway Occupations in Minnesota
Pathway Detail
Of all occupations found in the Aviation pathway, the specific occupations of Airline Pilots, Air Traffic Controllers, and
Electro-Mechanical and Mechatronics Techs are uniquely concentrated in Minnesota to a higher degree than seen in
the nation overall. On average, Aviation careers pay about $122,300 per year—about $63,400 higher than the
average wage statewide across all positions. There is significant variation in average wages across this field, with
Airline Pilots with the highest average wages at $199,600 compared to Aircraft Cargo Handling Supervisors at
$55,100 annually.
Source: RealTime Talent analysis of Chmura Economics JobsEQ®, http://www.chmuraecon.com/jobseq/. Job Posting Trends section uses data from Gartner TalentNeuron Plan, accessed
1/10/2022 at talentneuronplan.gartner.com 4Aviation Pathway in Minnesota – Baseline Forecast, 2021Q21
Current 1-Year History 5-Year Baseline Forecast
Avg Ann Unempl Online Job Empl Ann Total Empl Ann %
SOC Occupation Empl Wages2 LQ Unempl Rate Ads3 Change % Demand Exits Transfers Growth Growth
17-2199 Engineers, All Other 2,583 $102,100 0.82 46 1.8% 52 -78 -2.9% 883 270 618 -5 0.0%
Airline Pilots, Copilots, and Flight -
53-2011 2,399 $199,600 1.61 129 5.2% 3 -446 1,235 337 889 9 0.1%
Engineers 15.7%
Aircraft Mechanics and Service
49-3011 1,802 $79,100 0.74 67 3.7% 31 -174 -8.8% 777 247 502 29 0.3%
Technicians
53-2021 Air Traffic Controllers 567 $141,400 1.45 21 3.6% 2 -20 -3.4% 259 67 197 -5 -0.2%
Electro-Mechanical and
17-3024 Mechatronics Technologists and 466 $57,000 1.39 14 3.1% 64 -5 -1.0% 226 77 149 0 0.0%
Technicians
53-2012 Commercial Pilots 447 $111,700 0.58 25 5.6% 15 -4 -1.0% 249 64 170 15 0.7%
53-2022 Airfield Operations Specialists 178 $62,300 0.99 6 3.3% 3 -15 -7.6% 88 22 63 3 0.4%
Aircraft Structure, Surfaces,
51-2011 161 $58,800 0.26 23 12.3% 18 -8 -4.9% 50 15 50 -15 -1.9%
Rigging, and Systems Assemblers
49-2091 Avionics Technicians 117 $66,400 0.28 14 10.9% 18 -6 -4.9% 45 14 29 2 0.4%
Aircraft Cargo Handling
53-1041 54 $55,100 0.29 1 2.5% 4 -2 -3.8% 30 9 21 1 0.4%
Supervisors
Aviation and Drone Technology
8,773 $122,300 0.88 346 3.9% 210 -758 -8.0% 3,844 1,121 2,688 35 0.1%
Pathway
Total - All Occupations 2,920,850 $58,900 1.00 145,886 4.9% 181,745 -91,909 -3.1% 1,672,986 625,772 1,016,164 31,051 0.2%
Source: JobsEQ®
Data as of 2021Q2 unless noted otherwise
Note: Figures may not sum due to rounding.
1. Data based on a four-quarter moving average unless noted otherwise.
2. Wage data are as of 2020 and represent the average for all Covered Employment
3. Data represent found online ads active within the last thirty days in the selected region; data represents a sampling rather than the complete universe of postings. Ads lacking zip code information but designating a
place (city, town, etc.) may be assigned to the zip code with greatest employment in that place for queries in this analytic. Due to alternative county-assignment algorithms, ad counts in this analytic may not match
that shown in RTI (nor in the popup window ad list).
By 2026, it is likely that Minnesota will see a growing shortage of talent in five critical Aviation occupations (shown in
red below). The estimated annual shortage of Aircraft Mechanics and Service Technicians has worsened since 2020
estimates, while the other shortages shown below have improved slightly.
Estimated Occupation Gaps over Five Years in Minnesota
Source: RealTime Talent analysis of Chmura Economics JobsEQ®, http://www.chmuraecon.com/jobseq/. Job Posting Trends section uses data from Gartner TalentNeuron Plan, accessed
1/10/2022 at talentneuronplan.gartner.com 5Looking out the next ten years, all but one occupation (Aircraft Structure, Surfaces, Rigging, and Systems Assemblers)
in the Aviation pathway are anticipated to experience talent shortages.
Estimated Occupation Gaps over Ten Years in Minnesota
Source: RealTime Talent analysis of Chmura Economics JobsEQ®, http://www.chmuraecon.com/jobseq/. Job Posting Trends section uses data from Gartner TalentNeuron Plan, accessed
1/10/2022 at talentneuronplan.gartner.com 6Employment Types
About 82% of people employed in Aviation in Minnesota work for private employers, while only about 2% are self-
employed (a slight increase from 2020). The remaining 16% work for state, federal, or local government entities
(mostly federal).
Employment Types, Minnesota 2021Q2
Self Employment
Government 2%
16%
Private
82%
Self Employment Private Government
Job Posting Trends
Data in this section focuses on jobs newly advertised between January 1 and December 31, 2021 in Aviation roles
across Minnesota. All data in this section comes from Gartner TalentNeuron. Overall, there were 713 new jobs
advertised in Aviation careers during this time frame, a decrease of 18% from the prior 12-month period (2020).
Volume of posted positions advertised by staffing and temp agencies in the Aviation pathway dropped moderately in
2021 compared to 2020, as did posts by direct employers (down -13%).
Volume of Career Pathway Online Job Postings in 2020 and 2021
Source: RealTime Talent analysis of Chmura Economics JobsEQ®, http://www.chmuraecon.com/jobseq/. Job Posting Trends section uses data from Gartner TalentNeuron Plan, accessed
1/10/2022 at talentneuronplan.gartner.com 7Top Employers by Volume of New Job Postings in 2021, With Change from Prior Year
Percent Change between
Employer 2020 and 2021
1. Army -31%
2. Aerotek -10%
3. Delta Air Lines 85%
4. SAIC 325%
5. Signature Flight Support 64%
6. Cirrus Aircraft Corporation 163%
7. CommScope 0%
8. Mayo Clinic 850%
9. Sun Country Airlines 6%
10. Department of the Air Force 60%
New Job Postings Advertised in Minnesota by Employer Type
Staffing Agencies
15%
Direct
Employers
85%
Staffing Agencies Direct Employers
Top Skills by Volume of New Job Postings, With Change from Prior Year
1. Communication (-13%)
2. Troubleshooting (-24%)
3. Installing (-4%)
4. Testing (-19%)
5. Aviation Maintenance (-3%)
Top Knowledge Areas, Tools, and Tech by Volume of New Job Postings, With Change from
Prior Year
1. Operations (-22%)
2. Avionics (+11%)
3. Mechanics (-48%)
4. Scheduling (-6%)
5. Supervision (-8%)
Source: RealTime Talent analysis of Chmura Economics JobsEQ®, http://www.chmuraecon.com/jobseq/. Job Posting Trends section uses data from Gartner TalentNeuron Plan, accessed
1/10/2022 at talentneuronplan.gartner.com 8Top Certifications by Volume of New Job Postings, With Change from Prior Year
1. Class D Driver’s License (+27%)
2. Security Clearance (-33%)
3. OSHA (+67%)
4. HAZMAT (-36%)
5. Airline Transport Pilot (-39%)
Source: RealTime Talent analysis of Chmura Economics JobsEQ®, http://www.chmuraecon.com/jobseq/. Job Posting Trends section uses data from Gartner TalentNeuron Plan, accessed
1/10/2022 at talentneuronplan.gartner.com 9Supply
This supply section is a new addition to the 2021 Demand Analysis. This data provides insight on the
Aviation Program Completers by Degree Level in Minnesota | 2019 - 2020
CIP Code Program Title Cert2 Assc Assc+ Bach Total
Airline/Commercial/Professional Pilot and Flight
49.0102 0 4 0 7 11
Crew
Airframe Mechanics and Aircraft Maintenance
47.0607 0 31 12 0 43
Technology/Technician
47.0608 Aircraft Powerplant Technology/Technician 0 4 0 0 4
47.0609 Avionics Maintenance Technology/Technician 5 0 0 0 5
Total 5 39 12 7 63
Assc = Associate’s degree
Bach = Bachelor’s degree or equivalentCOLLISION
REPAIR
Demand Analysis
2021Introduction and Sector Overview ................................................................................................................... 2
Industry/Occupation Mix ................................................................................................................................4
Pathway Detail ...............................................................................................................................................4
Employment Types ........................................................................................................................................ 7
Job Posting Trends ........................................................................................................................................ 7
Top Employers by Volume of New Job Postings in 2021, With Change from Prior Year .............................................. 8
Top Skills by Volume of New Job Postings, With Change from Prior Year .................................................................... 9
Top Knowledge Areas, Tools, and Tech by Volume of New Job Postings, With Change from Prior Year ..................... 9
Top Certifications by Volume of New Job Postings, With Change from Prior Year ...................................................... 9
1Introduction and Sector Overview
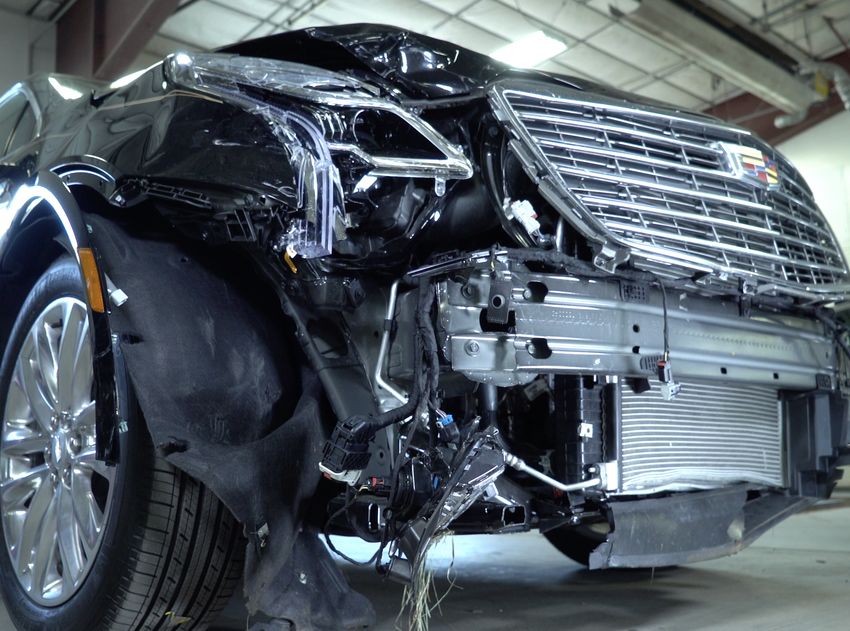
This report highlights the importance of the Collision Repair career pathway for Minnesota’s Transportation Industry.
Professionals in Collision Repair work in diverse roles from autobody repairers and glass installers to autobody
painting, serving industries as diverse as Navigational Manufacturing and Automobile Dealerships. In all, about 6,864
people work in Collision Repair roles in Minnesota as of the second quarter of 2021—remaining flat (-16 workers)
from a year prior.
Overall employment in Minnesota has declined by nearly -92,000 workers (-3.1%) between the second quarter of
2020 and 2021, and the five-year forecast dropped from 49,053 expansion of employment over five years to just
31,051 from 2021 through 2026 as of the most current baseline forecasts, or about 0.2% average annual growth. An
optimistic forecast assuming reduction in labor force exits, economic conditions improving, and lessening impacts of
COVID-19 on key industries forecasts up to 1.2% average annual growth over the next five years, or a total of 172,340
people newly employed by 2026. During this time frame, Collision Repair employment is anticipated to continue to
remain stable in Minnesota, rising by just 2 total jobs (0.0% annually) due to a tight talent pool, but could grow by
about 341 (1.0% annually) in an optimistic forecast model. Total baseline demand for Collision Repair talent is
anticipated to be around 3,524 professionals needed to fill positions due to job exits and transfers, such as
retirements and job changes.
Transportation Pathways in Minnesota – Baseline Forecast, 2021Q21
Current 5-Year History 5-Year Baseline Forecast
Avg Ann Unempl Online Empl Total Empl Ann %
Occupation Empl Wages2 LQ Unempl Rate Job Ads3 Change Ann % Demand Exits Transfers Growth Growth
Automotive Technology Pathway 21,614 $61,300 1.03 753 3.4% 1,263 163 0.2% 8,991 2,619 6,697 -324 -0.3%
Aviation Pathway* 8,773 $122,300 0.88 346 3.9% 210 -674 -1.5% 3,844 1,121 2,688 35 0.1%
Collision Repair Pathway 6,864 $46,900 1.14 324 4.6% 376 -307 -0.9% 3,524 1,042 2,480 2 0.0%
Diesel Equipment and Truck
12,889 $56,000 1.20 344 2.7% 487 -451 -0.7% 6,292 1,919 4,383 -10 0.0%
Pathway
Marine and Power Sports
5,181 $41,900 1.07 373 6.8% 58 80 0.3% 3,109 963 2,131 15 0.1%
Pathway
Truck Driving Pathway 95,261 $44,600 0.96 6,493 6.60% 8,796 -843 -0.2% 57,082 22,543 33,247 1,293 0.3%
Transportation Occupations 147,533 $51,600 0.99 8,573 5.6% 11,284 -1,891 -0.3% 81,732 29,859 50,858 1,015 0.1%
Total - All Occupations 2,920,850 $58,900 1.00 145,886 4.9% 181,745 -83,089 -0.6% 1,672,986 625,772 1,016,164 31,051 0.2%
*This pathway includes Drone Technology careers as of 2021, which were not included in the 2020 estimates of career pathway employment or demand.
Source: JobsEQ®
Data as of 2021Q2 unless noted otherwise
Note: Figures may not sum due to rounding.
1. Data based on a four-quarter moving average unless noted otherwise.
2. Wage data are as of 2020 and represent the average for all Covered Employment
3. Data represent found online ads active within the last thirty days in the selected region; data represents a sampling rather than the complete universe of postings. Ads lacking zip code information but designating a
place (city, town, etc.) may be assigned to the zip code with greatest employment in that place for queries in this analytic. Due to alternative county-assignment algorithms, ad counts in this analytic may not match
that shown in RTI (nor in the popup window ad list).
Source: RealTime Talent analysis of Chmura Economics JobsEQ®, http://www.chmuraecon.com/jobseq/. Job Posting Trends section uses data from Gartner TalentNeuron Plan, accessed
1/10/2022 at talentneuronplan.gartner.com 2As Minnesota’s economy continues to sustain loss of workers due to the pandemic and overall talent shortage, and
with unknown ongoing impacts of the COVID-19 pandemic on our economy and public health, employment forecasts
are changing rapidly. Supply chain impacts, the drive to automation and technological innovation mean that the
transportation industry, in particular, may look very different in five years from what it looks like today. The
componding impacts of a tight labor market prior to the start of the pandemic and significant, rapid layoffs of non-
essential workers across service industry positions creates a complex landscape of employer demand and an
available workforce. Forecasting future needs under current conditions with an eye to anticipated talent pipelines
into Collision Repair suggest that there may be shortages of talent across a large share of occupations in this career
pathway unless more talent decides to enter the field. The pathway forecast has soured since estimates in late 2020,
with overall employment remaining flat through the second quarter of 2026.
Collision Repair Employment Forecast Under Baseline Scenario, Minnesota
Source: RealTime Talent analysis of Chmura Economics JobsEQ®, http://www.chmuraecon.com/jobseq/. Job Posting Trends section uses data from Gartner TalentNeuron Plan, accessed
1/10/2022 at talentneuronplan.gartner.com 3Industry/Occupation Mix
Collision Repair talent is primarily concentrated in the Automotive Repair and Maintenance industry (46.4%),
increasing in its concentration from estimates in 2020 by 0.5 percentage points. The next highest industry of
employment concentration is Automobile Dealers (7.5%), followed by general Coating, Engraving, Heat Treating, and
Allied Activities as well as Architectural and Structural Metals Manufacturing employers.
Top Industry Distribution for Collision Repair Pathway Occupations in Minnesota
Pathway Detail
Of the three occupations found in the Collision Repair pathway, Coating, Painting, and Spraying Machine Setters,
Operators, and Tenders are uniquely concentrated in Minnesota to a higher degree than seen in the nation overall.
On average, Collision Repair careers pay about $46,900 per year (up from $46,200 last year)—about $12,000 below
than the average wage statewide across all positions.
Source: RealTime Talent analysis of Chmura Economics JobsEQ®, http://www.chmuraecon.com/jobseq/. Job Posting Trends section uses data from Gartner TalentNeuron Plan, accessed
1/10/2022 at talentneuronplan.gartner.com 4Collision Repair Pathway in Minnesota – Baseline Forecast, 2021Q21
Current 1-Year History 5-Year Baseline Forecast
Avg Ann Unempl Online Job Empl Total Empl Ann %
SOC Occupation Empl Wages2 LQ Unempl Rate Ads3 Change Ann % Demand Exits Transfers Growth Growth
Coating, Painting, and Spraying
51-9124 Machine Setters, Operators, and 3,557 $43,700 1.30 162 4.4% 216 -126 -3.4% 1,921 532 1,400 -10 -0.1%
Tenders
Automotive Body and Related
49-3021 2,816 $51,400 0.99 131 4.5% 127 -74 -2.6% 1,374 452 905 17 0.1%
Repairers
Automotive Glass Installers and
49-3022 490 $44,400 1.08 31 5.9% 33 2 0.4% 229 58 175 -4 -0.2%
Repairers
Collision Repair Pathway 6,864 $46,900 1.14 324 4.6% 376 -198 -2.8% 3,524 1,042 2,480 2 0.0%
Total - All Occupations 2,920,850 $58,900 1.00 145,886 4.9% 181,745 -91,909 -3.1% 1,672,986 625,772 1,016,164 31,051 0.2%
Source: JobsEQ®
Data as of 2021Q2 unless noted otherwise
Note: Figures may not sum due to rounding.
1. Data based on a four-quarter moving average unless noted otherwise.
2. Wage data are as of 2020 and represent the average for all Covered Employment
3. Data represent found online ads active within the last thirty days in the selected region; data represents a sampling rather than the complete universe of postings. Ads lacking zip code information but designating a
place (city, town, etc.) may be assigned to the zip code with greatest employment in that place for queries in this analytic. Due to alternative county-assignment algorithms, ad counts in this analytic may not match
that shown in RTI (nor in the popup window ad list).
By 2026, it is likely that Minnesota will see a growing shortage of Auto Body Repairers (shown in red below). The
estimated annual shortage of Auto Body Repairers have worsened since 2020 estimates.
Estimated Occupation Gaps over Five Years in Minnesota
Looking out the next ten years, all three occupations in the Collision Repair pathway are anticipated to experience
talent shortages. The long-term shortage of Auto Body Repairers and Auto Glass Installers and Repairers have
remained the same as estimated shortages as of 2020, but the shortage of Coating, Painting, and Spraying Machine
Setters, Operators, and Tenders has worsened.
Source: RealTime Talent analysis of Chmura Economics JobsEQ®, http://www.chmuraecon.com/jobseq/. Job Posting Trends section uses data from Gartner TalentNeuron Plan, accessed
1/10/2022 at talentneuronplan.gartner.com 5Estimated Occupation Gaps over Ten Years in Minnesota Source: RealTime Talent analysis of Chmura Economics JobsEQ®, http://www.chmuraecon.com/jobseq/. Job Posting Trends section uses data from Gartner TalentNeuron Plan, accessed 1/10/2022 at talentneuronplan.gartner.com 6
Employment Types
About 94% of people employed in Collision Repair careers in Minnesota work for private employers, while an
estimated 5% are self-employed (a slight increase from 2020). The remaining 1% work for state, federal, or local
government entities.

                                                  Employment Types, Minnesota 2021Q2
                                                                       Government          Self Employment
                                                                           1%                     5%

                                                                             Private
                                                                              94%

                                                            Self Employment            Private       Government

Job Posting Trends
Data in this section focuses on jobs newly advertised between January 1 and December 31, 2021 in Collision Repair
roles across Minnesota. All data in this section comes from Gartner TalentNeuron. Overall, there were 1,424 new
jobs advertised in Collision Repair during this time frame, an increase of 79% from the prior 12-month period (2020).
Posts by direct employers alone were up by 94% between the two years. The share of posted positions advertised by
staffing and temp agencies in the Collision Repair pathway increased in 2021 compared to 2020, implying dramatic
increases in challenges finding talent in this career pathway and direct employers resorting to using new strategies to
find talent.

Source: RealTime Talent analysis of Chmura Economics JobsEQ®, http://www.chmuraecon.com/jobseq/. Job Posting Trends section uses data from Gartner TalentNeuron Plan, accessed
1/10/2022 at talentneuronplan.gartner.com                                                                                                                                 7
Volume of Career Pathway Online Job Postings in 2020 and 2021
Top Employers by Volume of New Job Postings in 2021, With Change from Prior Year
Percent Change
Employer between 2020 and 2021
1. Caliber Collision Centers 154%
2. Safelite Autoglass 259%
3. J.N. Phillips Glass 373%
4. Caliber Auto Glass 0%
5. People Ready 2150%
6. GPAC 0%
7. Express Employment Professionals -3%
8. Aerotek -30%
9. Carvana 50%
10. Walser Collision And Glass 62%
Source: RealTime Talent analysis of Chmura Economics JobsEQ®, http://www.chmuraecon.com/jobseq/. Job Posting Trends section uses data from Gartner TalentNeuron Plan, accessed
1/10/2022 at talentneuronplan.gartner.com 8New Job Postings Advertised in Minnesota by Employer Type
Staffing Agencies
18%
Direct
Employers
82%
Staffing Agencies Direct Employers
Top Skills by Volume of New Job Postings, With Change from Prior Year
1. Communication (-30%)
2. Glass Installation (+116%)
3. Auto Body Repair (-53%)
4. Friendliness (-55%)
5. Welding (-52%)
Top Knowledge Areas, Tools, and Tech by Volume of New Job Postings, With Change from
Prior Year
1. Customer Service (+12%)
2. Personal Protective Equipment (+106%)
3. Work Orders (-27%)
4. Resource Management (+13%)
5. Fleet Vehicles (+1%)
Top Certifications by Volume of New Job Postings, With Change from Prior Year
1. Class D Driver’s License (+160%)
2. I-CAR Certified (+620%)
3. Automotive Service Excellence (+5%)
4. OSHA (+6%)
5. HAZMAT (+77%)
Source: RealTime Talent analysis of Chmura Economics JobsEQ®, http://www.chmuraecon.com/jobseq/. Job Posting Trends section uses data from Gartner TalentNeuron Plan, accessed
1/10/2022 at talentneuronplan.gartner.com 9Supply
This supply section is a new addition to the 2021 Demand Analysis. This data provides insight on the
Collision Repair Program Completers by Degree Level in Minnesota | 2019 - 2020
CIP Code Program Title Cert2 Assc Assc+ Total
47.0603 Autobody/Collision and Repair Technology/Technician 32 32 23 87
Total 32 32 23 87
Assc = Associate’s degree
Bach = Bachelor’s degree or equivalentDIESEL EQUIPMENT
& TRUCK
Demand Analysis
2021Introduction and Sector Overview ................................................................................................................... 2
Industry/Occupation Mix ................................................................................................................................4
Pathway Detail ...............................................................................................................................................4
Employment Types ........................................................................................................................................ 7
Job Posting Trends ........................................................................................................................................ 7
Top Employers by Volume of New Job Postings in 2021, With Change from Prior Year .............................................. 8
Top Skills by Volume of New Job Postings, With Change from Prior Year .................................................................... 9
Top Knowledge Areas, Tools, and Tech by Volume of New Job Postings, With Change from Prior Year ..................... 9
Top Certifications by Volume of New Job Postings, With Change from Prior Year ...................................................... 9
1Introduction and Sector Overview
This report highlights the importance of the Diesel, Equipment, and Truck career pathway for Minnesota’s
Transportation Industry. Professionals in Diesel, Equipment, and Truck careers work as Truck Mechanics, Diesel
Specialists, Crane Operators, and Farm Equipment Mechanics serving a variety of industries. In all, about 12,889
people work in Collision Repair roles in Minnesota as of the second quarter of 2021—down about 360 workers from
the second quarter of 2020.
Overall employment in Minnesota has declined by nearly -92,000 workers (-3.1%) between the second quarter of
2020 and 2021, and the five-year forecast dropped from 49,053 expansion of employment over five years to just
31,051 from 2021 through 2026 as of the most current baseline forecasts, or about 0.2% average annual growth. An
optimistic forecast assuming reduction in labor force exits, economic conditions improving, and lessening impacts of
COVID-19 on key industries forecasts up to 1.2% average annual growth over the next five years, or a total of 172,340
people newly employed by 2026. During this time frame, Diesel, Equipment, and Truck pathway employment is
anticipated to continue to remain stable in Minnesota, declining by about ten workers (0.0% annually) due to a tight
talent pool, but could grow by about 620 (0.9% annually) in an optimistic forecast model. Total baseline demand for
Diesel, Equipment, and Truck talent is anticipated to be around 6,292 professionals needed to fill positions due to job
exits and transfers, such as retirements and job changes.
Transportation Pathways in Minnesota – Baseline Forecast, 2021Q21
Current 5-Year History 5-Year Baseline Forecast
Avg Ann Unempl Online Empl Total Empl Ann %
Occupation Empl Wages2 LQ Unempl Rate Job Ads3 Change Ann % Demand Exits Transfers Growth Growth
Automotive Technology Pathway 21,614 $61,300 1.03 753 3.4% 1,263 163 0.2% 8,991 2,619 6,697 -324 -0.3%
Aviation Pathway* 8,773 $122,300 0.88 346 3.9% 210 -674 -1.5% 3,844 1,121 2,688 35 0.1%
Collision Repair Pathway 6,864 $46,900 1.14 324 4.6% 376 -307 -0.9% 3,524 1,042 2,480 2 0.0%
Diesel Equipment and Truck
12,889 $56,000 1.20 344 2.7% 487 -451 -0.7% 6,292 1,919 4,383 -10 0.0%
Pathway
Marine and Power Sports
5,181 $41,900 1.07 373 6.8% 58 80 0.3% 3,109 963 2,131 15 0.1%
Pathway
Truck Driving Pathway 95,261 $44,600 0.96 6,493 6.60% 8,796 -843 -0.2% 57,082 22,543 33,247 1,293 0.3%
Transportation Occupations 147,533 $51,600 0.99 8,573 5.6% 11,284 -1,891 -0.3% 81,732 29,859 50,858 1,015 0.1%
Total - All Occupations 2,920,850 $58,900 1.00 145,886 4.9% 181,745 -83,089 -0.6% 1,672,986 625,772 1,016,164 31,051 0.2%
*This pathway includes Drone Technology careers as of 2021, which were not included in the 2020 estimates of career pathway employment or demand.
Source: JobsEQ®
Data as of 2021Q2 unless noted otherwise
Note: Figures may not sum due to rounding.
1. Data based on a four-quarter moving average unless noted otherwise.
2. Wage data are as of 2020 and represent the average for all Covered Employment
3. Data represent found online ads active within the last thirty days in the selected region; data represents a sampling rather than the complete universe of postings. Ads lacking zip code information but designating a
place (city, town, etc.) may be assigned to the zip code with greatest employment in that place for queries in this analytic. Due to alternative county-assignment algorithms, ad counts in this analytic may not match
that shown in RTI (nor in the popup window ad list).
Source: RealTime Talent analysis of Chmura Economics JobsEQ®, http://www.chmuraecon.com/jobseq/. Job Posting Trends section uses data from Gartner TalentNeuron Plan, accessed
1/10/2022 at talentneuronplan.gartner.com 2As Minnesota’s economy continues to sustain loss of workers due to the pandemic and overall talent shortage, and
with unknown ongoing impacts of the COVID-19 pandemic on our economy and public health, employment forecasts
are changing rapidly. Supply chain impacts, the drive to automation and technological innovation mean that the
transportation industry, in particular, may look very different in five years from what it looks like today. The
componding impacts of a tight labor market prior to the start of the pandemic and significant, rapid layoffs of non-
essential workers across service industry positions creates a complex landscape of employer demand and an
available workforce. Forecasting future needs under current conditions with an eye to anticipated talent pipelines
into Diesel, Equipment, and Truck careers suggest that there may be shortages of talent across a large share of
occupations in this pathway unless more talent decides to enter the field. The pathway forecast has soured since
estimates in late 2020 with last year’s baseline estimates of 0.5% average annual growth now down to 0.0% through
the second quarter of 2026.
Diesel, Equipment, and Truck Employment Forecast Under Baseline Scenario, Minnesota
Source: RealTime Talent analysis of Chmura Economics JobsEQ®, http://www.chmuraecon.com/jobseq/. Job Posting Trends section uses data from Gartner TalentNeuron Plan, accessed
1/10/2022 at talentneuronplan.gartner.com 3You can also read