Feed Outlook: March 2023 - Angelica Williams Claire Hutchins
←
→
Page content transcription
If your browser does not render page correctly, please read the page content below
Economic Research Service | Situation and Outlook Report

                          FDS-23c | March 10, 2023               Next release is April 13, 2023

                                                                             In this report:
Feed Outlook: March 2023                                                     Domestic Outlook
Angelica Williams                                                            International Outlook

Claire Hutchins

U.S. Corn Exports Are Revised Down in March,
Feed Grain Prices See Modest Declines
This month, there are no changes to the 2022/23 domestic supply or domestic use projections
for corn, sorghum, barley, or oats. Corn exports for 2022/23 are revised down 75 million bushels
in the March World Agricultural Supply and Demand Estimates (WASDE) report (to 1,850 million
bushels), on a slow pace of sales and shipments thus far in the marketing year. With domestic
use unchanged, the corn ending stocks forecast is raised commensurately to 1,342 million
bushels. The 2022/23 projected season-average farm prices for both corn and oats are revised
down this month to $6.60 per bushel and $4.75 per bushel, respectively. The projected season-
average farm price for all barley (of $7.30 per bushel) and for sorghum (of $6.90 per bushel) are
both unchanged from the February WASDE report.

Global corn production and trade are both projected lower this month. Hot temperatures and
continued drought conditions are driving Argentine corn production projection down, which is
partially offset by higher output for India and Paraguay. Lower supplies have led to a decrease
in Argentina’s exports. U.S. corn exports are also revised down, a reflection of the slow pace of
exports and low outstanding sales so far this year. Lower corn exports by the United States
and Argentina are partially offset by increases in exports by Brazil, Ukraine, and India.

Approved by the USDA's World Agricultural Outlook Board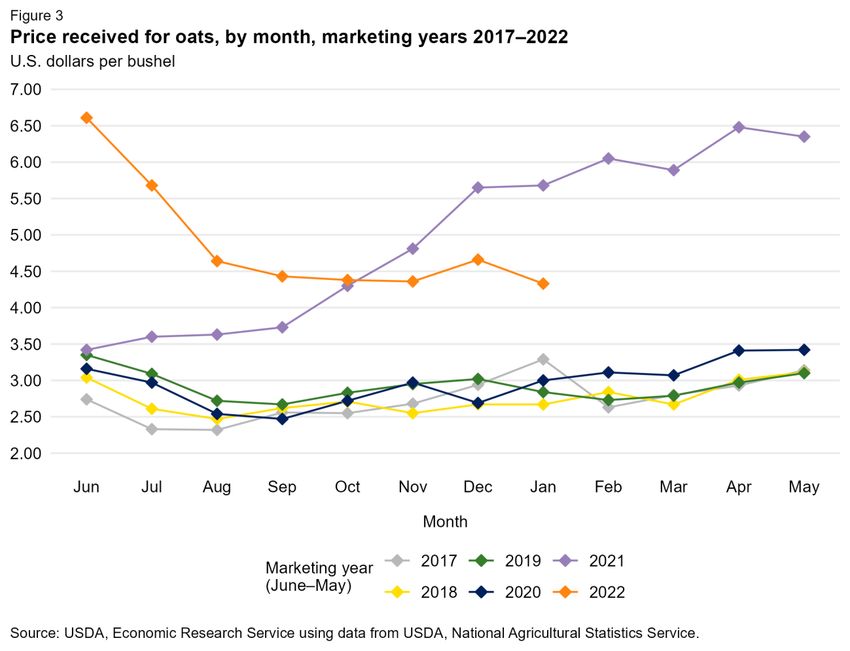
Domestic Outlook
Claire Hutchins
U.S. Corn Exports Slip Again in March on Lackluster
Commercial Activity
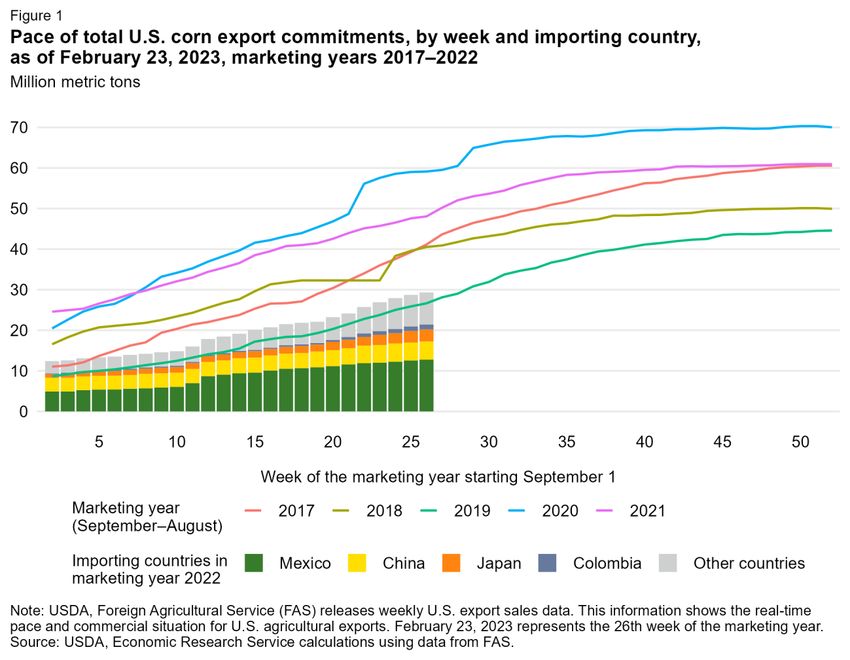
The USDA, Foreign Agricultural Service (FAS) reported total U.S. corn export commitments
(shipments plus outstanding sales) at 29.2 million metric tons as of February 23, 2023 (week 26
of the marketing year)—down 39 percent from last year and 31 percent below the 5-year
average. At the beginning of the 2022/23 marketing year, U.S. corn exports were constrained by
logistical problems and relatively uncompetitive prices. Since mid-January, U.S. price
competitiveness has improved. However, corn export sales have been slow to respond, while
reported export inspection shipments during January and February (combined) are well below
the average shipped during the same period in 2020/21 and 2021/22.
2
Feed Outlook: March 2023, FDS-23c, March 10, 2023
USDA, Economic Research Service
All domestic corn use categories are unchanged from the February WASDE report. The
2022/23 corn ending stocks forecast is raised 75 million bushels in March to 1,342 million
bushels. The forecasted corn season-average farm price for 2022/23—of $6.60 per bushel—is
down $0.10 from last month on relatively flat prices received between December 2022 and
January 2023 (reported by the USDA, National Agricultural Statistics Service).

Sorghum and All Barley Prices Hold Strong in March, Oat
Prices Are Lower
The 2022/23 season-average farm price for sorghum (of $6.90 per bushel) and all barley (of
$7.30 per bushel) are unchanged from last month, but represent historic highs for both
commodities on limited supplies and strong domestic demand for feed grains. The 2022/23 oats
season-average farm price fell $0.10 from last month (to $4.75 per bushel), on trending
weakness in the NASS monthly prices received through January 2023.

                                               3
                       Feed Outlook: March 2023, FDS-23c, March 10, 2023
                              USDA, Economic Research Service
4
Feed Outlook: March 2023, FDS-23c, March 10, 2023
USDA, Economic Research ServiceInternational Outlook
Angelica Williams
Global Coarse Grain Output Is Projected Lower
Global coarse grain production for 2022/23 is projected down 3.2 million tons this month to
1,439.6 million tons. Reductions in projected corn and sorghum supplies from Argentina more
than offset the expected increase in corn supplies from India and Paraguay—and increases in
barley supplies from Kazakhstan, Australia and Argentina. Coarse grain production in the
United States is unchanged this month. Information on this month’s changes in global, foreign,
and U.S. coarse grain production are shown in table A1 below.
Table A1 - World and U.S. coarse grain production at a glance (2022/23), March 2023
Region or Change from YoY
Production Comments
country previous month1 Change 2
Million tons
Coarse grain production (total)
World 1,439.6 -3.2 -62.8
Partially offsetting changes are made for a number of countries
Foreign 1,081.2 -3.2 -23.5
and commodities. See table A2.
United States 358.5 No change -39.2 See section on U.S. domestic output.
World production of coarse grains by type of grain
CORN
World 1,147.5 -3.8 -68.5
Reductions in crop output from Argentina more than offset
Foreign 798.8 -3.8 -34.4 increases in India, Kazakhastan, Turkey, and Paraguay. See Table
A2.
United States 348.8 No change -34.1 See section on U.S. domestic output.
BARLEY
World 151.6 +1.2 +5.7
Higher production in Kazakhstan and Australia more than offsets
Foreign 147.8 +1.2 +4.5
lower production in South Africa. See table A2.
United States 3.8 No change +1.2 See section on U.S. domestic output.
SORGHUM
World 58.0 -0.5 -3.9
Foreign 53.3 -0.5 +2.7 Lower output is projected for Argentina and Australia. See table A2.
United States 4.8 No change -6.6 See section on U.S. domestic output.
MILLET
World/Foreign 30.3 -0.2 +2.7 Lower output is projected for India.
1 2 3
Change from previous month. YoY: year-over-year changes. Totals may not add due to rounding.
For changes and notes by country, see table A2.
Source: ERS calculations based on USDA, Foreign Agricultural Service, Production, Supply and Distribution database.
5
Feed Outlook: March 2023, FDS-23c, March 10, 2023
USDA, Economic Research ServiceArgentine corn production is projected 7 million tons lower, to a total of 40 million tons for
March. Sustained hot temperatures during February and early March have had a significant
impact on corn yields. Estimated Argentine corn yields are down 18 percent from a year ago
and are projected to be the lowest level since 2011/12.
Corn production in Brazil is unchanged this month, with an estimated output of 125 million tons
for 2022/23. Planting progress of Brazil’s second-crop corn (safrinha) has caught up in center-
west regions of Brazil, despite planting delays caused by rainfall for the country’s soybean
harvest. Corn planting progress started slower than the 10-year average in the Mato-Grosso
region—which produces 44 percent of Brazil’s second crop—but has picked up its planting pace
since mid-February, to reach 89 percent complete as of March 3rd. See figure 4.
Changes made for a number of individual countries this month for coarse grain production by
type of grain are presented in table A2.
6
Feed Outlook: March 2023, FDS-23c, March 10, 2023
USDA, Economic Research ServiceTable A2 - Coarse grain foreign production for 2022/23 at a glance, March 2023
Crop Change in YoY2
Type of crop Production 1 Comments
year forecast change
Million tons
Coarse grain production by country and by type of grain
ARGENTINA
Dry conditions in February are expected to further reduce yields and
Corn Mar-Feb 40.0 -7.0 -9.5
production (see report text).
Increased production is projected, due to higher reported area,
Barley Dec-Nov 4.5 +0.3 -0.8
according to Ministry of Agriculture.
No
Sorghum Mar-Feb 3.4 -0.1 Lower production is reported, based on reduced area harvested.
change
INDIA
Higher projected area and yields are based on the second advanced
Corn Nov-Oct 34.6 +2.6 +0.9
estimate of the Indian Ministry of Agriculture.
Slightly Lower yields are reported on the second advanced estimate of the
Millet Nov-Oct 11.8 -0.2
lower Indian Ministry of Agriculture.
AUSTRALIA
A revision is reported, based on higher yields that offset a reduced
Barley Nov-Oct 14.1 +0.4 -0.2 area and are in line with estimates reported by the Australian Bureau
of Agricultural and Resource Economics and Sciences (ABARES).
A revision is reported, based on lower area and is in line with
Sorghum Mar-Feb 2.5 -0.4 -0.1 estimates reported by the Australian Bureau of Agricultural and
Resource Economics and Sciences (ABARES).
A revision is reported, based on higher yields and is in line with
Oats Nov-Oct 1.6 +0.2 -0.1 estimates reported by the Australian Bureau of Agricultural and
Resource Economics and Sciences (ABARES).
KAZAKHSTAN
Higher production is projected, based on increased yield and area
Barley Jul-Jun 3.3 +0.6 +0.9
reported by Government Stats Agency.
PARAGUAY
Paraguay has an increase in corn poduction on higher area and
Corn Jun-May 4.8 +0.3 -0.7
yields.
TURKEY
Corn Sep-Aug 6.8 +0.3 +0.3 Due to slightly increased area and higher yields.
URUGUAY
Uruguayan corn production is affected by the same dry conditions
Corn Apr-Mar 0.8 -0.1 -0.1
and high temperatures experienced by neighboring Argentina.
SOUTH AFRICA
With the first production estimate released, barley yields are revised
Barley Nov-Oct 0.3 -0.1 -0.1
down to levels on par with previous year.
1
Change from previous month. Smaller changes are made for several countries, see map A for changes in corn .
2
YoY: year-over-year changes.
Source: ERS calculations based on USDA, Foreign Agricultural Service, Production, Supply and Distribution database.
See map A below for a visual display of this month’s changes in corn production.
7
Feed Outlook: March 2023, FDS-23c, March 10, 2023
USDA, Economic Research ServiceMap A – Corn production changes for 2022/23, March 2023
Source: USDA, Foreign Agricultural Service, Production, Supply, and Distribution database.
Global Corn Exports From Argentina and the United States
Revised Lower
Global corn exports for the October-September 2022/23 international trade year are down 2.6
million tons this month, driven primarily by lower exports from Argentina and the United
States. Lower corn production in Argentina has driven projected exports down by 4 million tons
to 29 million for the 2022/23 trade year, marking the country’s lowest corn export level since
2017. Similarly, the U.S. corn export forecast for the 2022/23 October-September trade year is
lowered by 2 million tons to a forecasted 49 million tons (down 75 million bushels for the local
September-August marketing year to 1,850 million bushels), the lowest level since poor spring
planting conditions reduced U.S. corn production in 2019/20. Based on U.S. Bureau of the
Census export data through January in combination with February inspections data, the pace of
U.S. corn sales and shipments is significantly slower than both 2020/21 and 2021/22 and is
more in line with the pace observed in 2019/20 (see figure 5 below). For detailed information on
U.S. corn exports, refer to Domestic section of this report.
8
Feed Outlook: March 2023, FDS-23c, March 10, 2023
USDA, Economic Research ServiceFigure 5. Accumulated U.S. corn exports, 2019/20—2022/23
Million metric tons (MMT)
Note: 2022/23 U.S Census Corn Exports data are through January and U.S. Inspections are for February. At the time
of March World Agricultural Supply and Demand Estimates (WASDE), Census corn exports for January were not
available.
Source: U.S Department of commerce, Bureau of Census.
Lower corn exports by the United States and Argentina are partially offset by increases in
exports from Brazil, Ukraine, and India. Projected October-September Brazilian corn exports
are revised up 1 million metric tons from a month ago to 52 million. Brazil has seen a boost in
corn exports in the first half of 2022/23 trade year. China began importing Brazilian corn, in part
due to lower Brazilian corn port prices through mid-January (see figure 6 below), while the
United States was (at the time) the highest priced corn supplier globally. In addition to price
competitiveness, in October 2022, China officially decided to permit more than 100 Brazilian
facilities to export corn to China.
India’s corn exports are projected 1.2 million tons higher for 2022/23 due to expected higher
supplies. The observed export pace to date (with 3 million tons of corn exported in February,
according to the Ukraine Ministry of Agriculture) supports higher corn export prospects for
Ukraine, up 1 million tons this month.
9
Feed Outlook: March 2023, FDS-23c, March 10, 2023
USDA, Economic Research ServiceFigure 6. Corn export prices by port of origin, September 2022—March 2023.
U.S. dollars per ton
$375
$355
$335
$315
$295
$275
$255
$235
$215
$195
$175
Date
Ukrainian corn (CPT) Argentine corn (FOB) Brazil corn (FOB) U.S. Corn Gulf (FOB)
CPT=carriage-paid-to
FOB=free-on-board
Source: USDA, Economic Research Service using data from AgriCensus.
Corn imports are projected lower for several importing countries. Chile, Columbia, and Peru
are impacted by nearby Argentina’s lower corn exports; each 0.2 million tons lower this month.
Egypt’s, Morocco’s, and Taiwan’s corn imports are also down 0.2 million tons each, while
Iran’s and Malaysia’s imports are revised 0.3 million tons lower. Turkey has the largest
reduction in corn imports for 2022/23, with a 0.4-million-ton reduction.
Few changes were made to sorghum exports this month, with the biggest changes being a 0.2
and 0.1 million tons decrease in Australia’s and Argentina’s sorghum exports for the 2022/23
trade year. A reduction in global sorghum imports is driven primarily by reduced Australian and
Argentine exports destined for China, where imports are projected 0.3 million tons lower this
month. The EU and UK sorghum imports are revised down fractionally, while Iraq sorghum
imports are increased fractionally for 2022/23.
Global barley exports are up 0.4 million tons this month. Higher production has driven
Australia’s and Kazakhstan’s exports up by 0.3 million tons each for 2022/23, offsetting the
0.2 million ton decrease in Russian barley exports.
10
Feed Outlook: March 2023, FDS-23c, March 10, 2023
USDA, Economic Research ServiceFor a visual display on the changes in corn international trade-year exports and imports, see
maps B and C below.
Map B – Corn trade-year exports changes for 2022/23, March 2023
Source: USDA, Foreign Agricultural Service, Production, Supply, and Distribution database.
Map C – Corn trade-year imports changes for 2022/23, March 2023
Source: USDA, Foreign Agricultural Service, Production, Supply, and Distribution database.
11
Feed Outlook: March 2023, FDS-23c, March 10, 2023
USDA, Economic Research ServiceIncreased U.S. Corn Stocks Drive Global Coarse Grain
Stocks Higher
Global corn stocks for 2022/23 are revised up 1.2 million tons for this month, with increases for
the United States and India only partially offset by reductions for Brazil and Ukraine. Reduced
U.S. corn exports have contributed to a boost in U.S. corn stocks of 1.9 million tons, bringing
total stocks to levels just below those from a year ago. Corn ending stocks in India are
increased by 0.9 million tons, driven by higher corn production. Ukraine’s increase in exports
has reduced the country’s corn ending stocks by 1 million metric tons, while Brazil’s ending
stocks are reduced by 0.5 million tons this month.
For a visual display on the changes in corn ending stocks, see map D.
Map D – Corn ending stocks for 2022/23, March 2023
Source: USDA, Foreign Agricultural Service, Production, Supply, and Distribution database.
12
Feed Outlook: March 2023, FDS-23c, March 10, 2023
USDA, Economic Research ServiceSuggested Citation
Williams, Angelica and Claire Hutchins, Feed Outlook: March 2023, FDS-23c, U.S. Department of
Agriculture, Economic Research Service, March 10, 2023.
Use of commercial and trade names does not imply approval or constitute endorsement by USDA.
In accordance with Federal civil rights law and U.S. Department of Agriculture (USDA) civil rights regulations and
policies, the USDA, its Agencies, offices, and employees, and institutions participating in or administering USDA
programs are prohibited from discriminating based on race, color, national origin, religion, sex, gender identity
(including gender expression), sexual orientation, disability, age, marital status, family/parental status, income derived
from a public assistance program, political beliefs, or reprisal or retaliation for prior civil rights activity, in any program
or activity conducted or funded by USDA (not all bases apply to all programs). Remedies and complaint filing
deadlines vary by program or incident.
Persons with disabilities who require alternative means of communication for program information (e.g., Braille, large
print, audiotape, American Sign Language, etc.) should contact the responsible Agency or USDA's TARGET Center
at (202) 720-2600 (voice and TTY) or contact USDA through the Federal Relay Service at (800) 877-8339.
Additionally, program information may be made available in languages other than English.
To file a program discrimination complaint, complete the USDA Program Discrimination Complaint Form, AD-3027,
found online at How to File a Program Discrimination Complaint and at any USDA office or write a letter addressed to
USDA and provide in the letter all of the information requested in the form. To request a copy of the complaint form,
call (866) 632-9992. Submit your completed form or letter to USDA by: (1) mail: U.S. Department of Agriculture,
Office of the Assistant Secretary for Civil Rights, 1400 Independence Avenue, SW, Washington, D.C. 20250-9410;
(2) fax: (202) 690-7442; or (3) email: program.intake@usda.gov.
USDA is an equal opportunity provider, employer, and lender.
13
Feed Outlook: March 2023, FDS-23c, March 10, 2023
USDA, Economic Research ServiceYou can also read