FOREST REFERENCE EMISSION LEVEL FOR SURINAME's REDD+ PROGRAMME - PARAMARIBO-SURINAME January, 2018
←
→
Page content transcription
If your browser does not render page correctly, please read the page content below
FOREST REFERENCE EMISSION LEVEL

FOR SURINAME’s REDD+ PROGRAMME

             January, 2018
         PARAMARIBO-SURINAME
Publisher

REDD+ Suriname, National Institute for Environment and Development in Suriname (NIMOS)
Jaggernath Lachmonstraat 93
Paramaribo, Suriname
http://www.surinameredd.org/

Author

Foundation for Forest Management and Production Control
In Dutch: Stichting voor Bosbeheer en Bostoezicht (SBB)
Martin Luther Kingweg perc. 283
Paramaribo, Suriname
http://sbbsur.com/

Please cite as
Government of Suriname (2018). Forest Reference Emission Level for Suriname’s REDD+ Programme.
Paramaribo, Suriname.

With thanks to
SBB wishes to thank everybody who played a role in completing this Forest Reference Emission Level (FREL), including:
Activity data: Amazon Cooperation Treaty Organization (ACTO) who funded the salaries of national staff in the Forest Cover Monitoring
Unit (FCMU) and many trainings, Food and Agriculture Organization (FAO) for training in accuracy assessment and technical support, ONF
International (ONFI) for new skills through a regional collaboration project, and south-south collaboration partners.
Emission factors: All providers of forest inventory data included in the Technical Report State-of-the-art study: Best estimates for emission
factors and carbon stocks for Suriname and the Centre for Agricultural Research in Suriname (CELOS), the Tropical Agricultural Research
and Higher Education Center (CATIE) and Anton de Kom University of Suriname (AdeKUS) who together with SBB are authors of the study,
and The Nature Conservancy (TNC) and the University of Florida for new research.
National circumstances: The National Planning Office for coordinating and publishing the National Development Plan 2017-2021, Strategic
Environmental Advice (AAE) for supporting the development of scenarios and the Suriname National REDD+ Strategy in close
collaboration with a national team, and national stakeholders who validated the scenarios.
Overall: All the national stakeholders including the REDD+ Project Board and the REDD+ Assistants Collective of indigenous and tribal
community representatives who asked questions and contributed in debates around the FREL. The Forest Carbon Partnership Facility
(FCPF) for funding and the United Nations Development Programme (UNDP) as delivery partner for Suriname’s REDD+ readiness project.
UNFCCC and other countries for all the FREL/FRLs online serving as inspiration and learning tools. UN-REDD for the REDD+ Academy and
all contributors to south-south collaboration in the region. Office of the President’s Coordination Environment for final review, approval
and submission of Suriname’s first FREL to the UNFCCC.

                                                                                                                                           1
Foreword
Suriname is located in the globally important Amazon forest and the biodiversity hotspot of the
Guiana Shield. The country wishes to maintain its status as one of the world’s most forested countries.
In this context, reducing emissions from deforestation and forest degradation and the role of
conservation, sustainable management of forests and enhancement of forest carbon stocks (REDD+)
is seen as a tool for sustainable development. Through the REDD+ readiness phase, Suriname has
been successful in building capacity to estimate emission factors and produce activity data and has
formulated a national strategy for REDD+ implementation. This Forest Reference Emission Level
(FREL) has been written in-country by a national team, bringing together the most robust national
forest related data available, with policy goals for the country’s future. The purpose of the FREL is to
enable result-based payments for REDD+ implementation that can help steer the current mining
paradigm in Suriname into a more diversified economy with social equity and harmony with nature.
In that way, Suriname can continue as a High Forest Cover and Low Deforestation country (HFLD)
into the future, with its forests offering a global service in terms of climate change mitigation.

The UNFCCC has defined Forest Reference (Emission) Levels (FREL/FRLs) as benchmarks for
assessing each country’s performance in reducing emissions and increasing removals associated
with the implementation of REDD+ activities. The UNFCCC Conference of the Parties in Cancun
(COP16) encouraged developing country parties to contribute to mitigation actions in the forest
sector, in accordance with their respective capabilities and national circumstances, and stated that,
“more broadly, FREL/FRLs are considered relevant to assess the performance of countries in
contributing to mitigation of climate change through actions related to their forests.” According to
UNFCCC COP decision 12/CP.17, developing countries aiming to implement REDD+ activities are
invited to submit a national forest reference level to the secretariat, on a voluntary basis and when
deemed appropriate by the country. The information contained in the submission should be
transparent, accurate, complete and consistent. It should also be developed pursuant to recent IPCC
guidelines as adopted or encouraged by the COP.

The result can be found in this document, which we are pleased to share with the world.

                                                                                                      2
Table of contents

Foreword                                                                   2
Table of contents                                                          3
List of tables                                                             5
List of figures                                                            6
List of acronyms                                                           7
Executive summary                                                         10
1. Introduction                                                           13
2. Context of Suriname                                                    15
3. Scope and scale of the FREL                                            17
  3.1 Scale (geographic area)                                             17
  3.2 Historical time period                                              17
  3.3 Scope of activities                                                 17
4. Information used to construct the FREL                                 18
  4.1 Definitions and information used to construct the FREL              19
  4.2 Compliance with IPCC Guidance                                       21
     4.2.1 Good Practice                                                  22
     4.2.2 Tiers and approaches                                           23
  4.3 Pools / Gases                                                       23
  4.4 Deforestation                                                       24
     4.4.1 Activity data                                                  24
     4.4.2 Source and compilation of data for carbon stocks               27
     4.4.3 Forest stratification                                          29
     4.4.4 Method used to estimate carbon stocks                          30
     4.4.5 Historical emission due to deforestation                       33
  4.5 Forest degradation due to logging                                   34
     4.5.1 Activity data                                                  34
     4.5.2 Emission factors due to forest degradation caused by logging   35
     4.5.3 Historical emissions due to forest degradation from logging    39
  4.6. Total historical emissions                                         40
                                                                           3
4.7 National Circumstances                                                                 41
    4.7.1 General context                                                                    41
    4.7.2 Forest and mining                                                                  43
    4.7.3 Forest and logging                                                                 44
    4.7.4 National Development Plan and REDD+ priorities                                     47
5. Proposed FREL for Suriname                                                                48
6. Proposed improvements                                                                     51
REFERENCES                                                                                   54
ANNEXES                                                                                      57
  Annex 1: List of contributors to this report                                               57
  Annex 2: Multi-stakeholders involved in the LULC mapping and scenario development          59
  Annex 3: Above-Ground carbon by forest type                                                60
  Annex 4: Overview of the inventory plot database                                           62
  Annex 5: Overview of the classes in the Deforestation maps and Post-deforestation LULC maps 65

                                                                                              4
List of tables
Table 1. Percentage of land in Suriname in different tree crown cover classes - Data from Hansen et
al. (2013) ................................................................................................................................................................................... 20
Table 2. Stratified estimated areas and confidence intervals (SBB, 2017c) ................................................. 27
Table 3. Carbon pools and methods to estimate carbon in forest biomass in Suriname ......................... 31
Table 4. Carbon stocks (Mg C ha-1) in the selected pools in each stratum (SBB et al., 2017a) ............ 32
Table 5. Carbon stocks in the selected pools in each stratum............................................................................. 32
Table 6. Emissions due to deforestation for the period 2000-2015 ................................................................ 34
Table 7. Proportion of trees killed based on the damage type from the medium mortality scenario
(Griscom et al., 2014)........................................................................................................................................................... 37
Table 8. Emission factors for logging ............................................................................................................................ 39
Table 9. Emissions due to degradation for period 2000-2015 ........................................................................... 40
Table 10. FREL for Suriname, expressed in yearly CO2-emissions .................................................................. 50

                                                                                                                                                                                              5
List of figures
Figure 1. Situation map of Suriname ............................................................................................................................. 15
Figure 2. Indicative vegetation height for Suriname (WHRC, 2015)................................................................ 20
Figure 3. Overview of the deforestation per district over the periods 2000-2009 and 2009-2015 ... 26
Figure 4. Overview of the forest inventory plots (SBB et al., 2017a) ............................................................... 29
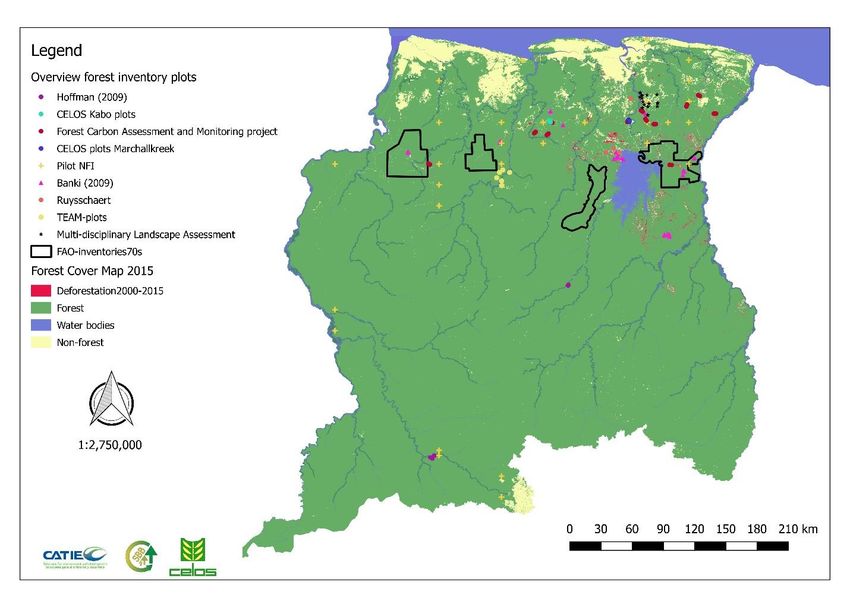
Figure 5. Preliminary stratification of Suriname ...................................................................................................... 30
Figure 6. Timber production for the period 2000-2015 (SBB, 2016) ............................................................. 35
Figure 7. Emissions from forest degradation due to selective logging and emissions from
deforestation over the different periods ..................................................................................................................... 40
Figure 8. FREL projection for Suriname - For the period 2000-2009 the year 2005 has been used
and for the period 2009-2013, the year 2011 ........................................................................................................... 50
6List of acronyms
AAC Annual Allowable Cut
AAE Asesoramiento Ambiental Estratégico / Strategic Environmental Advice
ACT Amazon Conservation Team
ACTO Amazon Cooperation Treaty Organization
AD Activity data
AdeKUS Anton de Kom University of Suriname
AFOLU Agriculture, Forestry and Other Land Use
AGB Above-Ground Biomass
ASGM Artisanal Small Scale Gold Mining
BFAST Break detection For Additive Seasonal Trends
BGB Below-Ground Biomass
C Carbon
CATIE Tropical Agricultural Research and Higher Education Center
CBD Convention on Biological Diversity
CBM Community-based monitoring
CELOS Centre for Agricultural Research in Suriname
CH4 Methane
CHS CELOS Harvesting System
CI Confidence Interval
CI Conservation International
cm Centimeter
CMRV Community Measurement, Reporting and Verification
CO2 Carbon dioxide
COP Conference of the Parties (UNFCCC)
CSNR Central Suriname Nature Reserve
D Diameter (lianas)
dbh Diameter in breast height
DDFDB+ Drivers of Deforestation, Forest Degradation and Barriers to REDD+ activities
DOM Dead Organic Matter
DW Dead Wood
E Emission
EF Emission Factors
EITI Extractive Industries Transparency Initiative
ELE Extracted Log Emissions
eq Equivalent
et al. And others (et alia)
FAO Food and Agriculture Organization of the United Nations
FCMU Forest Cover Monitoring Unit
FCPF Forest Carbon Partnership Facility
FREL Forest Reference Emission Level
FRL Forest Reference Level
FSC Forest Stewardship Council
g Gram
GCCA+ Global Climate Change Alliance
7GCF Green Climate Fund
GDP Gross Domestic Product
GEF Global Environment Facility
GFOI Global Forest Observation Initiative
GHG Greenhouse gas
GIS Geographic Information System
GMD Geological Mining Department
GOFC-GOLD Global Observation of Forest and Land Cover Dynamics
GOS Government of Suriname
GPG Good Practice Guidance
ha Hectare
HFLD High Forest Low Deforestation
Hg Mercury
ibid In the same source as above
ICL Incidental Cutting License
IDB Inter-American Development Bank
INDC Intended Nationally Determined Contribution
INPE National Institute for Space Research in Brazil
IPCC Intergovernmental Panel for Climate Change
km Kilometre
LBB Lands Bos Beheer / State Forest Service
LDF Logging Damage Factor
LDW Lying Dead Wood
LIF Logging Infrastructure Factor
LULC Land Use Land Cover
LULUCF Land Use, Land Use Change and Forestry
m Metre
Mg Megagram (= ton)
MI-GLIS Management Institute for Land Registration and Land Information System
MMU Minimum Mapping Unit
MRV Measurement, Reporting and Verification
MTP Minor Timber Products
MW MegaWatt
N North (latitude)
N2O Nitrous oxide
NFI National Forest Inventory
NFMS National Forest Monitoring System
NH (Min) Ministry of Natural Resources
NIMOS National Institute for Environment and Development in Suriname
NRTM Near Real Time Monitoring
NSC Norwegian Space Centre
NTFP Non-Timber Forest Products
NZCS National Zoological Collection Suriname
ONF French Governmental Forestry Service
ONFI ONF International
PMU Project Management Unit
QA/QC Quality Assurance/Quality Control
8QGIS A free and open source GIS software
R2 R square (statistics)
RAC REDD+ Assistants Collective
REDD+ Reduced Emissions from Deforestation and Forest Degradation and the role of conservation,
sustainable management of forests and enhancement of forest carbon stocks
RIL Reduced Impact Logging
RIL-C Reduced Impact Logging Certification
RO (Min) Ministry of Regional Development
R-PP Readiness Preparation Proposal
SA Skid Trail
SBB Foundation for Forest Management and Production Control
SDW Standing Dead Wood
SEPAL System for Earth observations, data access, Processing & Analysis for Land monitoring
SF Skid Trail Factor
SFM Sustainable Forest Management
SIS Safeguards Information System
SLMS Satellite Land Monitoring System
SOC Soil Organic Carbon
SPS Stichting Planbureau Suriname / National Planning Office
SRD Surinamese Dollar
SU Sampling Unit
TBI Tropenbos International
TEF Total Emission Factor
TNC The Nature Conservancy
TNRS Taxonomic Name Resolution Service
UN United Nations
UNDP United Nations Development Programme
UNFCCC United Nations Framework Convention on Climate Change
UN-REDD United Nations REDD Programme
US$ United States Dollar
WHRC Woods Hole Research Center
yr Year
9Executive summary
This document presents the first national Forest Reference Emission Level (FREL) for Suriname to
the United Nations Framework Convention on Climate Change (UNFCCC). Suriname’s FREL will serve
as the baseline for measuring emissions reduction from the implementation of activities targeted at
reducing emissions from deforestation and forest degradation, while recognizing the important role
of conservation, sustainable forest management (SFM) and carbon stock enhancement (REDD+)
under a results-based payment framework.
The Suriname National REDD+ Strategy (being finalized) outlines the vision of REDD+ in Suriname
and the policies and measures to be implemented. Suriname aims to implement REDD+ as a tool for
sustainable development, remaining a High Forest Cover and Low Deforestation (HFLD) country,
while still actively pursuing national development goals. Suriname is currently finalizing the REDD+
readiness phase with a grant from the World Bank Forest Carbon Partnership Facility (FCPF)
delivered through the United Nations Development Programme (UNDP).
In accordance with UNFCCC guidelines, Suriname’s REDD+ program including the FREL is being
developed in a manner that is:
● Transparent: with comprehensive and clear documentation of methods and data1;
● Accurate: with estimates of emissions that are accurate and include estimates of uncertainty
represented at the 95% confidence interval (Frey et al., 2006), using the simple propagation
of errors method given in chapter 5 of the IPCC GPG (2003) reporting instructions;
● Complete: providing all information, methodologies and results so that the FREL can be
reconstructed (in agreement with decision 13/CP. 19);
● Consistent: with ‘historical time period’ emissions estimated in a manner that is consistent
and shall remain functionally consistent during the REDD+ program. Methodologies and data
are also consistent with the guidance agreed upon in the UNFCCC COPs.
The current FREL submission is based on best available data, mostly generated by the National Forest
Monitoring System (NFMS), with a transparent analysis of uncertainty and remaining gaps. This
corresponds to Decision 12/CP.17 Paragraph 1. Suriname will update its FREL periodically, based on
new knowledge, new trends and any modification of scope and methodologies.
The following decisions have been made for the FREL:
● The FREL is developed on a national scale;
● Inclusion of the different direct drivers of deforestation: Mining (73%) (of which Artisanal
Small Scale Gold Mining (ASGM) covering ca. 59% of the total deforestation), Infrastructure
(15%), Urbanization (4%), Agriculture (3%), Pasture (1%), Burned area (3%) and other
deforestation (1%) (see annex 5);
1See folder with FREL Suriname background information openly available online:
https://drive.google.com/drive/folders/11AyfuYZUeStfxAiLiusguHO55qGEjsMy?usp=sharing; Geoportal:
http://www.gonini.org/portal/
10● Inclusion of forest degradation caused by logging (ca. 25% of the total emissions);
● The definition of forest used is: “Land covered primarily by trees, but also often containing
shrubs, palms, bamboo, herbs, grass and climbers, with a minimum tree crown cover of 30% (or
equivalent stocking level), with the potential to reach a minimum canopy height at maturity in
situ of 5 meters, and a minimum area of 1.0 ha.”;
● The IPCC pools included in this FREL are: Above-Ground Biomass (AGB), Below-Ground
Biomass (BGB) and Dead Organic Matter (DOM). The pools that are not included, namely
Litter and Soil Organic Carbon (SOC), will be included in a future FREL submission as soon as
relevant data gets available;
● Carbon dioxide (CO2) is the only GHG that has been included in this FREL;
● ‘Historical period’ calculations are based on the fifteen-year timespan from 2000-2015, and
the FREL is established for a period of five years (2016-2020). After these five years, the FREL
will be evaluated and adjusted as necessary.
Suriname’s historical emissions show that the country has a low percentage of both deforestation
(deforestation rate of 0.02-0.05%) and forest degradation, resulting in an effective forest cover of
93% of the land area (SBB, 2017c) and historical emissions of 97,566,122 Mg CO2 (with annual
average of 6,557,411 Mg CO2 for the period 2000-2015). The 95% CI is ± 6,819,188 Mg CO2 or
±6.99% of the mean.
Nevertheless, pressure on Suriname’s forests has steadily increased in recent years, primarily due to
strong incentives for the growth of economic activities from mining, especially artisanal small-scale
gold mining (ASGM). The steady expansion of Suriname’s mining sector has brought economic
growth, but at a significant environmental and public health cost. Forest degradation related to
timber production has also increased, but on the other hand a large area (25%) of the logging
concessions is under a voluntary certification scheme, where companies commit to work in a
sustainable way. The forestry sector could provide many opportunities for a successful
implementation of the REDD+ climate change mitigation approach by promoting sustainable forest
management practices. Production in Suriname’s agricultural sector has remained low in the 21 st
century (2-3% of the deforestation in the period 2000-2015), but a rapid expansion is expected in
the near future due to various projects (e.g., oil palm plantations) planned to boost Suriname’s
development. The Development scenario, that is part of the scenario modeling process executed in
the framework of the Suriname National REDD+ Strategy, was also used to support the
projection of the FREL. The Development scenario considers all the main planned projects, based on
the National Development Plan of 2017-2021 and stakeholder involvement, indicating the future
deforestation that can possibly occur.
Due to this expected increased growth, Suriname is presenting a FREL with a linear growth projection
as an adjustment in calculating its historical emissions. This corresponds with the results found
through the scenario modeling process executed in the framework of the Suriname National REDD+
Strategy. The Development scenario considers all the main planned development projects, based on
the National Development Plan of 2017-2021 and in-depth dialogue with partner institutions and
11stakeholders, indicating that future deforestation is likely to continue increasing. Also the timber
production is expected to continue increasing, at least until it would reach 1,000,000 m3 in 2022 (SBB,
2017d).
Figure. FREL projection for Suriname - For the period 2000-2009 the year 2005 has been used and for the period
2009-2013 the year 2011
Suriname’s FREL corresponds to the following annual CO2-Emissions (Mg CO2-eq per year):
● 2016: 14,441,113 Mg CO2-eq
● 2017: 15,390,853 Mg CO2-eq
● 2018: 16,340,593 Mg CO2-eq
● 2019: 17,290,333 Mg CO2-eq
● 2020: 18,240,073 Mg CO2-eq
To implement the Suriname National REDD+ Strategy, technical and financial support from the global
community will be necessary. Such support will make it possible for the country to diverge, through
a stepwise economic diversification, away from an extractive economy based upon mining. Through
the implementation of the Suriname National REDD+ Strategy, the country will maintain its status as
a HFLD country. This strategy includes improved forest governance (including sustainable forest
management), robust land use planning, forest conservation, and rehabilitation of forest land on
mined out areas.
121. Introduction
Suriname welcomes the opportunity to submit a Forest Reference Emission Level (FREL) for
technical assessment in the context of REDD+ (Reducing Emissions from Deforestation and forest
Degradation and the role of conservation, sustainable management of forests and enhancement of forest
carbon stocks in developing countries) under the United Nations Framework Convention on Climate
Change (UNFCCC). The submission of this first FREL for Suriname is part of the overall REDD+
readiness process of Suriname and this FREL is consistent with the Suriname National REDD+
Strategy (finalized soon). Suriname intends to use REDD+ as an instrument to maintain its status as
a High Forest cover and Low Deforestation (HFLD) country - thus contributing significantly to global
climate change mitigation, being adequately compensated for this global service, and optimizing the
sustainable use of its forest resources for national development.
The vision for REDD+ in Suriname, agreed through a multi-stakeholder process and included in the
draft Suriname National REDD+ Strategy, is:
Suriname’s tropical forest continues and improves its contribution to the national and community
growth, welfare and wellbeing of current and future generations through planning, research,
effective protected areas management and sustainable forest management, resulting in an efficient
use of the forest and natural resources, ecosystem services and the preservation of biodiversity, while
continuing to offer a substantial contribution to the global environment, enabling the conditions for
an adequate compensation for this global service.
Suriname aims to implement REDD+ as a tool for sustainable development and to be eligible for
results-based payments in accordance with decision 9/CP.192. Together with other countries,
Suriname was active in the UNFCCC negotiations to promote inclusion of the “+” activities in the
REDD+ climate change mitigation approach. Suriname’s REDD+ Readiness Preparation Proposal (R-
PP) was approved by the Participants Committee of the World Bank Forest Carbon Partnership
Facility (FCPF) on 21st March 2013. Consequently, Suriname was granted US$3.8 million to support
REDD+ readiness activities in the country. With the UNDP as Delivery Partner, this grant is used for
the project Strengthening national capacities of Suriname for the elaboration of the national REDD+
strategy and the design of its implementation framework, carried out in the period 2014-2018. The
National Institute for Environment and Development in Suriname (NIMOS) is the Implementing
Partner in charge of REDD+ readiness coordination in Suriname. A national REDD+ strategy is being
finalized and a Safeguards Information System (SIS) is under development. The Foundation for
Forest Management and Production Control (SBB) serves as the REDD+ Technical Partner
responsible for preparation of the FREL and the National Forest Monitoring System (NFMS).
2
http://redd.unfccc.int/fact-sheets/forest-reference-emission-levels.html
13In accordance with UNFCCC decision 4/CP.15, this document shows transparently how the FREL for
Suriname has been established, taking into account historical data with adjustment for national
circumstances. Suriname underlines that pursuant to UNFCCC decisions 13/CP.19 (paragraph 2) and
14/CP.19 (paragraphs 7 and 8), the submission of forest reference emission levels (FRELs) and/or
forest reference levels (FRLs), as well as subsequent Technical Annexes with results, are voluntary
and exclusively meant for the purpose of obtaining and receiving payments for REDD+ actions. This
submission therefore does not modify, revise or adjust in any way other actions currently being
undertaken by Suriname.
Formal submission of the FREL is done through the Office of the President’s Coordination
Environment of the Republic of Suriname as the National Focal Point to the UNFCCC, via NIMOS and
SBB. Before its submission, the FREL went through an extensive consultation process with national
stakeholders. This process included the raising of awareness about the FREL and building capacity
of stakeholders to better understand its concept. Technical stakeholders provided substantive
feedback that helped improve the FREL before submission. Special thanks are given to international
experts who supported Suriname in technical preparations and review of the FREL. A list of national
and international reviewers and contributors can be found in annex 1.
Suriname recognizes that the UNFCCC allows for a stepwise approach for development of the FREL.
The current submission is based on best available data, with a transparent analysis of uncertainty
and remaining gaps. The country strives to constantly improve the availability and quality of data
and intends to submit an improved FREL/FRL as needed, taking into account the feedback that will
be provided through the technical assessment on this first submission.
142. Context of Suriname
The forests of Suriname are part of the Amazon and the Guiana Shield region, included in one of the
largest blocks of primary tropical rainforest worldwide and marked by high biodiversity levels. These
forests provide ecosystem services important on global and local levels, including climate change
mitigation, biodiversity preservation, cultural values, livelihoods and food security for communities,
while they also contribute to national incomes of countries in the region (Loftus et al., 2013;
Hammond, 2005; Bart de Dijn et al., 2018). The country is rather small with an official reported land
surface of 163,800 km2 (FAO 2014). Suriname is located on the north-eastern coast of South America,
between 2° and 6° North latitude and 54° and 58° West longitude. It borders French Guiana to the
east with the Marowijne river and the Lawa river, Brazil to the south, Guyana to the west with the
Corantijn river, and the Atlantic Ocean to the north with a very dynamic coastline resulting in land
accretion and decretion (See figure 1). Suriname’s 15.2 million hectares of forest (SBB, 2017c)
represent around 0.9% of the total tropical forest (1.71 billion hectare) in the world (FAO, 2015).
Figure 1. Situation map of Suriname
In terms of conservation, 13.5% of the country’s surface is within protected areas (GOS, 2009).
Suriname is currently drafting a new Nature Conservation Law in a participatory process, to enable
improved management of its protected areas. This law will replace the Nature Conservation Act of
151954. In line with the UN Convention on Biological Diversity (CBD) Aichi targets3, it is expected that
the area with a protective status will expand to at least 17% of the terrestrial land by 2020. This will
lead to the expansion of the national network of legally protected areas to accomplish 100%
representation of all ecosystems and biological species, according to the National Biodiversity Action
Plan (Ministry of Labour, Technological Development and Environment, 2013), the National Forest
Policy (2005) and the draft Suriname National REDD+ Strategy.
The annual deforestation rate in Suriname has historically been very low (0.02% for the period 2000-
2009). However, due to an increased demand for natural resources, especially gold, the rate
increased from 0.02% to 0.05% in average in the period 2009-2015, and is expected to continue
increasing (SBB, 2017c).
The current main driver of deforestation is mining (mainly for gold), especially Artisanal Small Scale
Gold Mining (ASGM) (ca. 80% of all mining activities) (SBB, 2017c). In addition, for the future, several
proposed infrastructure projects could cause some unavoidable planned deforestation in the interest
of the country’s development. The Nassau mining project and the Grankriki hydropower lake are
examples of projects with infrastructure activities. The intention to conditionally remain a HFLD
country was also mentioned in the Intended Nationally Determined Contribution (INDC)4 and is in
line with the draft Suriname National REDD+ Strategy. For this to be possible without hampering
national development, adequate compensation for the global climate mitigation service is necessary.
Commercial timber logging in Suriname is considered a contributor to forest degradation but not to
deforestation, since only selective logging takes place due to among others the limited number of
commercial tree species, the minimum allowed diameter at breast height to be cut and the promotion
of sustainable forest management (SFM) by the government. The vegetation of Suriname can be
classified into three main types: Hydrophytic, Xerophytic and Mesophytic. The Mesophytic
vegetation, mainly consisting of high tropical lowland forest with a diverse species mix, is considered
the most valuable from a commercial perspective (Van der Hout, 2008). Commercial logging is taking
place only north of the 4° N latitude within the forest belt, covering an area of 4.5 million hectares, of
which ca. 2.5 million ha are currently issued under logging licenses (www.sbbsur.com, August 2017).
Logging impacts could be reduced by following Sustainable Forest Management (SFM) guidelines,
including the enforcement of the Code of Practice for sustainable logging (including Reduced Impact
Logging). This yet needs to be finalized and enforced (National Forest Policy, 2005; draft Suriname
National REDD+ Strategy). Applying these guidelines enables maintenance of other forest functions
such as protection of water and soil, maintenance of biodiversity, carbon sequestration and erosion
control (Werger et al., 2011; Putz et al., 2012).
3
https://www.cbd.int/sp/targets/default.shtml#GoalC, accessed on 27-11-2017
4
Accessible at: http://www4.unfccc.int/submissions/INDC/Published%20Documents/Suriname/1/INDC-2-
Suriname%20300915.pdf
163. Scope and scale of the FREL
In line with decisions 4/CP.15, 12/CP.17 and 13/CP.19, countries preparing their FREL/FRL need to
consider and make choices on, among others, the scale or geographic area covered, historical time
period and scope of REDD+ activities included. This section presents and motivates decisions made
on the scope and scale for this first FREL submission for Suriname.
3.1 Scale (geographic area)
Suriname is submitting a national FREL, because the government structure of the country is
centralized and most data is available on the national level.
3.2 Historical time period
The historical reference period used for the first FREL in Suriname is 2000-2015. For this period,
robust and locally produced information is available in terms of Activity Data (AD) linked to
deforestation as well as to logging related forest degradation. This period was separated in four time
intervals based on the availability of deforestation data: 2000-2009, 2009-2013, 2013-2014 and
2014-2015. These time intervals are of a different duration because the national deforestation maps
were made as a contribution to regional Amazon deforestation maps5. Activity data (AD) for forest
degradation due to logging (timber production) are available on an annual basis, but this data has
been aggregated in the time intervals mentioned above.
3.3 Scope of activities
Deforestation
There are several drivers of deforestation in Suriname, as presented in the Background Study for
REDD+ in Suriname: Multi-perspective analysis of Drivers of Deforestation, Forest Degradation and
Barriers to REDD+ activities (DDFDB+ study, SBB et al., 2017b), the main ones being:
1. Mining;
2. Infrastructure;
3. Urbanization;
4. Agriculture.
All these drivers are included and reported upon in the total deforestation assessed in the Technical
report: Forest cover monitoring in Suriname using remote sensing techniques for the period 2000-2015
(SBB, 2017c). This FREL is based upon these reports.
5
Within the project of the Amazon Cooperation Treaty Organization (ACTO): “Monitoring the forest cover of
the Amazon region”
17Forest degradation
As presented in the DDFDB+ study (SBB et al., 2017b), the drivers of forest degradation in Suriname
are:
1. Mining (mining itself is deforestation, but degradation takes place in its vicinity);
2. Logging activities;
3. Shifting cultivation;
4. Fire.
A natural cause of forest degradation is windbreaks, but because of their natural character, they are
not included here.
Taking into account the available data, as well as the estimated contribution of different sources of
degradation to the overall CO2 emissions, Suriname will only include logging as a source of forest
degradation in its first FREL. Methodologies are currently being developed to quantitatively assess
the emissions due to the other drivers of forest degradation, to be included in a future submission.
Conservation, sustainable management of forests and enhancement of forest carbon stocks
The three “+” activities of REDD+ – conservation, sustainable management of forests and
enhancement of forest carbon stocks – are generally highly relevant for HFLD countries and are all
included in the draft Suriname National REDD+ Strategy. The removals resulting from carbon stock
enhancement has not been included in this first FREL, because there are limited historical activities
that can be used to determine these removals. It is part of the description of national circumstances
and the aim is to include these in the next FREL/FRL submission.
4. Information used to construct the FREL
All information used to quantify deforestation and emission factors due to deforestation and forest
degradation are originating from the multipurpose National Forest Monitoring System (NFMS) (SBB,
2017).
The NFMS includes a Measuring, Reporting and Verification (MRV) function and other monitoring
functions. Suriname’s NFMS is composed of an operational Satellite Land Monitoring System (SLMS)6,
a National Forest Inventory (NFI), a Sustainable Forest Management monitoring component (SFM),
a Near Real Time Monitoring system (NRTM) and several cross-cutting activities (e.g. mangrove
monitoring), with broad participation of other institutions and stakeholders. The NFMS will also
include community based monitoring (CBM/CMRV), to ensure that national and local initiatives are
supporting each other. Guiding principles for the NFMS in Suriname include national ownership,
6
Capacity for satellite land monitoring has been built up in Suriname through the Amazon Cooperation Treaty Organization
(ACTO) project ‘Monitoring the Forest Cover in the Amazon Region’, through which a Forest Cover Monitoring Unit (FCMU)
was established in 2012 and officially launched in 2013.
18open data accessibility and transparency, cost efficiency, and adaptation to context (e.g. different
contexts require a different monitoring approach) (SBB, 2017).
According to Decision 12/CP.17, developing country parties implementing REDD+ can use a stepwise
approach to construct reference levels, incorporating better data, improved methodologies and,
where appropriate, additional pools. Forest Reference (Emission) Levels should be updated
periodically, taking into account new knowledge, new trends and any modification of scope and
methodologies. The NFMS will continue to serve this purpose in Suriname7.
4.1 Definitions and information used to construct the FREL
Forest definition for Suriname
While Suriname has a forest definition in its Forest Management Act (1992), this definition is meant
for administrative purposes. Therefore Suriname has chosen to monitor forest based on nationally
appropriate criteria chosen in line with the Marrakesh Accords (UNFCCC, 2001)8:
Land covered primarily by trees, but also often containing shrubs, palms, bamboo, herbs, grass and
climbers, with a minimum tree crown cover of 30% (or equivalent stocking level), with the potential to
reach a minimum canopy height at maturity in situ of 5 meters, and a minimum area of 1.0 ha.
The forest definition in Suriname excludes:
1. Tree cover from trees, including palm trees, planted for agricultural purposes (such as coconut,
citrus, oil palm etc);
2. Tree cover in areas that are predominantly under urban or agricultural use.
It should be noted that shifting cultivation (slash and burn agriculture) is included as forest, as long as
it is done in a traditional way so that the forest gets the chance to grow back after harvest.
The administrative definition in the Forest Management Act (1992) will need to be adjusted and
improved based on the above mentioned criteria. For reporting done within the FAO Forest Resource
Assessment 2015, the above-mentioned criteria to define forest is applied. This will also be
implemented for the next Greenhouse Gas Inventory.
7
For more information, see the NFMS Roadmap - Status and Plans for Suriname’s National Forest Monitoring System (SBB,
2017). Available data can be found on the Geoportal http://www.gonini.org and in published reports.
8
Under the Marrakesh Accord (UNFCCC, 2001), forest is defined as having a minimum area of land of 0.05-1 ha with tree
crown cover (or equivalent stocking level) of more than 10-30% with the potential to reach a minimum height of 2-5 m at
maturity in situ.
19The choice of parameters for the national forest definition are based on the following considerations:
a) Minimum canopy height (Vegetation height)
Based on the characteristics of Suriname’s forest, which is mainly undisturbed, most trees are higher
than 5m. Based on the Detailed Global Tree Height Estimates across the tropics (WHRC, 2015) only
2.2% of the vegetation in Suriname is less than 5m high (See figure 2). This corresponds with general
field observations.
Figure 2. Indicative vegetation height for Suriname (WHRC, 2015)
b) Minimum tree crown cover
An assessment of Suriname’s tree crown cover (table 1) shows that using a minimum tree crown
cover of 10% compared to 30% does not influence the total forest cover area significantly (only 0.2%
of the land area has a tree crown cover of between 10% and 30%). The main driver of forest
degradation is selective logging, which takes place in ca. 30% of the country’s area. Since only a few
trees (1-5) per ha are removed during selective logging, it is unlikely that this activity will cause a
tree crown cover of less than 30%.
Table 1. Percentage of land in Suriname in different tree crown cover classes - Data from Hansen et al. (2013)
% Tree cover 0-10 10-20 20-30 30-40 40-50 50-60 60-70 70-80 80-90 90-100
% land 4.1 0.11 0.09 0.1 0.13 0.23 0.07 0.2 1.68 93.31
20c) Minimum area
Because of the abundance of forest in Suriname, most forest patches are larger than 1 ha. This
assumption was confirmed by the results of a quick analysis on the global forest cover change data
(Hansen et al., 2013). Therefore the minimum area will be the same as the Minimum Mapping Unit
(MMU) of 1 ha.
Tree cover from trees, including palm trees planted for agricultural purposes (such as coconut, palm oil,
citrus etc.), is excluded from the definition as is indicated by table 4.2 in the IPCC guidelines (2006).
When distinguishing between the definition of forest and trees planted for agricultural purposes, the
determining factor should be the type of management: forests are subject to extensive management
and agricultural crops are the result of intensive management.
Tree cover in areas that are predominantly under urban or agricultural use is excluded from the
definition because of its land use designation. An example of this is the Palmentuin palm garden (4
ha) in central Paramaribo.
Shifting cultivation is included in the national definition of forest, but conversion of primary forest to
shifting cultivation is seen as forest degradation (forest land remaining forest land). Shifting
cultivation is a type of small-scale farming that involves clearing the land, burning the plant material,
planting and harvesting the crops, and then abandoning the land to go fallow. In the Surinamese
situation, shifting cultivation plots are traditionally cultivated for 1 to 3 years and fallow periods vary
from 3 to 15 years, letting the forest regenerate on the abandoned land (Helstone and Playfair, 2014).
According to Ribeiro Filho et al. (2013), in most cases shifting cultivation can be seen as a sustainable
activity without long-term negative impact on the soil and where fallow periods, which are long
enough, mimic forest ecosystems. The forest dependent indigenous and tribal communities clearly
indicate that shifting cultivation is a traditional and sustainable use of the forest (Gomes-Poma and
Kaus, 1992; AAE and Tropenbos International Suriname 2017). Analysis conducted by SBB, using
multi-year forest loss data (Hansen et al., 2013) has shown that most shifting cultivation patches
(>90%) are smaller than the minimum mapping unit of 1 hectare. It should be noted that in
Suriname’s 2nd National Communication to the UNFCCC on GHG inventory, the conversion of
primary forest land to shifting cultivation was classified as the conversion from forest land to
cropland. This will be updated and streamlined when submitting the 3rd National Communication.
4.2 Compliance with IPCC Guidance
Decision 12/CP.17 annex states that information used to develop a reference level should be guided
by the most recent IPCC guidance and guidelines. Therefore, the IPCC 2003 Good Practice Guidance
for Land Use, Land-use Change and Forestry (GPG-LULUCF) and the IPCC 2006 Guidelines for
National Greenhouse Gas Inventories: Agriculture, Forestry and Other Land use (AFOLU) were used
for technical guidance during the formulation of this FREL.
214.2.1 Good Practice
To ensure the quality of GHG inventories, the IPCC guidelines 2006 provide a set of good practices
that Suriname applied as follows:
- Transparency: FREL Suriname background information is openly available online9. All
spatially explicit information on forest cover change is available through the open-access
geoportal www.gonini.org. There is a multi-stakeholder collaboration (annex 2) in the
development of national Land Use Land Cover (LULC) Maps and an exchange of data between
these stakeholders, which promotes transparency regarding spatial data in Suriname.
Reports and documents on spatial and non-spatial information such as Emission Factor (EF),
Timber production and Forest Inventory data are published and disseminated through the
website of the National REDD+ Program (www.surinameredd.org) and the website of the SBB
(www.sbbsur.com).
- Accuracy: Area estimations based on remote sensing are generated following the good
practices recommended by Olofsson et al. (2014) and GFOI (2016) and the tools developed
by FAO (2016). When new data on emission factors and carbon stocks were collected, field
protocols were developed and implemented in the field. To reassure the quality of the field
measurements, field plots were reassessed. In case of large deviations, the plots were re-
measured by the field teams. The accuracy of the timber production is determined based on
expert estimations.
- Completeness: All methodologies used, intermediate results and decisions made are
presented and documented so that is possible to reconstruct the FREL (in agreement with
decision 13/CP.19).
- Consistency: The FREL and the Suriname GHG national inventories are not consistent yet,
but they will be in the future. Suriname’s 1st National Communication was formally
submitted to the UNFCCC on 27 March 2006 and the 2nd (based on 2008 data for the GHG
inventory) was submitted on 15 March 201610. This FREL does not fully coincide with the
National Communications GHG inventory. Because the forest related emissions within the
GHG inventory were determined before the NFMS was established, these emissions were
estimated based on expert knowledge and research. Since the NFMS became operational,
regular numbers are available on the forest cover change using well described national
methodologies, and additional data was collected and processed on emissions due to
selective logging and carbon stocks. The subsequent GHG inventories will use the data
provided by the NFMS. Another example is that the national forest definition has been
updated in the FREL. The new forest definition will be used in a consistent manner for the 3rd
National Communication and other forthcoming documents. The national staff responsible
for the NFMS and FREL has developed strong capacity by designing methodologies and
procedures and building the different data collection components in-house, with support
from international partner organizations. This assures consistent application of the
methodologies in the future.
9 https://drive.google.com/drive/folders/11AyfuYZUeStfxAiLiusguHO55qGEjsMy?usp=sharing
10
http://unfccc.int/resource/docs/natc/surnc2.pdf
224.2.2 Tiers and approaches
A system of tiers and approaches has been developed by the IPCC to represent different levels of
methodological complexity. Tier 1 is the basic method, Tier 2 is intermediate and Tier 3 is the most
demanding in terms of complexity and data requirements (Chapter 4, IPCC guidelines 2006). Activity
Data are assessed using three different approaches: Approach 1: total land-use area, no data on
conversions between land uses; Approach 2: Total land-use area, including changes between
categories; Approach 3: Spatially-explicit land-use conversion data (Chapter 3, IPCC guidelines
2006). Suriname is currently operating mostly at Tier 2 and Approach 3 level by:
- Annual wall-to-wall monitoring of the Activity Data (AD) using Landsat imagery, following a
standard protocol and applying the methodology recommended by Olofsson et al. (2014) for
land-use and land-use change area estimations. This is according to Approach 3.
- Activity data are disaggregated by drivers of deforestation for three periods. This has been
done using ancillary data and field experience from multiple institutions. Throughout this
process, guidelines for the visual interpretation of the different land use and land cover
classes (LULC) were developed and adjusted (SBB, 2017c). This is according to Approach 3
(the resulting land use change matrices are presented in annex 5).
- While no National Forest Inventory (NFI) has been carried out covering the the whole
country, the forest carbon stocks have been assessed by assembling a national database
bringing together data from 208 forest inventory plots scattered over the country. Within this
database, above-ground biomass and dead wood were assessed according to Tier 2, based on
national data, but using pantropical allometric estimates. Belowground biomass was
assessed using Tier 1.
- To calculate the emissions due to logging, a field procedure was developed and carried out in
ten locations using a randomly stratified approach; where 200 felled trees were measured,
150 skid trail plots were established, 100 log yards and 200 road widths were measured, haul
roads within nine concessions were partly mapped and skid trails were mapped and
measured in about 550 ha of logging units. These emission factors are considered Tier 2.
Suriname will take steps for gradual improvement towards a combination of Tier 2 and Tier 3 (see
chapter 6).
4.3 Pools / Gases
For deforestation, the following carbon pools are included in this FREL for Suriname:
● Above-Ground Biomass of trees, palms and lianas (AGB);
● Below-Ground Biomass of trees (BGB);
● Dead Wood (DW).
Litter
Based on Crabbe et al. (2012), litter contributes ca. 2-6% to the total carbon stock. This includes 1-
5% lying dead wood (with diameter larger than 5 cm), which is included within the FREL (Table 4).
This means that the remaining litter component contributes less than 5% to the total emissions.
23Because of no reliable complete national dataset, as well as the presented estimations showing that
the contribution of litter smaller than 5 cm is not significant, litter is not included in this FREL.
National data will be collected during the coming years, when the national forest inventory will be
carried out.
Soil Organic Carbon
Based on Crabbe et al. (2012) Soil Organic Carbon (depth 0-30 cm) contributes ca. 14% to the total
carbon stock. Nevertheless this dataset was collected only for a very limited sample, for a limited part
of the country. Because no further national data was available, Soil Organic Carbon was not included
in this FREL.
For forest degradation the following pools are included in the FREL:
● Above-Ground Biomass of trees and palms(AGB);
● Below-Ground Biomass of trees (BGB);
● Dead Wood (DW).
For forest remaining forest land, the Tier 1 approach assumes that Soil Organic Carbon and litter are
in equilibrium. Changes in carbon stock are assumed to be zero.
Gases
The only GHG that is included in this FREL is carbon dioxide (CO2). While some of the drivers of
deforestation and forest degradation may also result in the emissions of N 2O and CH4, insufficient
national data is available for these gases to be included. CH4 will be especially released when swamp
area or mangrove forest are deforested. Nevertheless the swamp area being deforested is
approximately less than 1% of the total deforestation.
4.4 Deforestation
4.4.1 Activity data
Activity data (AD) for deforestation are estimated from the forest basemap of year 2000 and the
historical assessments of deforestation for the periods 2000-2009, 2009-2013, 2013-2014 and 2014-
2015. These maps were developed by the Forest Cover Monitoring Unit (FCMU), located in SBB,
through support of the Amazon Cooperation Treaty Organization (ACTO) project “Monitoring the
Forest Cover of the Amazon region”, in collaboration with international experts (INPE, UN-REDD, ONFI
and CI) and national stakeholders. The periods were adapted based on the input to be provided for
the regional Amazon maps.
For the wall-to-wall mapping and monitoring of the basemap 2000 and all deforestation maps,
Landsat satellite images with a resolution of 30m were used (Landsat 5, 7, 8). The method used to
produce the maps is a semi-automatic classification in QGIS using Orfeo Toolbox (Inglada and
24Christophe, 2009), followed by a post-processing step in TerraAmazon (GIS software developed by
INPE), where the classes were visually checked and adjusted where necessary (SBB, 2017c).
Using Landsat satellite images for the monitoring of the forest cover is a challenge, due to the
fluctuation in cloud coverage on these images leading to possible underestimation of the
deforestation. In order to minimize this underestimation, a method was established to fill the cloudy
areas with more available data.
All methodological details regarding map construction and analysis of satellite imagery are described
in the technical report “Forest cover monitoring in Suriname using remote sensing techniques for the
period 2000-2015” (SBB, 2017c). Figure 3 shows an overview of the deforestation per district over
the periods 2000-2009 and 2009-2015. This data can also be viewed on the website www.gonini.org,
having the ability to zoom in and out for a better view of the data and separating the periods 2000-
2009, 2009-2013, 2013-2014 and 2014-2015.
The areas of deforestation were determined based on the results of the map accuracy assessment, as
suggested by Olofsson et al. (2014), Global Forest Observation Initiative (GFOI), Global Observation
of Forest and Land Cover Dynamics (GOFC-GOLD) and Norwegian Space Centre (NSC) (Proceedings
of workshop, 2017).
The accuracy assessment was carried out with support of the UN-REDD program using the manual
developed by the FAO (2016). The method includes a set of “Good Practice” recommendations for
designing and implementing an accuracy assessment of a change map and estimating area based on
the reference sample data. These “Good Practice” recommendations address the three major
components: sampling design, response design and analysis using an on-screen review with remote
sensing imagery (Olofsson et al., 2014). The process is broken down into Quality Assessment/Quality
Control (QA/QC) of four major components: (i) Final map, (ii) the sampling design, (iii) the response
design and (iv) the analysis.
The accuracy assessments of the forest cover change data for the periods 2000-2009, 2009-2013,
2013-2014 and 2014-2015 took place with guidance from UN-REDD/FAO, and in close collaboration
with SBB and the Centre for Agricultural Research in Suriname (CELOS). The OpenForis tools such as
Collect Earth, Stratified Area Estimator Design and Analysis, were used to carry out the accuracy
assessment. Also the System for Earth observations, data access, Processing & Analysis for Land
monitoring (SEPAL), an on-the-cloud processing system, was used to adjust scripts for the analyses.
The results show an overall accuracy of 99%. The stratified estimated areas will be used in further
calculations (See table 2).
25Figure 3. Overview of the deforestation per district in Suriname over the periods 2000-2009 and 2009-2015
26Table 2. Stratified estimated areas and confidence intervals (SBB, 2017c)
Stratified estimated area (ha) 95% confidence interval (ha)
Deforestation 2000-2009 33051 5361
Deforestation 2009-2013 32071 2388
Deforestation 2013-2014 15757 2082
Deforestation 2014-2015 9442 1620
For the years 2009, 2013 and 2015, Post-deforestation Land Use Land Cover (LULC) maps have been
created where the LULC classes (see annex 5) were determined through multi-sectoral collaboration.
The main driver of deforestation is mining (mainly gold mining). Gold mining covers about 71% of
the deforestation for the period 2000-2015 (SBB, 2017c). According to the regional study where the
impact of gold mining on the forest cover in the Guiana Shield region was assessed, the rate of gold
mining has doubled when comparing the periods 2000-2008 and 2008-2014 (Rahm M. et al., 2015).
Based on a general assessment, 80% of the gold mining areas are artisanal small scale gold mining
(ASGM). The other two main drivers of deforestation for the period 2000-2015 are infrastructure
(15%) and urbanization (4%) (SBB, 2017c). Land use change matrices have been created for the
period 2009-2013 and 2013-2015, indicating the transformation of the forest and the LULC classes
between the given years with the amount of area in ha (see annex 5).
Deforestation or conversion from forested land to other types of land is monitored in Suriname using
the IPCC Approach 3 (See annex 5 - Overview of the classes in the Deforestation maps and Post-
deforestation LULC maps).
4.4.2 Source and compilation of data for carbon stocks
Within the country’s REDD+ readiness phase, a study was carried out bringing together data from
eleven different forest inventory programs as shown in figure 4 (more details on the inventories can
be found in annex 4). This study, Technical Report State-of-the-art study: Best estimates for emission
factors and carbon stocks for Suriname done by SBB in collaboration with CATIE, CELOS and AdeKUS
(SBB et al., 2017a) was an update of earlier work carried out by Arets et al. (2011), completed with
the data collected in 12 field transects established during the Forest Carbon Assessment and
Monitoring project (SBB., 2012) and the data collected in 31 Sampling Units (SU) throughout the pilot
NFI project in 2013-2014.
The forest inventory databases went through a harmonization process, including a QA/QC
component, making sure that all data were comparable, after which they were merged into one
database. The first step in performing data quality control was to unify criteria for identifying and
standardizing of categorical and numerical variables. This included unifying the names of the
variables, encoding variables and converting the numerical value of dbh and height to the same
27You can also read