GIS Excellence Awards 2018 - November 7, 2018 - Fairfax County
←
→
Page content transcription
If your browser does not render page correctly, please read the page content below
GIS Excellence
 Awards 2018

 November 7, 2018

GIS Excellence Awards 2018

                      CONTENTS
     I.     Agenda

     II.    Awards Category Descriptions

     III.   Complete List of Excellence Awards

            Entries

     IV.    Awardees by Category with Project

            Description

Page 2Page 2
Agenda
1.   Opening Introduction

     Wanda Gibson
     Chief Technology Officer, Director,
     Department of Information
     Technology

2.   Featured Speakers

     Chairman Sharon Bulova
     Fairfax County Board of Supervisors

3.   Presentation of Awards

     Sharon Bulova
     Wanda Gibson

4.   Closing

                                         Page
                                         Page 33
Page 4Page 4

Foreword
The use of GIS technologies in the County has led to the work you
see honored here at the GIS Excellence Awards and posted in the
Awards Gallery.

As part of the GIS Day celebrations, the GIS Excellence Awards are
given annually for outstanding uses of GIS technology by Fairfax
County employees and agencies. The awards were created to rec-
ognize and celebrate those County employees and agencies that are
effectively and innovatively using GIS technology. This year, 35
submissions were received for the six categories of recognition.

As with previous years, a judging panel from outside Fairfax Coun-
ty Government donated many hours of their time evaluating the
entries. This year, judges were from Fairfax City GIS, George Ma-
son University and Northern Virginia Community College.

The awards have three categories recognizing individual and/or
team accomplishments and three categories recognizing agency ac-
complishments. The following section lists the categories and their
descriptions.

                                                            Page
                                                            Page 55
Awards
       GIS Day     Category Descriptions
               Excellence      Awards 2018
                     Individual/Team Categories
        First, Second and Third Place Awards for Each Category

    Best GIS Cartographic Product/Presentation
    This award is intended to showcase the power of GIS tools in creat-
    ing accurate, instructive, and visually-pleasing maps. Criteria used
    to evaluate the entries include:
    • clarity of purpose and intent
    • the use of GIS tools, methods, and operations to go beyond
        basic cartography
    • visual balance and appeal
    • inclusion of necessary map elements and conventions
    • quality control for typos or other errors

    Best Use of GIS for Analysis
    This award is intended to showcase the power of GIS tools in
    undertaking sophisticated spatial analyses that aid County opera-
    tions and answer significant questions. Criteria used to evaluate the
    entries include:
    • complexity of analysis; use of tools, scripting, model-builder,
        etc.
    • ingenuity/creativity/originality of GIS methods used
    • project benefits to a team or department
    • effective demonstration of the information and insight gained
        (e.g., diagrams, maps, presentations, report, text)

Page 6Page 6
Best Web Application
This award is intended to showcase the ever-increasing presence of
GIS web applications. Whether on the intranet or internet, these
applications are a significant foundation for bringing maps, geospa-
tial data, and tools to a varied audience of County staff and resi-
dents. Criteria used to evaluate the entries include:
• effectiveness of the web application in meeting stated purpose
• benefit to the public and/or agency
• incorporation of application into business practices
• aesthetics and ease of use
• use of well thought-out cartography
• inclusion of innovative and unique tools

                       Agency Categories
                  Awards Presented to Agencies

Most Significant Data Contributor
This award is presented to the agency that has created or refined
the most significant spatial data for the County. Criteria used to
evaluate the entries include:
• significance of the data for the county and/or agency
• importance to agency’s long-term business processes
• level of effort required to create/maintain the data
• sophistication of process to create/maintain the data

                                                              Page
                                                              Page 77
GIS
     Best       Day
           Use of GIS forExcellence
                           Public Outreach        Awards 2018
     This award is presented to the agency that best utilizes GIS to Serve
     the Public with map doscuments, customer service operations,
     press relations, or public events. Criteria used to evaluate the en-
     tries include:
     • effectiveness of the GIS work to the ourteach effort
     • degree to which a difficult message was clearly communicated
     • complexity of cartography, data analysis, customization and/or
          programming
     • adapatability to future expansion/modification
     • contribution of GIS as a planning tool for the outreach effort

     Best GIS Integration (two awards)
     This award is presented to the agency that has integrated GIS into
     their operations to the greatest degree. Agencies
     that have a long history of GIS, as well as agencies that are in the
     beginning stages of GIS integration, will be
     evaluated separately. Criteria used to evaluate the entries include:
     • effectiveness of the integration in meeting its stated goal
     • increased use of GIS in the agency, either directly or through
         agency-generated GIS products
     • increased agency efficiency as a result of GIS
     • demonstration of significant effort to train staff in GIS
     • ingenuity/creativity/originality of GIS methods utilized
     • ability to gain insights into data/project/issue as a result of the
         integration
     • potential for further GIS-related growth

Page 8Page 8
Excellence Award Entries
                          (alphabetically by title)

Advanced Civil Enforcement System (ACES) - Kimberly Ramm, Sheriff ’s Office
Aerial Imagery and Computer Assisted Mass Appraisal - Yorka Crespo, Tax
Administration
As-Built Sharing Integration - Yilia G. Vega-Claudio, Capital Facilities
Creating Data Driven Mapping Applications to Communicate Economic Success
in Fairfax County - Joseph L. Bui, Office of the County Executive
Cross Jurisdictional Comparison of Key Indicators - Sophia Dutton, Office of
Strategy Management for Health and Human Services
CSB PACT and PACT Eligible Population - Laura Haggerty-Lacalle, Community
Services Board
CSB Priority Population Maps - Laura Haggerty-Lacalle, Community Services
Board
DCCS Inspection Enforcement Branch – Implementation of Expanded Inspection
Program - Praveen Tewari, Cable and Consumer Services
Ellanor C Lawrence Park Trail Maps - Andrew DeLuca, Park Authority
Embark Richmond Highway Story Map - Alexis Robinson, Department of Planning
& Zoning
The Evolution of North Hill - Navneet Sohi, Housing & Community Development
Fairfax County Government Center Campus Stormwater Management Facilities -
Matthew D. Kaiser, Public Works Director’s Office
FRD Emergency Response Maps for the Fountainhead Regional Park Mountain
Bike Trails - David May, Fire and Rescue
FRD Management System for Emergency Vehicle Preemption (EVP) Program -
Yong Kim, Fire and Rescue
Guidelines For Development: Reston Transit Station Areas - Christopher
McCarthy, Office of Community Revitalization
Heritage Building Client Access for 2017 Fiscal Year - Dennis Rojsuontikul, Health
Department
Integrating GIS into Land Development Services - Brett Martin,
Land Development Services
Land Survey Branch’s Contribution to National Geodetic Survey “GPS on Bench
Marks” - Yilia G. Vega-Claudio, Capital Facilities
Medallion - Sophia Dutton, Office of Strategy Management for Health and Human
Services
Mobile Mosquito Management - A GIS Mobile App Initiative - Lauren
Lochstampfor, Health Department
                                                                         Page
                                                                         Page 99
Northern Virginia Training Center Line of Sight Analysis - Daniel E. White,
        GIS Day Excellence Awards 2018
    Department of Planning & Zoning
    Opportunity Zones - Sophia Dutton, Office of Strategy Management for Health and
    Human Services
    OSM GIS Integration - Sophia Dutton, Office of Strategy Management for Health
    and Human Services
    Reston Safe December DWI(D) Enforcement and Education Initiative - Brandi T.
    Horita, Police
    Routine Mosquito Trap Sites 2018 - Lauren Lochstampfor, Health Department
    Services for Older Adults and Persons with Disabilities - Sophia Dutton, Office of
    Strategy Management for Health and Human Services
    Site Analysis Case Tracking Application - Dahae Hwang, Fire and Rescue
    STAMP Program Web Application - Lauren Lochstampfor, Health Department
    Transportation Plan Data - Thomas A. Wampler, Department of Transportation
    Use of ArcGIS 3D Analyst and the Fairfax County 2009 Digital Elevation Model
    for Walkway Preliminary Engineering Design - Daniel C. Stevens, Department of
    Transportation
    Utilizing Collector for ArcGIS, a GoPro, a Bike, and an Intrepid Intern to Rapidly
    Assess Hundreds of Miles of Trails - Keith Appler, Public Works Director’s Office
    Woodglen Lake Emergency Spillway - Chip Galloway, Public Works Director’s
    Office
    Worlds Collide: Roads & Sewers, Utilizing GIS to Analyze Utility Impacts of the
    Transform I-66 Outside the Beltway Project - Tom Grala, Capital Facilities

     Awardees by Category with Project Description
            Best GIS Cartographic Product/Presentation
                             Individual/Team Awardees
    Third Place
    FRD Emergency Response Maps for the Fountainhead Regional
    Park Mountain Bike Trails
    David May
    Fire & Rescue

    Purpose:
    The mountain bike trails at Fountainhead Regional Park and the Bull Run Occo-
    quan Trail are a popular and challenging destination for the region’s mountain bike
    enthusiasts. Unfortunately, these challenging trails also mean bike accidents that
    sometimes require emergency medical responses by Fairfax County Fire and Rescue
    Department (FRD) units and personnel.

    We created these maps to assist in the location of medical emergency victims and to
    determine the fastest access routes and extrication points. Previously, too much time

Page 10
     Page 10
was spent in the woods searching for the mountain bikers who needed assistance.
Even with the cell phone coordinates of the caller obtained by the 911 dispatcher cen-
ter and provided to the first responders, there was difficulty in determining the quick-
est way to the patient and the best way to remove them. Using an internet-connected
device to access trail maps wasn’t the answer. Often cell phone service and internet
connectivity isn’t available due to the terrain and remoteness of the trails. After Fire
Station 41 received a new Utility Vehicle (UTV), we started looking for ways to better
utilize it on the mountain bike trails when responding to emergencies within Foun-
tainhead Regional Park. Hardcopy maps or digital maps stored on standalone devices
was the answer.
The resulting large maps reside in the Battalion Chief ’s and EMS Supervisor’s ve-
hicles. In addition, these detailed maps can be accessed in the field on FRD-issued
iPads as well as at the Department of Public Safety Communications (DPSC) 911
dispatch center. With a more generalized format in smaller size, each fire vehicle also
carries a letter-size printed version.
Process:
The existing publicly available Fountainhead Park trail maps that were previously
carried were accurate trail maps (to scale) but lacked details about points along the
trails that were significant to first responders. We used Fairfax County’s Geographic
Exploration & Mapping (GEM) application and other software tools to create these
maps. The GEM application was used to obtain the background base map image
because it provides a good shaded relief elevation base.
Using the Windows Snip tool, the map extent was snipped from the GEM application
and used as the background image in Visio. For the “Black Trail” map, elevation data
could be custom snipped. Other maps required snipping from individual GEM tiles.
Additional data specific to the mountain bike trails was georeferenced and retraced
onto the elevation background. Finally, additional specific data and the new access
routes were entered using GPS coordinates.
Page
Page 11
11Second Place
GISC Lawrence
Ellanor Day Excellence
Park Trail Maps Awards 2018
Andrew DeLuca, John Shafer
Park Authority
Ellanor C Lawrence Park contains an expansive trail network that is heavily used by
residents. To improve the visitor experience at the park, new trail wayfinding maps
and signage were created and installed at the park. Any out of date data on the exist-
ing trails and trail related facilities were updated via field data collection to provide
the most accurate and up to date maps. Four maps were created for placement at key
trailheads as part of this project. These maps varied in orientation based on which di-
rection trail users would be entering the park. For example, trail users entering from
the North would first encounter a South oriented map to more closely match their
vantage point. Trail and park elements in these maps have been put into focus along
with reference information to provide general orientation. These maps also include
a code which can be provided to 911 dispatch in the event of an emergency to direct
first responders to the caller’s location. Additionally, the maps include a QR code link
to the Trail Buddy web application which provides trail and hiking information for
residents on their smart phone. These new maps are a welcome addition at the park
and provide the county’s residents with better information to improve their hiking
experience.
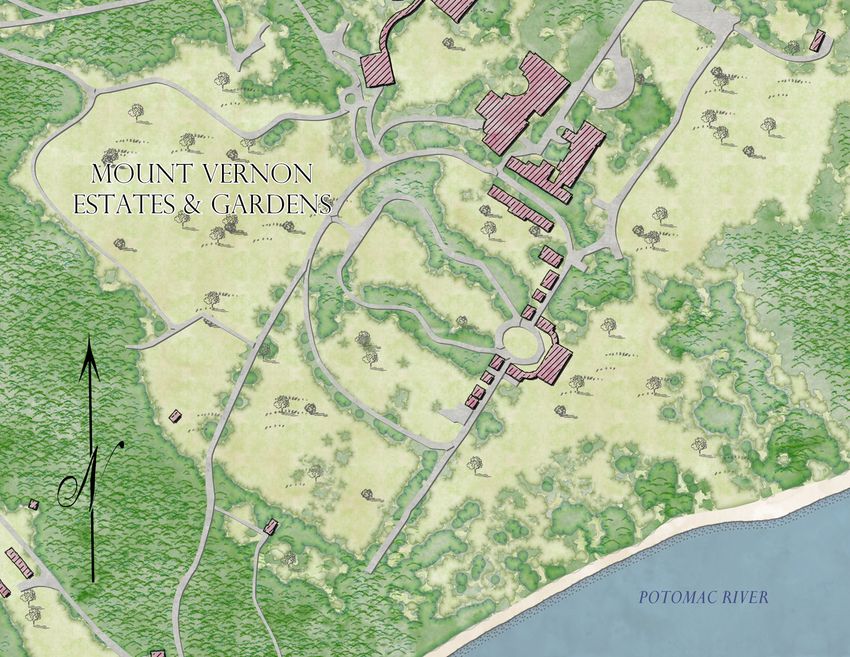
First Place
Routine Mosquito Trap Sites - 2018
Lauren Lochstampfor
Health Department
The Disease Carrying Insects Program (Health Department, Division of Environ-
mental Health) performs weekly adult mosquito surveillance for West Nile virus
from May through October at 74 static locations throughout the County. At all 74
locations, two types of mosquito traps are utilized (CDC Miniature Light Trap and
Gravid trap). A third trap type (BG Sentinel® trap) is set at 29 of the 74 locations.
Mosquito traps are set for 24 hours, requiring two work days for setting and picking
up the traps. For operational consistency, routes are created to divide the trapping
schedule between morning and afternoon routes. The maximum number of traps
per route is currently limited by space available in the trucks that we use. The routes
are set up so that technicians can run a route in the morning, return to the office (lo-
cated in the City of Fairfax) for their lunch break, and then run the afternoon route.
In 2018, using the Network Analyst extension of ArcMap, we created 7 trap routes
based on our existing trap sites. These routes were created using the constraints of
time, the number of traps for each route, and the time spent at each trap location.
Our eighth route was specifically created for a Police training facility, which we per-
form additional services at while setting and picking up traps.
Page 12
Page 12The resulting Routine Mosquito Trap Sites map was created to show all the trap
locations and routes. This map was created as a wall map to use for our operations.
Routes and trap sites are color coordinated. Where routes overlap, hashed colored
lines were used. We can easily glance at to see if there is a BG Sentinel® trap at a site,
the trap site names and numbers, and which major roadways are utilized for each
route. The latter is important when there are traffic incidents and we need to re-route
technicians in the field.
The final maps are laminated and can be written on to add notes, to highlight partic-
ular sites or to point out other locations and their proximity to existing sites.
One additional fun feature of the map that we would like to point out is the utiliza-
tion of our custom DCIP logo as a compass.
Best Use of GIS for Analysis
Individual/Team Awardees
Third Place
Worlds Collide: Roads & Sewers, Utilizing GIS to Analyze Utility
Impacts of the Transform I-66 Outside the Beltway Project
Tom Grala & Team
Capital Facilities
The Transform I-66 project is a $3.7 billion public-private partnership between the
Virginia Department of Transportation, the Department of Rail and Public Trans-
portation, and private partner I-66 Express Mobility Partners. This design-build
project is currently underway and is scheduled for completion in December, 2022.
This project has the potential to impact County owned sewerage facilities in the
project area. Because of the design-build approach and the high-profile nature of the
project, efficient methods to review the impact of the project were needed to balance
the quality of review with timeliness.
The project team assembled to coordinate the review of this project developed meth-
ods to understand where changes related to the project were taking place. A new
geodatabase was established for the project which included a polygon feature class
to relate project activity locations to county sewer assets. GIS analysis for this project
included aspects relating to the county sewage system and analysis related to the I-66
project review process.
When an I-66 review package is received, the county’s existing sewer related GIS
data is used to understand existing pipe attributes and condition. When plans are
Page
Page 13
13reviewed with comments made, or approvals given, our geodatabase is updated to
GIS Day Excellence Awards 2018
track the status of the project. The GIS environment setup for the project allows
team members to analyze the status of the project by understanding color-coded
location status, querying the status of various impacted locations, and using hyper-
links to have access to the latest information. This information serves as the basis
of our understanding of the status of our assets and the potential impact of the I-66
project on our facilities.
The team is currently using this information to administer and analyze the I-66 proj-
ect coordination effort. It is anticipated that use of this information will continue,
with potential further enhancements over the duration of the project through 2022.
Second Place
Northern Virginia Training Center Line of Sight Analysis
Dan White
Department of Planning & Zoning
In the planning phase for the Northern Virginia Training Site located along Brad-
dock Road, staff and the taskforce proposed to create a 3-D model of the site to
visual impacts on the neighboring communities. In the past similar exercises, have
been performed by our GIS staff to visualize the impacts in terms of massing models.
When the idea was brought to our attention, we decided to take it a step further and
utilize the LIDAR data the county acquired to perform a line of site analysis.
In this scenario, we created extruded buildings from the buildings GIS layer and
then created a series of multi-patches for the proposed buildings, observer points
and the target sites of the proposed buildings. Once those items were created a series
of geo-processing tasks were performed to create the site lines and finally to run the
line of site obstruction.
In conclusion of the analysis, we could see where the existing tree canopy (Full Leaf)
would provide a good buffer for the proposed development even with the increased
height of the new construction. However, this not take into effect other factors, such
as, winter (leaf off) and tree removal that would affect the neighboring communities.
The taskforce was presented with slides, a video created using ArcGIS Pro that show-
cased a couple of scenarios and different vantage points and Web Scene application
that anyone could access and view the analysis and data. The taskforce really enjoyed
the presentation and valued the effort put forth to address their concerns. Ellen J.
Hurley, Planning Commissioner for Braddock District, stated “This is fantastic. I
hope to see more representations like this at our Planning Commission meetings”.
Page 14
Page 14First Place
Utilizing Collector for ArcGIS, a GoPro, a Bike, and an Intrepid
Intern to Rapidly Assess Hundreds of Miles of Trails
Keith Appler & Team
Public Works Director’s Office
The Fairfax County Maintenance & Stormwater Management Division (MSMD)
maintains over 230 miles of asphalt trails spread across almost 400 square miles. A
full trail inventory assessment had not been recently completed so many unknowns
existed regarding urgent trail conditions or safety concerns. Due to limited personnel
and budget to inspect, assess and prioritize trail maintenance activities, a pilot project
was developed to have an efficient and repeatable inspection process. This came in
the form of a bicycle equipped with an iPad mini with ArcGIS Collector, a GoPro
Hero 6 camera and an engineering student intern.
The ArcGIS Collector application utilized a simple qualitative rating system to
assess each trail segment and allowed the inspector to capture point observations of
maintenance concerns to be quickly addressed by county staff. A GoPro Bluetooth re-
mote was affixed to the handle bar to enable the rider to capture clear, representative
geotagged images of trail conditions as they rode.
An ArcGIS Online Operations Dashboard was setup to track project metrics, moni-
tor the location of the rider while in the field utilizing a bread crumb layer and view
geotagged photos captured with the GoPro. The GoPro photos were transferred to a
network folder each night, mapped to points and appended to a feature service using
an ArcGIS Pro geoprocessing tool so staff could access the prior days’ work in the
dashboard. The pilot program was successful in assessing the full trail inventory in
little more than two months at a fraction of the cost it would have been if contracted
out. It demonstrates a repeatable inspection process that can be expanded if necessary
and the application potential of GoPro cameras in mobile field assessment.
Page
Page 15
15Best Web Application
GIS Day Excellence Awards 2018
Individual/Team Awardees
Third Place
FRD Management System for Emergency Vehicle Preemption
(EVP) Program
Yong Kim & Team
Fire & Rescue
The Fairfax County Fire and Rescue Department (FRD) responds to over 103,000 in-
cidents a year resulting in over 230,000 individual unit responses and 53,000 patient
transports. A critical factor to the successful mitigation of incidents is the length of
response time (the time it takes units to travel to the incident). As the county con-
tinues to transform from a suburban to an urban community, the population density
increase results in increased traffic congestion which adversely affects these response
times. The challenge to responding FRD units is how to reduce response times and
travel to the incident safely without increasing risk to the community. Safely respond-
ing to emergency incidents and reducing risks benefits both the first responders and
the public.
FRD has response time objectives to deploy emergency medical resources to medical
emergencies within 5 minutes and suppression resources to a structure fire so that the
first engine company arrives within 5 minutes, 20 seconds from dispatch. To reduce
response times, the Fire and Rescue Department began an initiative to install emer-
gency vehicle preemption (EVP) technology at signalized intersections. There are
approximately 1,000 signalized intersections within Fairfax County and when EVP
technology is added to a traffic signal it gives priority to FRD units while in an emer-
gency response mode. Based on studies in other jurisdictions it is predicted that the
implementation of EVP technology at signalized intersections within Fairfax County
will decrease FRD’s response times to incidents, thus enabling the FRD to improve
upon the key mission objectives of protecting life, property and the environment.
In 2015, the FRD began an initiative to increase the deployment of EVP at traffic
intersections throughout Fairfax County. FRD’s EVP project team collaborates with
many internal and external stakeholders: the Board of Supervisors, the County Exec-
utive, the Virginia Department of Transportation (VDOT), the Washington Metro-
politan Area Transit Authority (WMATA), as well as Fairfax County’s Department of
Transportation (FCDOT) and Department of Planning and Zoning (DPZ).
After FRD launched the EVP Program, it became apparent that multiple people in
different sections of the agency all needed access to information about the program
to ensure the program’s continued success. Within FRD, uniformed staff officers,
administrative staff, planners, programmers and analysts all play a role in maintain-
ing the program and the information associated with the program. In 2018, a team of
FRD programmers and analysts developed a multi-faceted application and an associ-
ated data model to improve the FRD EVP business process. This FRD EVP Manage-
Page 16
Page 16ment System allows FRD staff to track and manage all aspects of the program. FRD
staff track funding, proffers, new installations, and ongoing maintenance and repairs.
Correspondence, meeting agendas and minutes, agreements and memorandums of
understanding (MOUs) must all be filed and maintained as well. The EVP Manage-
ment System supports all this and includes a GIS-based dashboard that provides staff
with the current location and status of the signalized intersections and preemption
devices. This GIS functionality is integrated within the application.
During the conceptual phase of the EVP project, FRD GIS became integral by assist-
ing with codifying EVP data. FRD GIS staff created a comprehensive signal data layer
to support the project using datasets from multiple agencies. FRD now maintains this
GIS dataset and makes it available to its partner agencies. A component of the EVP
Management System is a GIS application which allows FRD staff who are not GIS
analysts to maintain this signal dataset layer.
Second Place
Opportunity Zones
Sophia Dutton, Alexandra Krafchek
Office of Strategy Management for Health and Human Services
Within the Federal Tax Cuts and Jobs Act of 2017, a new tax incentive program called
Opportunity Zones was created by Congress to encourage economic development
and revitalization in targeted areas across the country. This program allows private
investors to receive tax benefits in return for investing in qualified areas through
established Opportunity Funds. Nine tracts located in the Route 1 corridor, and in
the East and North parts of the county were designated as Opportunity Zones within
Fairfax County. The tracts include North Hill, Hybla Valley, Mount Vernon Woods,
South County Center, Willston Center, Bailey’s North/Glen Forest, Skyline Plaza,
Herndon South and Lake Anne.
Overall, this web mapping application will be used to increase the economic vitality
in the county by increasing awareness among the community and existing businesses
on this new tax incentive program, attracting managers of Opportunity Zones funds
and their investors to Opportunity Zones located within Fairfax County as part of a
targeted promotion and marketing campaign, and as investments are made, provid-
ing access to data to track the changes and progress in each designated community
over time. County staff, non-profits and community groups can also use this data to
influence and ensure that future policies and investment decisions within Fairfax are
in line with the social and racial equity focus of the One Fairfax Policy.
Page
Page 17
17GIS Day Excellence Awards 2018
Esri Business Analyst software was used to develop the Opportunity Zones web
mapping application. This application allows users to pinpoint the location of the
nine identified Opportunity Zones (census tracts) in Fairfax County. Each Oppor-
tunity Zone in the map includes a pop-up with a customized interactive infographic
containing census based data related to their demographics, race and Hispanic origin,
housing, at risk populations, education and employment. As a comparison, informa-
tion on Fairfax County as a whole was also provided as an infographic. In addition, a
PDF version of the infographics and a link to an in-depth report created by Opportu-
nity 360 in partnership with PolicyMap are also offered in each pop-up.
Layers on the map with the Commercial Revitalization Areas and Districts show
where multiple incentives could come into play and benefit investors, and where new
local incentive zones can be included in the future as they are established. In addi-
tion, a layer with undesignated low-income communities allows users to see if there
are other residents nearby who could benefit from services based in an Opportunity
Zone and plan accordingly.
First Place
Embark Richmond Highway Story Map
Alexis Robinson
Department of Planning & Zoning
The Embark Story Map is a web application that combines the attributes of a written
narrative with a digital map whose features allow the audience to learn specific details
about the Embark Comprehensive Plan amendment within the context of the com-
munity’s geography. In its design, the story map brings to life written narrative and
summaries of the approximately 300-page plan through interactive maps, three-di-
mensional renderings, videos, and other visualizations. This is not the first story
map to be used in this manner by the department, but it is the first to include a high
level of detail about a planning process, especially of this scale. The platform distills
multiple, complex aspects of the plan reducing the reliance on technical jargon. The
total viewership of the story map reached almost 1,200 in just ten months, capturing
the impact of the story map on accessibility.
Individual sections describe the location and character of the corridor and the
corridor-wide and community business center (CBC) guidance and vision elements,
with links to the comprehensive plan and related projects. Story map viewers can
easily identify attributes, such as the study boundaries and existing land uses, and
relate them to conceptual maps in the new plan, Interactive maps of the corridor are
a main focus, with consistent elements such as the CBC boundaries, potential bus
rapid transit (BRT) station locations and ½ mile radii. Additional elements that are
seen at different zoom levels include public facilities, public open space, and current
transportation facilities. Each tab also includes a narrative of high-level details that
would be found on the project website or handouts on each topic.
Graphics such as renderings and images of current and conceptual development
Page 18
Page 18within the Corridor, specifications for urban design, street facilities networks, open
space facilities, and videos of community outreach materials and related projects are
also included. Over 30 visuals and interactives are used in the story map to give as
much detail as possible about the plans. One of the more challenging aspects of this
story map is the two additional story maps that are built into it to better convey the
information in the Guidance tabs. Those tabs use a layout that allow the viewer to
scroll through different views of the map, focus on specific CBCs, and pop up larger
graphics pertaining to the bookmarked topics.
Most Significant Data Contributor
Award Presented to Agencies
Land Survey Branch’s Contribution to National Geodetic Survey
“GPS on Bench Marks”
Yilia Vega-Claudio & Team
Capital Facilities
Land Survey Branch (LSB) is responsible for GIS spatial data control. Physical
monuments are spatial control for quality control and analysis of contractor supplied
photo imagery, LiDAR data, and spatial control for engineering development and
construction. National Geodetic Survey (NGS) maintains nation-wide mathematical
adjustments of spatial values, x, y, and z, or latitude, longitude, and elevation. NGS
adopts a new mathematical model representing the Earth, and publishes values on
known points around 2022 when they introduce North American-Pacific Geopoten-
tial Datum of 2022 (NAPGD2022).
2022 preparation requires defining the new GEOID18. A geoid is a surface approxi-
mating the shape of Earth. Through “GPS on Bench Marks,” NGS sought data from
surveyors across the country to define the geoid. Our data improves the geoid, espe-
cially in the mid-Atlantic region.
Through this project, our monuments contribute to NGS’s models defining the geoid
and NAPGD2022. This significantly improves our stormwater run-off calculations
and accuracy predicting flood inundations. Fairfax will have the best possible trans-
formation to future elevation models. Every county mission and private undertaking
using elevation data benefits.
LSB will submit GPS observational data from 39 monuments for NGS to include
in NAPGD2022 and publish future positional values. Including our monuments in
Page
Page 19
19NGS’s database shifts publishing the evolving positional data of these points to NGS.
GIS Day Excellence Awards 2018
LSB retains responsibility for physical monuments. Without this work, Fairfax would
be without spatial control data after NGS adopts the new models. NGS will support
only monuments with new observations submitted to this dataset. These control
monuments in NAPGD2022 insure accurate spatial control for GIS and for construc-
tion and land development in Fairfax County.
Simultaneously observing GPS monument constellations in sessions over four hours,
twice or more, on each of 39 monuments created “network observations.” GIS aided
collecting, categorizing, and reporting the network observations. Story Map aided
planning these 39 monument observations. Explorer for ArcGIS web map assisted
planning over 200 effective routes to recover and visit monuments during network
observations. Survey123 housed collected observation metadata. We processed GPS
data through an NGS application, OPUS (On-line Positioning User Service), then
shared with NGS pertinent data for “GPS on Bench Marks.”
Best Use of GIS for Public Outreach
Award Presented to Agencies
Embark Richmond Highway Story Map
Alexis Robinson
Department of Planning & Zoning
The Embark Richmond Highway story map is a dynamic web application that sig-
nificantly enhanced community engagement during the Embark Richmond Highway
comprehensive planning study and subsequent implementation efforts, and overall
has promoted greater public understanding of the plan recommendations. The recent
adoption of the revised Richmond Highway plan is viewed as a major milestone in
the revitalization of the corridor, and the story map has been commended by the Lee
and Mount Vernon Supervisors as an influential and technological step forward for
community outreach. The easily accessible, aesthetically appealing, and user-friendly
platform invites a broader range of community members to understand the compre-
hensive plan recommendations at their own pace and convenience.
The story map brings to life written narrative and summaries of the approximately
300-page plan through interactive maps, three-dimensional renderings, videos, and
other visualizations. The platform distills multiple, complex aspects of the plan (for
example, the remixed land uses, innovative urban design and placemaking concepts,
multimodal transportation improvements, including the county’s first bus rapid tran-
sit system and a road widening project; and environmental considerations), reducing
the reliance on technical jargon. Individual sections describe the location and char-
acter of the corridor and the corridor-wide and community business center guidance
and vision elements, with links to the comprehensive plan and related projects. Story
map viewers can easily identify attributes, such as the study boundaries and existing
land uses, and relate them to conceptual maps in the new plan. A section of the story
map also is dedicated to the planning process and community outreach events, high-
Page 20
Page 20lighting outcomes of community meetings.
The story map was published the first week of January 2018 before one of the most
significant community meetings. While the story map has sustained regular viewer-
ship since then, over three-hundred views were recorded on the night of the Planning
Commission public hearing. Viewership of the story map increased to over 800 views
on the night of the Board of Supervisors’ public hearing and the total viewership
steadily increased for weeks after. Since publication the story map has been updated
with progress of the Embark Richmond Highway project and related projects, and
the platform certainly will be considered in the future as an effective public outreach
means for other planning studies.
Best GIS Integration
Award Presented to Agencies (two awards)
Advanced Civil Enforcement System (ACES)
Kimberly Ramm & Team
Sheriff ’s Office
The Fairfax County Sheriff ’s Office, in collaboration with the three Fairfax County
Courts (Circuit Court & Records (CCR), General District Court (GDC), and Juvenile
& Domestic Relations District Court (JDRDC)), the Fairfax County Department of
Information Technology (DIT), the Fairfax County Geographic Information Systems
(GIS), and the Fairfax County Court Technology Office (CrTO), implemented the
Advanced Civil Enforcement System (ACES), a ground-breaking, hybrid solution
automating and integrating the civil enforcement processes between the Sheriff ’s Of-
fice and the three Fairfax County Courts. The system provides a comprehensive civil
process solution, with real-time workload management capabilities while prioritizing,
tracking, serving and executing legal documents on individuals and businesses in
civil matters throughout Fairfax County. ACES interfaces with the Fairfax County
Geographic Information System (GIS) ArcGIS improving the Sheriff ’s Office efficien-
cies with real-time automated document sorting into service areas with custom rout-
ing, mapping, and geofencing. As papers are transmitted or entered into the system,
the GIS ArcGIS validates all addresses, reducing time spent on manual verification.
The system runs within a secure, stable cloud infrastructure that includes automated
redundancy and backup features. ACES is an innovative solution transmitting service
data over cellular and Wi-Fi networks to create an easy-to-use, state-of-the-art civil
process system.
Page
Page 21
21Mobile Mosquito Management - A GIS Mobile Map Initiative
GISLochstampfor
Lauren Day Excellence Awards 2018
Health Department
The Health Department performs routine mosquito inspections of county-main-
tained stormwater dry ponds where inspectors check ponds for immature mosquitoes
and treat with a larvicide, as needed. The inspection program began in 2016.
In 2017, over 8,100 site inspections were performed, 35,000 mosquito larvae were
collected and identified, and about 675 pesticide applications were made. In early
2018, staff began working on a mobile solution to field and site navigation, as well as
field and lab data collection, using two ArcGIS mobile applications: Collector and
Survey 123. A staff member taught herself how to customize Collector and Survey123
with the goal of leveraging available technical and software resources to increase staff
efficiency in the field and lab by reducing reliance on over 1,400 physical maps and
scores of handwritten forms (inspection, larval identification, pesticide treatment
records) while maintaining consistent, reliable data collection. Previously, all hand-
written forms were later entered into electronic spreadsheets, which took at least 100
staff hours. The apps were customized for program-specific needs and field trials were
performed by program staff prior to rollout in Spring 2018.
The geodatabase developed for Collector was based on the physical maps and in-
spection forms. A point layer captured basic site information (e.g., site identifier, site
address, access comments, and photos) for all existing routine inspection locations.
Three additional layers were created that related back to the point “site” layer: inspec-
tions, treatments, and identifications.
Survey123 was leveraged to eliminate paper forms and documentation. Each related
layer had a survey created within Survey123 to capture the required inspection
information based on the site conditions present. Other functionalities include photo
documentation, area measurements based on physical location and aerial imagery,
and conversion calculations (e.g., square feet to acres) when determining pesticide
application rates/quantities.
Using Collector, custom URL callouts launch the requisite survey in Survey123 and
pull through relevant record information such as site GUID, site identifier and site
address. The URL callouts greatly reduce data entry error and allow for consistent
information to pass from the site into each survey.
Work progress can be monitored in real-time with minimal data clean-up. Field staff
benefit from having previous inspection information available to them. Program staff
can share information cross-agency with DPWES and more easily respond to public
complaints or inquiries regarding mosquito concerns and dry ponds. As the program
expands, additional apps to monitor non-routine inspections will be created.
Page 22
Page 22Thank you for attending the 2018 GIS Excellence
Awards Ceremony. We hope to see you next year!
Page
Page 23
23Page 24
You can also read