Impacts of a low-emission zone in Sofia - DECEMBER 2021 Authors: Kaylin Lee, Yoann Bernard, Tim Dallmann, Caleb Braun, Josh Miller - International ...
←
→
Page content transcription
If your browser does not render page correctly, please read the page content below
Impacts of a low-emission
zone in Sofia
Authors: Kaylin Lee, Yoann Bernard, Tim Dallmann, Caleb Braun, Josh Miller

DECEMBER 2021

ACKNOWLEDGMENTS
FIA Foundation and the International Council on Clean Transportation (ICCT) have established The Real Urban
Emissions (TRUE) Initiative. The TRUE initiative seeks to supply cities with data regarding the real-world emissions
of their vehicle fleets and equip them with technical information that can be used for strategic decision making.
TRUE will use a combination of measurement techniques to produce a granular picture of the on-road emissions of
the entire vehicle fleet by make, model, and model year.

EXECUTIVE SUMMARY                                                                                             the impacts of two LEZ implementation schemes on
                                                                                                              the emissions of nitrogen oxides (NOX) and particulate
The residents of Sofia, Bulgaria are exposed to air                                                           matter (PM) from passenger vehicles in the city. Using
pollution levels that exceed European air quality                                                             the TRUE database of real-world emissions from
standards and are among the highest observed in                                                               European vehicles and detailed information on the
European cities. Motor vehicles are an important source                                                       characteristics of the Sofia fleet, the study assesses two
of air pollutant emissions, and their contributions are                                                       implementation timelines: one that tightens restrictions
exacerbated by the growing use of private cars and the                                                        every two years and another that does annually. In each
relatively old vehicle fleet operating in the city.                                                           case, multiple scenarios were analyzed to investigate
                                                                                                              how differing responses by owners of restricted vehicles
Sofia Municipality has taken steps to address these                                                           impacted the emissions benefits of the LEZ.
challenges, most recently with the development of
the Comprehensive Air Quality Improvement plan.                                                               The analysis finds that older diesel cars certified to
The plan includes a proposal for the development of                                                           Euro 4 or prior standards, which make up around 30%
a low-emission zone (LEZ), a form of vehicle access                                                           of Sofia’s fleet, are responsible for 56% of the total
restriction that has been applied in many European                                                            NOX emissions and 85% of the total PM emissions
cities to control traffic-related pollution. As the details                                                   from passenger cars in 2021. Figure ES1 shows that
of the LEZ policy are under discussion, it is important                                                       an LEZ designed to restrict these old, high-emitting
to understand the levels of emission benefits different                                                       vehicles is highly effective in delivering a substantial
LEZ implementation schemes achieve and how quickly                                                            reduction in emissions. When the restrictions are
these benefits are delivered.                                                                                 implemented at two-year intervals, a 75% emissions
                                                                                                              reduction compared to current levels would be
To provide insight on these questions and support Sofia                                                       achieved six to eight years sooner for NOX and four
in their efforts to develop an LEZ, this study assesses                                                       to five years sooner for PM than with natural fleet

                                                                                 NOX                                                            PM
                                                     100%                                                        100%
   Share of mean distance−specific emission factor

                                                     75%                                                          75%
                 relative to baseline

                                                     50%                                                          50%

                                                     25%                                                          25%

                                                      0%                                                           0%
                                                            2021   2022   2023   2024 2025      2026   2027             2021   2022     2023   2024 2025     2026   2027
                                                                                 Year                                                          Year
                                                                      Implementation timeline      No LEZ          Two−year intervals          Accelerated

Figure ES1. Reduction in mean distance-specific emission factors of NOX and PM relative to baseline (2021) levels as a result of “two-year intervals”
and “accelerated” implementations of a low-emission zone as opposed to a case with no LEZ. Shaded areas show the ranges of possible emissions
reductions that depend on the responses of vehicle owners affected by LEZ restrictions. Darker lines show the emissions impacts of a scenario in
which vehicle owners replace their non-compliant vehicles with the cleanest available petrol vehicles. Additional scenarios considered include one
in which vehicle owners switch to zero-emission activity (lower range of each shaded area) and a one in which vehicle owners buy the minimum
compliant vehicles (upper range of each shaded area).

                                                                                                                                                                           1
                                                                                            IMPACTS OF A LOW-EMISSION ZONE IN SOFIA | DECEMBER 2021
turnover, depending on the responses of affected and more than seven times those of the second most
drivers. The same level of emissions reduction polluted city in the country. 2
would be accelerated by up to four and two years,
respectively, for NOX and PM in the scenario in which The use of private cars is one of the main sources of
restrictions tighten every year. In all cases, the greatest air pollution in Sofia, 3 and the city’s population has
emissions benefits are achieved when affected vehicle become increasingly motorized in the last few years;
owners switch to zero-emission modes. the motorization level in 2020 of 663 cars per 1000
inhabitants is 29% higher than the 2016 level of 515
These findings demonstrate that a well-designed LEZ cars per 1000 inhabitants.4 Other large European
can significantly accelerate reductions in NOX and PM cities typically have a car usage level below 450 per
emissions in Sofia. The conclusion also suggests that 1000 people.
in order to achieve the greatest emissions benefits, an
LEZ must incentivize drivers to choose zero-emission Besides its growing vehicle use, the age of Sofia’s
alternatives, like zero-emission vehicles, public vehicle fleet also contributes significantly to air
transport, or walking. Simultaneously, a well-designed pollution. The average vehicle age in Sofia is 18 years
LEZ should be complemented with supporting old and over half of all motor vehicles in Sofia are
policies, such as increased access to public transport over 16 years old. 5 In contrast, the average age of
and financial support to purchase clean vehicles, to cars in the EU is 11.5 years.6 The higher fraction of
reduce adverse impacts on lower-income populations. older vehicles is detrimental to the city’s air quality,
Finally, the effectiveness of an LEZ in reducing as older vehicles like pre-Euro 5 diesel vehicles emit
total emissions in Sofia will depend on the area the significantly more PM and NOX emissions than those
restrictions will effectively cover, which is currently certified to newer standards. However, there are
under consideration. An ambitious LEZ policy that currently no regulations in Sofia limiting the use of the
extends the LEZ to a greater geographic area would older, more polluting cars.
lead to greater emission benefits for a larger fraction Sofia Municipality recently adopted the Comprehensive
of residents. Air Quality Improvement Programme, in which over
80% of the budget was set aside for transportation
INTRODUCTION measures.7 The Programme outlines preliminary plans
for implementing a low-emission zone (LEZ), a form of
Sofia, the capital of Bulgaria, is one of the most vehicle access regulation which has been adopted in
polluted cities in Europe. Particulate matter (PM) many European cities as a measure to reduce traffic-
concentrations in Sofia regularly exceed the World related pollution and other greenhouse gas emissions
Health Organization’s annual limits and the European (GHG). LEZs typically limit the access of vehicles to a
Union air quality standards. Air pollution exposure is designated area based on their emission performance
responsible for a number of adverse health impacts, or standard. Especially in cities where the use of
including respiratory and cardiovascular diseases. The older, polluting vehicles is prevalent, an LEZ can be an
European Environment Agency (EEA) estimates that effective way of reducing emission levels within the
13,920 premature deaths in Bulgaria were attributable
to the fine particulate matter (PM2.5), nitrogen dioxide
2 Sandra de Bryun, “Health Costs of Air Pollution in European Cities and the
(NO2), and ozone (O3) exposure in 2018, a level which, Linkage with Transport” (CE Delft, October 2020), https://cedelft.eu/wp-
when normalized by population, is 2.2 times the average content/uploads/sites/2/2021/03/CE_Delft_190272_Health_costs_of_air_
pollution_in_European_cities_and_the_linkage_with_transport_Def.pdf.
among the EU-27 countries and the United Kingdom.1
3 “Sofia Urban Challenge: Finding Agile Solutions to Air Quality,” eit Climate-
Air quality is generally worse in large cities like Sofia KIC, accessed July 23, 2021, https://www.climate-kic.org/success-stories/
sofia-urban-challenge/.
than other parts of Bulgaria. Researchers have found
4 SofiaPlan, “SofiaPlan’s Analysis for Transport Infrastructure 2021
that Sofia’s social costs of air pollution, quantified by (Summary),” March 2021.
negative health impacts, are the highest in Bulgaria, 5 SofiaPlan. “SofiaPlan’s Analysis for Transport Infrastructure 2021
(Summary).”
6 European Automobile Manufacturers’ Association, “Average Age of the EU
Vehicle Fleet, by Country,” February 1, 2021, https://www.acea.auto/figure/
average-age-of-eu-vehicle-fleet-by-country/.
1 European Environment Agency, “Bulgaria - Air Pollution Country Fact Sheet 7 European Public Health Alliance, “Fighting Air Pollution: There Are More Cars
2020,” November 23, 2020, https://www.eea.europa.eu/themes/air/ in Sofia than the Average for the EU’s Largest Cities,” June 2, 2021, https://
country-fact-sheets/2020-country-fact-sheets/bulgaria. epha.org/fighting-air-pollution-there-are-more-cars-in-sofia/.
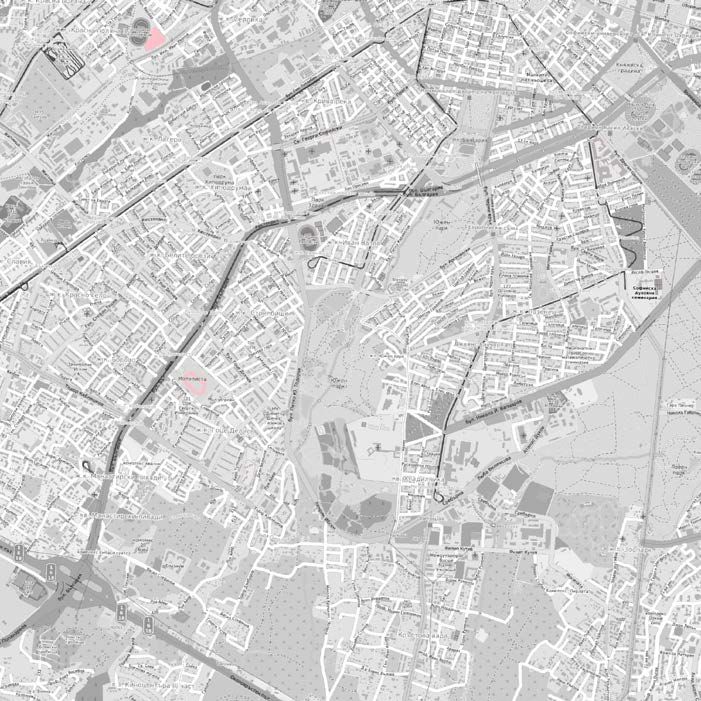
2Figure 1. Area under consideration for Sofia’s low-emission zone (shaded in red).
designated zone. The effectiveness of LEZs in achieving vehicles.9 The territorial scope of the LEZ currently
emission reductions is well documented, although under consideration mainly covers the central part
reported emission reduction levels attributed to LEZ of the city, as shown in Figure 1, with the possibility
implementation vary by city.8 of expanding to a second zone.10 This area partially
corresponds to the city center where heavy trucks
The initial steps of implementing an LEZ outlined in with the maximum permissible weight of 4 tonnes are
Sofia’s Air Quality Improvement Programme include currently not allowed to enter during certain hours of
gathering real-world traffic data and introducing the day.11 As the detailed parameters of the LEZ are
eco-stickers which rate the emission performance of currently being discussed for its implementation in the
summer of 2022, our study provides a timely analysis
9 Sofia City Council, “Annex 14: Comprehensive Air Quality Improvement
Programme of Sofia Municipality for the Period 2021-2026,” April 26, 2021,
https://www.sofia.bg/documents/20182/10412985/
%D0%9F%D1%80%D0%B8%D0%BB%D0%BE%D0%B6%D0%B5%
D0%BD%D0%B8%D0%B5+14.pdf/d522f805-bcd8-4ed7-9b85-
8 Jens Müller and Yoann Le Petit, “Low-Emission Zones Are a Success - but 00a10bdc1cbe.
They Must Now Move to Zero-Emission Mobility” (Transport & Environment,
September 2019), https://www.transportenvironment.org/sites/te/files/ 10 Sofia City Council, “Annex 14: Comprehensive Air Quality Improvement
publications/2019_09_Briefing_LEZ-ZEZ_final.pdf; “ULEZ Reduces 13,500 Programme of Sofia Municipality for the Period 2021-2026.”
Cars Daily & Cuts Toxic Air Pollution by a Third,” Press release, Mayor of 11 CLARS, “Sofia: Access Regulated by Other Requirements,” Urban
London, October 21, 2019, https://www.london.gov.uk/press-releases/ Access Regulations in Europe, accessed August 12, 2021, https://
mayoral/ulez-reduces-polluting-cars-by-13500-every-day. urbanaccessregulations.eu/countries-mainmenu-147/bulgaria/sofia-ar.
3
IMPACTS OF A LOW-EMISSION ZONE IN SOFIA | DECEMBER 2021that explores the emissions reduction potential of an of LEZ implementation on emissions from passenger
LEZ and other considerations for policy makers. cars, the most common vehicle type on the roads of the
city. While not included in this analysis, other vehicle
This report uses real-world emissions and activity data types, such as light-commercial and heavy-duty vehicles
to examine the emissions reductions that could be are also important sources of traffic-related pollution
achieved through an LEZ under different assumptions and should be considered for inclusion in any LEZ
regarding the behavior of affected drivers. The analysis designs for Sofia.
presented here is intended to support discussions
regarding the implementation of an LEZ in Sofia and The analysis applies two primary data sources to define
to inform the design to enhance its effectiveness. (1) pollutant emission factors for each vehicle group
Based on our findings, the LEZ design used in this by fuel type and certified Euro standard, and (2) the
study can serve as a recommendation for an LEZ in distribution of vehicles operating in Sofia by fuel type,
Sofia in the absence of an existing framework. The age, and emissions standard. The following sections
paper concludes with policy implications, including describe these data sources in more detail.
discussions on other social and economic components
that need to be further considered. EMISSION FACTOR ESTIMATION BASED
ON REMOTE SENSING RECORDS
METHODS Our analysis derives distance-specific NOX and PM
In this paper, we evaluate the potential emission emission factors by fuel type and emission standard
reduction benefits of a low-emission zone based on from a database of over 1.5 million measurements from
the real-world emission factors of European vehicles 19 European remote sensing campaigns. The remote
and the fleet composition specific to Sofia, Bulgaria. sensing database provides a more accurate picture of
We assume that access restrictions of different vehicle emissions in the real-world setting, which may differ
groups are progressively applied to the central area of from those measured during type-approval tests due to
Sofia designated by the city (Figure 1). We consider two various driving and environmental conditions, such as
implementation timelines: one where the restrictions temperature, speed, acceleration, and road grade. The
tighten every two years and another where they tighten emission factors reflect the results from the most up-
every year, which we refer to as accelerated LEZ to-date database and, therefore, show some differences
implementation. from those used in our previous study on the impacts of
an LEZ in Paris.
Changes in emissions resulting from the LEZ
implementation schedules are estimated by calculating Some conversions and calculations were necessary
fleet-average emission factors, which are used here as to obtain the emission factors used in the analysis.
a proxy for changes in total emissions when the total Remote sensing measurements provide fuel-specific
vehicle activity remains constant. The analysis builds emissions, expressed in grams per kilogram of fuel
upon the approach developed and applied in a previous burned. Distance-specific NOX and PM emission factors
TRUE study which investigated the emissions impacts that we utilize in the study were thus estimated using
of the implementation of the Paris low-emission zone.12 methodologies developed previously by ICCT.13 Emission
While the former study focused only on nitrogen oxide factors for diesel and petrol Euro 0, or all vehicles
(NOX) emissions, this work extends the approach to also with standards antecedent to Euro 1 for which we did
consider tailpipe particulate matter (PM) emissions. not have sufficient coverage in the database, were
estimated by applying the same relative change shown
Our analysis focuses on the emissions of both NOX and in the EEA emission factors.
PM, two of the main pollutants of concern emitted by
motor vehicles and important contributors to poor air Emission factors for Euro standards whose
quality in Sofia. In this analysis, we evaluate the impacts measurements were absent from our data sources were
13 Yoann Bernard Uwe Tietge, John German, and Rachel Muncrief,
12 Yoann Bernard, Joshua Miller, Sandra Wappelhorst, and Caleb Braun “Determination of Real-World Emissions from Passenger Vehicles Using
“Impacts of the Paris Low-Emission Zone and Implications for Other Cities” Remote Sensing Data” (Washington, D.C.: TRUE Initiative, June 5, 2018),
(Washington, D.C.: ICCT, March 12, 2020), https://theicct.org/publications/ https://theicct.org/publications/real-world-emissions-using-remote-
true-paris-low-emission-zone. sensing-data.
4Table 1. Passenger car NOx and PM emission factors by fuel type and Euro standard.
Type All Diesel Petrol
Emission approval registration
standard date date NOX (mg/km) PM (mg/km) NOX (mg/km) PM (mg/km)
Euro 0 1134 125.1 624 8.8
Euro 1 Jul 1992 Jan 1993 1105 47.7 644 4.9
Euro 2 Jan 1996 Jan 1997 1169 48.1 538 4.1
Euro 3 Jan 2000 Jan 2001 945 37.9 284 2.9
Euro 4 Jan 2005 Jan 2006 790 20.2 141 2.4
Euro 5 Sep 2009 Jan 2013 766 2.3 91 2.2
Euro 6 Sep 2014 Sep 2015 433 1.2 83 1.7
Euro 6d-TEMP Sep 2017 Sep 2019 110 0.9 66 0.7
Euro 6d Jan 2020 Jan 2021 75 0.9 45 0.7
Euro 7 Jan 2025 Jan 2026 25 0.9 25 0.7
Note: Type approval date refers to the date from when vehicles can be certified to the standard and all registration date refers to the date by when
all new vehicles must be certified.
assigned based on the most recent regulations and CLOVE consortium.15 Similar to Euro 6d, Euro 7 PM
information available from the European Commission. emission factors remain the same as the Euro 6d-TEMP
Euro 6d was only introduced starting 2020, so its NOX and Euro 6d levels because the limit currently being
emission factor was assigned based on the allowance discussed (2 mg/km) is above the remote sensing
reduction set by the European Commission, which results. Our analysis makes an optimistic assumption
permitted 6d-TEMP vehicles to emit 2.1 times more that no further emission deterioration occurs over the
than the laboratory limit (conformity factor) under remaining lifespan of all vehicles beyond the point of
the on-road type-approval test, known as Real Driving reference in 2020. Emission factors used in this study
Emissions (RDE), but lowered to 1.43 times under the are summarized in Table 1.
final 6d implementation step.14 We assume no further
changes in PM emission factors for both diesel and Figure 2 presents a comparison of NOX and PM
petrol Euro 6d, as the remote sensing average emission emissions performance for all Euro standard and fuel
factors were already below the current Euro 6 level (5 type groupings from the remote sensing data, which
mg/km). Euro 7, a likely last and fuel-neutral standard is helpful in identifying those vehicle groups with the
before all vehicles are required to be zero-emission, is highest emissions of each species, the restriction of
expected to come into force in 2025. Therefore, our which may lead to the greatest benefits for an LEZ.
analysis introduces Euro 7 from the model year 2025 The diesel Euro 0 group is not shown on the plot as its
with a fuel-neutral NOX emission factor of 25 mg/ PM emission factor (125 mg/km) greatly exceeded
km, a level corresponding to the average of the two (more than twofold) those of the next highest emitting
foreseen scenarios most recently discussed by the vehicle groups—Euro 1 or Euro 2 diesels. Our estimated
emission factors show that older diesel vehicles, namely
pre-Euro (Euro 0) and Euro 1, 2, 3, 4 standards, emit
significantly more than their petrol equivalents.
14 European Commission, “Commission Regulation (EU) 2018/1832 of
5 November 2018 Amending Directive 2007/46/EC of the European
Parliament and of the Council, Commission Regulation (EC) No 692/2008
and Commission Regulation (EU) 2017/1151 for the Purpose of Improving
the Emission Type Approval Tests and Procedures for Light Passenger and
Commercial Vehicles, Including Those for in-Service Conformity and Real- 15 CLOVE Consortium, “Additional Technical Issues for Euro 7 LDV” (Advisory
Driving Emissions and Introducing Devices for Monitoring the Consumption of Group on Vehicle Emission Standards (AGVES), Brussels, April 27,
Fuel and Electric Energy (Text with EEA Relevance.),” Pub. L. No. 32018R1832, 2021), https://circabc.europa.eu/w/browse/f57c2059-ef63-4baf-b793-
301 OJ L (2018), http://data.europa.eu/eli/reg/2018/1832/oj/eng. 015e46f70421.
5
IMPACTS OF A LOW-EMISSION ZONE IN SOFIA | DECEMBER 2021Diesel Petrol
1200
Euro 2
Euro 1
Euro 3
900
Euro 5
Euro 4
NOX (mg/km)
Euro 1
600 Euro 0
Euro 2 100
Euro 6 Euro 5
Euro 6
75
Euro 6d−TEMP
NOX (mg/km)
50
300 Euro 3 Euro 6d
25 Euro 7
Euro 4
Euro 6d−TEMP
0
Euro 6d 0 1 2 3
0
Euro 7 PM (mg/km)
0 10 20 30 40 50 0 10 20 30 40 50
PM (mg/km)
Figure 2. Comparison of NOX and PM emissions performance by Euro standard and fuel type grouping.
CURRENT SHARE OF PASSENGER limited nature of this dataset, it was able to give a
more complete picture of vehicle activity by Euro
CAR ACTIVITY AND EMISSIONS BY
standard and fuel type in Sofia than a recent mobility
VEHICLE GROUP study, in which 56.5% of passenger cars had missing
Sources such as vehicle registration and inventory Euro standards.16 However, we note that this may not
data are commonly used to define fuel type, age, and accurately represent the citywide fleet distribution due
emission standard distributions of a city’s fleet. In the to the small sample size, limited geographic coverage,
absence of such sources, however, we utilize the results and times the measurements were taken.
from Sofia’s 2020 remote sensing study as a proxy for
Sofia’s fleet activity and acknowledge that the selected This raw dataset contained 6,957 measurements of
source may not be fully representative of the fleet. 6,284 unique passenger cars of all fuel types, where
The limitations are further discussed in the concluding liquefied petroleum gas and compressed natural
section of this paper. gas vehicles represented 11% and 5% of the fleet,
respectively. For simplification, these vehicles were
The remote sensing campaign was conducted by grouped with petrol vehicles as they share the same
Sofiabus using the RSD AccuScan 5000 instrument type of positive ignition combustion and three-way
over the period of 5 days between 25 September catalyst aftertreatment systems, which for this analysis
2020 and 5 October 2020. The fleet inventory was were assumed to lead to similar NOX and PM emission
taken from a location near Borisova Garden in the factors. Despite the presence of Euro 6d, Euro 6d-TEMP
residential neighborhood of Yavorov in Sofia. In total, was absent from the original data and therefore was
10,621 measurements from 9,553 unique vehicles were identified by associating the vehicle registration dates
collected during the campaign. Due to complications with the Euro standard type approval dates. Specifically,
encountered during the campaign, remote-sensing all Euro 6d vehicles registered before the type-approval
emissions data were not usable. However, technical date of Euro 6d (January 2020) were considered to be
information on the sampled vehicle fleet was obtained Euro 6d-TEMP.
via license plate information collected during the
campaign and is used here to define characteristics of
the Sofia passenger car fleet. Despite the somewhat 16 SofiaPlan.
6Diesel Petrol
25% 24%
Red bars > blue bars indicates disproportionately
22%
high contribution to NOx emissions
20%
16%
15% 14%
Share
12%
11%
10%
8% 8% 8% 8%
7% 7% 7%
6% 5%
5%
5% 4% 4%
3% 3%
2%
1% 2% 2% 2%
1% 0% 1% 0% 1% 1% 1% 0%
0% 1% 0%
0%
0 1 2 3 4 5 6 6d- 6d 0 1 2 3 4 5 6 6d- 6d
TEMP TEMP
Emissions standard
Measurements NOX Emissions
Figure 3. NOX emission share and measurement share of each Euro standard and fuel type group from the Sofia 2020 remote sensing campaign.
Our initial assessment of the dataset shows the average The NOX emissions share results indicate diesel-
age of unique passenger cars in Sofia is 13 years, a few powered vehicles are responsible for 74% of the
years younger than the reported average of all vehicles total emissions from passenger cars in Sofia. Euro
in 2018 but nevertheless older than the average age of 3 and 4 diesels are the highest emitting vehicle
cars in the EU.17 The measurements of passenger cars groups, accounting for only about 25% of the total
age 13 and above accounted for 56% of the total, which measurements but are estimated to contribute nearly
is in line with the passenger car statistics of SofiaPlan 50% of the total NOX emissions from the Sofia fleet.
and implies these vehicles are actively used in the city.18 Only diesel cars certified to Euro 6 and later standards
More than half (54%) of cars of age 13 years and older show a decreasing contribution to total NOX emissions.
were petrol-powered. Overall, petrol vehicles were This is not only because they emit less NOX than their
observed more often than diesel in Sofia’s 2020 remote preceding standards but is also due to their relatively
sensing measurements, as shown by the higher share of small share (6%) of the total passenger car fleet.
petrol vehicles in total measurements (56% petrol and However, it is important to note that although Euro 6
44% diesel). diesel vehicles have improved emission performance
relative to older diesel cars, they show elevated levels
The measurement shares and NOX and PM emission of real-world NOX that do not comply with EU limits.19
shares estimated for each vehicle group are shown in Petrol-powered vehicles generally appear to contribute
Figure 3 and Figure 4. The share of emissions of each less to NOX emissions than their diesel-powered
vehicle group was obtained by multiplying the estimated equivalents. For example, the most frequently measured
distance-specific emission factor by the measurement vehicle group, petrol Euro 4 cars, accounts for 16% of
counts of each group and calculating the share Sofia’s fleet but is responsible for only 5% of the total
from the total level of each pollutant. The emission NOX emissions.
shares were then compared with the measurement
shares to pinpoint vehicle groups that contribute Figure 4 shows a similar distribution of PM emissions;
disproportionately to the total emissions. 86% of the total PM emissions are attributed to diesel
vehicles, and Euro 3 and 4 vehicles account for the
19 Yoann Bernard, “Real-World NOx Emissions from Remote Sensing:
17 SofiaPlan. An Update of the TRUE Rating,” ICCT Staff Blog (blog), December 17, 2018,
18 SofiaPlan. https://theicct.org/blog/staff/true-rating-update-dec2018.
7
IMPACTS OF A LOW-EMISSION ZONE IN SOFIA | DECEMBER 2021Diesel Petrol
40%
38%
Red bars > blue bars indicates disproportionately
high contribution to PM emissions
30%
27%
Share
20%
16%
15% 14%
11%
10% 8%
7% 7% 8%
7%
6%
4%
3% 4%
3% 2% 2% 3% 2%
2% 1% 1% 0% 2% 2% 1%
0% 1% 0% 1% 1% 1% 0% 0%
0%
0%
0 1 2 3 4 5 6 6d- 6d 0 1 2 3 4 5 6 6d- 6d
TEMP TEMP
Emissions standard
Measurements PM Emissions
Figure 4. PM emission share and measurement share of each Euro standard and fuel type from the 2020 remote sensing campaign.
largest share of emissions, making up 65% of PM sensing dataset, and the emissions shares of the
emissions with only 25% of the measurement share. affected vehicle groups to ensure that the emissions
However, post-Euro 4 vehicles show significantly are reduced effectively without overburdening vehicle
lower PM levels as a result of the introduction of owners. In the case of Sofia, diesel Euro 3 and 5 vehicles
diesel particulate filters (DPFs). Similar to NOX and petrol Euro 2, 3, and 4 vehicles hold the largest
emissions, petrol vehicles perform better in terms shares of the total passenger car fleet and, therefore, are
of PM emissions than their diesel counterparts. In not phased out simultaneously. Furthermore, as older
total, petrol vehicles are estimated to make up 56% of cars often belong to lower-income individuals, a scheme
Sofia’s passenger car fleet and contribute 14% of total that gradually increases the number of Euro standards
PM emissions. affected was preferred to promote a more equitable
implementation of the LEZ. 20
SOFIA LOW-EMISSION ZONE DESIGN The LEZ was designed so that the older, more polluting
Based on the preliminary assessment of the 2020 cars are banned first starting in 2022, with further
remote sensing campaign data and the real-world restrictions implemented over six phases. The vehicle
emission factors, we are able to design a low-emission groups allowed in the LEZ are progressively restricted
zone scheme. We assume that the suggested LEZ until 2032, eventually allowing only diesel vehicles
covers the area currently being discussed by city certified to Euro 7 standards and petrol vehicles certified
officials and shown in Figure 1. We examine the impacts to Euro 6d and 7 standards. The more accelerated
of two different LEZ implementation schedules: one implementation of the LEZ introduces new phases
where a new phase is implemented every two years annually and reaches Phase 6 by 2027. Up to the fourth
from 2022 to 2032 and a more accelerated schedule phase of the LEZ, all affected vehicles will be over 13
where a new phase is introduced each year from 2022 years old, which is around the average age of passenger
to 2027. This progressive implementation of restrictions vehicles in Sofia in 2020. This way, the initial phases of
is a standard practice of the existing LEZs in European the LEZ will encourage the replacement of the oldest,
cities such as Brussels, Milan, and Paris. highest emitting vehicles in the fleet while avoiding
The LEZ scheme we designed for Sofia is presented
in Table 2. The design primarily considers the age, the
20 Müller and Le Petit, “Low-Emission Zones Are a Success - but They Must
prevalence of the measurements in the 2020 remote Now Move to Zero-Emission Mobility.”
8Table 2. Low-emission zone design for Sofia.
Minimum standard Implementation timeline (year)
Diesel Petrol Two-year intervals Accelerated
Phase No restriction No restriction 2021 2021
1 Euro 3 Euro 2 2022 2022
2 Euro 4 Euro 3 2024 2023
3 Euro 5 Euro 3 2026 2024
4 Euro 6 Euro 4 2028 2025
5 Euro 6d Euro 5 2030 2026
6 Euro 7 Euro 6d 2032 2027
placing excessive burdens on owners of relatively new In all the scenarios, we assume that Euro 7 standards
vehicles. Furthermore, the lead time of 6 to 11 years will are introduced from 2025 and all new vehicles produced
give vehicle owners sufficient time to plan their vehicle after 2026 meet Euro 7 standards.
purchases.
To simulate the natural fleet turnover of Sofia, we
assume a constant age distribution of diesel and petrol
MODELING THE IMPACTS OF LEZ vehicles over time. This distribution was obtained from
IMPLEMENTATION ON FLEET-AVERAGE the 2020 Sofia remote sensing campaign. 23 For the
EMISSION RATES other scenarios, we assume that all vehicle owners
affected by the LEZ implementation phases respond to
In order to simulate the effects of the proposed LEZ
the restrictions as specified by the scenarios described
scheme on the emissions from passenger cars, average
above. We also assume full compliance of all drivers
NOX and PM emission factors were modeled for four
with the LEZ restrictions. Our analysis does not consider
different scenarios:
changes in overall vehicle activity in the LEZ but focuses
1. No LEZ: baseline scenario that depicts the natural only on the changes in average emission factors as a
fleet turnover with no LEZ in place result of LEZ restrictions.
2. Buy minimum requirement: vehicle owners replace To provide context for what a certain decrease in
their current vehicles with the bare minimum the average emission factor means, we present the
standards in response to the restrictions emission impacts of the LEZ in terms of the time saved
to reach certain emission reduction goals relative to
3. Buy cleanest petrol: vehicle owners replace their the baseline no LEZ scenario. We look at two emission
current vehicles with petrol vehicles type- reduction goals: the points where the average emission
approved to the latest available Euro standard21 factors are reduced by 50% and 75% from the 2021
level with no LEZ. Assuming the decrease in the average
4. Switch to zero-emission activity: people switch to
emission factor is linear between phases, we first derive
zero-emission activities, such as driving zero-
the years in which all scenarios, including the baseline,
emission vehicles, taking public transportation,
halve and quarter the initial average emission factor by
or walking22
23 Euro standards of vehicles are often determined by comparing the registration
dates of individual vehicles with the type-approval dates or the implementation
dates of Euro standards. However, this method does not consider the
21 These new vehicles would be type-approved to the Euro 6d emission possibility of vehicles type-approved to different Euro standards in one year. In
standard for the 2022 to 2024 timeframe, and to the Euro 7 emission order to reflect Sofia-specific car activity more accurately, shares of different
standard from 2025 onwards. type-approved Euro standards in each model year were specified based on the
22 For zero-emission activities that do not involve passenger cars, such as public remote sensing data and inputted into simulations. Sofia’s vehicles tend to be
transportation and walking, we assume PM and NOX emissions are expressed registered closer to the date by which all vehicles need to implement the newer
in per km distance that would have been driven in passenger cars otherwise. standard and show the oldest standard possible.
9
IMPACTS OF A LOW-EMISSION ZONE IN SOFIA | DECEMBER 2021interpolation and compare the estimated timeframes to particular, the scenario in which non-compliant vehicles
find how much earlier the selected emission reduction are replaced by the cleanest compliant petrol vehicles
goals are achieved with the help of an LEZ. and the scenario in which they shift to zero-emission
vehicles or modes draw similar trajectories until Phase
4. This is because in the former scenario, petrol vehicles
PROJECTED IMPACT that emit much less NOX than their compliant diesel
To assess the effects of an LEZ on NOX and PM equivalents constitute an increasingly higher share in
emissions, distance-specific fleet-average emission the total fleet. Moreover, high-emitting Euro 4 and 5
factors (mg/km) are presented for the reference year diesel vehicles are replaced by Euro 6d petrol vehicles,
and all phases of the LEZ for four different scenarios, which emit 95% less NOX emissions than Euro 5 diesel
including the baseline scenario. We use 2021 as the vehicles. This highlights that if affected drivers were to
reference year, as we assume the LEZ to be phased replace their non-compliant vehicles with the cleanest
in starting in 2022. The baseline scenario depicts the available petrol option, the potential effectiveness of
natural turnover of the passenger car fleet in Sofia, the LEZ in addressing NOX emissions is substantial even
which shows declining average NOX and PM emission without considering zero-emission activities.
factors as older vehicles are replaced with newer The effects of an LEZ on the average NOX emission
vehicles that tend to have better emission performance. factors in the most pessimistic scenario, in which non-
It is important to note that we assume the total car compliant vehicles are replaced by vehicles meeting
activity to remain constant. the minimum standards allowed in the LEZ, show some
delay compared with the other two scenarios. In Phase
EMISSION IMPACTS OF LEZ
3, the average NOx emission factor for the buy minimum
IMPLEMENTATION STEPS AT requirement scenario is only 5% lower than that for the
TWO-YEAR INTERVALS no LEZ scenario, while the emission factors for the buy
Compared to the baseline scenario, all three LEZ cleanest petrol and the switch to zero-emission activity
scenarios show steeper downward trajectories of scenarios are 37% and 38% lower, respectively, than
average NOX emission factors, as shown in Figure 5. In for the baseline scenario. Restrictions prior to Phase 4
0
Mean distance−specific NOX emission factor (mg/km)
400
Phase 1
25
Reduction in emission factor (%)
Scenario
300 No LEZ
Phase 2 Buy
minimum
50 requirement
200 Buy
Phase 3
cleanest petrol
Switch to
zero−emission
75 activity
100
Phase 4
Phase 5
0 Phase 6 100
2022 2024 2026 2028 2030 2032
Year
Figure 5. The effects of a low-emission zone on fleet-average passenger car NOX emission factors for four scenarios. The grey shaded area indicates
the timeframe the LEZ is in place.
10Table 3. Years in which each scenario reaches 50% and 75% reduction in the average NOX emission factor and the numbers of years accelerated in
comparison to the scenario with no LEZ.
Reduction in average Number of years
NOX emission factor Scenario Year accelerated
No LEZ 2030
50% LEZ - Buy minimum requirement 2027 2.9
LEZ - Buy cleanest petrol 2026 4.8
LEZ - Switch to zero-emission activity 2025 4.9
No LEZ 2035
75% LEZ - Buy minimum requirement 2029 6.1
LEZ - Buy cleanest petrol 2028 7.7
LEZ - Switch to zero-emission activity 2028 7.8
appear to provide little benefits as Euro 4 and 5 diesel The implementation of an LEZ has a more accelerated
vehicles still make up a large portion of car activity and impact on average PM emission factors than average
they emit over 75% more NOX than vehicles certified NOX emission factors, as shown in Figure 5. By Phase
to their successive standard, Euro 6. In Phase 4, the buy 3, the estimated average PM emission factors for all
minimum requirement scenario achieves the average NOX LEZ scenarios are 63%–69% lower compared to the
emission factor that is 32% less than that of the baseline average PM emission factor for the baseline scenario.
scenario, but the effects of a similar magnitude to the The significant reduction in the average PM emission
other LEZ scenarios are not achieved until 2030. factors in Phase 3 is a result of banning diesel Euro 4
vehicles, the last standard that could be met without
Compared to the 2021 level, all three LEZ scenarios the use of a diesel particulate filter, a technology which
deliver a greater than 90% reduction in the average greatly improves the PM emission performance of diesel
passenger car NOX emission factor by 2032. Without an vehicles. The effectiveness of the LEZ appears to be
LEZ in place this reduction is estimated to be only about consistent regardless of how vehicle owners respond
60% (right y-axis in Figure 5). The evolution of the fleet- to the policy until the end of the LEZ implementation
average NOX emission factors is summarized in Table A1 period. In 2032, the switch to zero-emission activity
in the appendix. scenario achieves 57% more reduction than the buy
To put these modeling results in perspective, Table 3 cleanest petrol scenario, the scenario that achieves the
shows the impacts of the LEZ in terms of the difference second-best reduction in average PM emission factors.
in timeframes over which certain levels of emission The fleet-average PM emission factor is expected to
reduction are achieved. If the goal is to achieve a 50% decrease due to natural fleet turnover without an LEZ
reduction in the average NOX emission factor relative in effect, reaching 50% reduction relative to 2021
to the current level, the LEZ can deliver this five years levels by 2026 and 75% by 2030. However, the same
earlier than when it would be reached without an LEZ emission factor reduction levels would be achieved
in place. When changes in average emission factors approximately two years and four to five years earlier,
are driven only by natural fleet turnover, this goal is not respectively, with the implementation of an LEZ, as
achieved until 2030. When considering a 75% reduction summarized in Table 4. More details on the evolution
target, it becomes evident that the LEZ is necessary to of average PM emission factors are summarized in
achieve this goal before 2030. With an LEZ in place, a Table A1 of the appendix.
75% reduction in the average NOX emission factor can
be achieved six to eight years earlier than in the case
where no LEZ is implemented.
11
IMPACTS OF A LOW-EMISSION ZONE IN SOFIA | DECEMBER 20210
10.0
Mean distance−specific PM emission factor (mg/km)
25
Reduction in emission factor (%)
7.5 Phase 1 Scenario
No LEZ
Buy
minimum
5.0 50 requirement
Buy
cleanest petrol
Phase 2
Switch to
zero−emission
2.5 75 activity
Phase 3
Phase 4
Phase 5
0 Phase 6 100
2022 2024 2026 2028 2030 2032
Year
Figure 6. The effects of a low-emission zone on fleet-average passenger car PM emission factors for four scenarios. The grey shaded area indicates
the timeframe the LEZ is in place.
Table 4. Years in which each scenario reaches 50% and 75% reduction in PM average emission factor and the numbers of years accelerated in
comparison to the scenario with no LEZ.
Reduction in PM Number of years
average emission factor Scenario Year accelerated
No LEZ 2026
50% LEZ - Buy cleanest petrol 2024 1.6
LEZ - Buy minimum requirement 2024 2.3
LEZ - Switch to zero-emission activity 2024 2.3
No LEZ 2030
75% LEZ - Buy cleanest petrol 2026 4.2
LEZ - Buy minimum requirement 2025 4.5
LEZ - Switch to zero-emission activity 2025 4.6
EMISSION IMPACTS OF ACCELERATED remains the same, reductions in fleet-average NOX and
PM emission factors are achieved more rapidly.
LEZ IMPLEMENTATION
Accelerated implementation of the suggested LEZ Figure 7 shows the effects of the accelerated LEZ
design would bring about more immediate emission implementation on average NOX emission factors.
benefits. Under this implementation timeline, the same With the accelerated timeline, the last phase of the
phases are implemented every year, instead of every LEZ is implemented in 2027, five years earlier than
other year, through 2027. As the timeframe of all LEZ that of the less rapid implementation timeline. By
phases moves forward while the natural fleet turnover 2027, the projected NOX emission factor reduction
12Mean distance−specific NOX emission factor (mg/km) 0
400
Phase 1
25
Reduction in emission factor (%)
Scenario
300 No LEZ
Phase 2 Buy
minimum
50 requirement
200 Buy
cleanest petrol
Phase 3
Switch to
zero−emission
75 activity
100
Phase 4
Phase 5
0 Phase 6
100
2021 2022 2023 2024 2025 2026 2027
Year
Figure 7. The effects of the accelerated implementation timeline of the low-emission zone on fleet-average passenger car NOX emission factors for
four scenarios. The grey shaded area indicates the timeframe the LEZ is in place.
Table 5. Years in which the baseline scenario and the scenarios that assume the accelerated LEZ implementation reach 50% and 75% reduction in
average NOX emission factor and the numbers of years accelerated in comparison to the scenarios with no LEZ.
Reduction in NOX Number of years
average emission factor Scenario Year accelerated
No LEZ 2030
50% LEZ - Buy minimum requirement 2025 5.3
LEZ - Buy cleanest petrol 2024 6.6
LEZ - Switch to zero-emission activity 2024 6.7
No LEZ 2035
75% LEZ - Buy minimum requirement 2026 9.6
LEZ - Buy cleanest petrol 2025 10.5
LEZ - Switch to zero-emission activity 2025 10.7
for the No LEZ scenario is 33%. The accelerated fleet in 2024 and 2025, respectively. Only from
LEZ implementation could achieve a similar level Euro 6d-TEMP, diesel vehicles show a significant
of reduction between 2023 and 2025 and exceed a improvement in emission performance and therefore
90% reduction by 2027. The responses of vehicle help achieve a significant reduction in Phase 5.
owners have a significant impact on the emission
benefits until Phase 5. The buy minimum requirement Again, we take the points at which each scenario
scenario shows a significantly less reduction than achieves a 50% and 75% reduction in the fleet-
the buy cleanest petrol or the switch to zero-emission average NOX emission factor relative to the 2021
activity scenarios because of the predominant shares level in order to compare the results with those of
of diesel Euro 5 and diesel Euro 6 in the city’s total the less rapid LEZ implementation explored earlier in
13
IMPACTS OF A LOW-EMISSION ZONE IN SOFIA | DECEMBER 2021the study. Our results show that with the accelerated the slower LEZ implementation. These findings are
LEZ implementation, the 50% reduction goal is met summarized in Table 5.
approximately five to seven years earlier compared
with the case with no LEZ and around two years Figure 8 shows the evolution of average PM emission
earlier compared with the case of the less rapid LEZ factors for the four modeled scenarios in the case of
implementation. With regards to the 75% reduction the accelerated LEZ implementation. All LEZ scenarios
goal, the accelerated LEZ implementation reaches the show more expedited decrease in the average PM
target around 10 to 11 years earlier than the no LEZ emission factor compared with the LEZ scenarios with
case and around 3 to 4 years earlier than achieved by implementation at two-year intervals. Notably, banning
pre-Euro 5 vehicles, whether they are replaced by
0
10.0
Mean distance−specific PM emission factor (mg/km)
25
Reduction in emission factor (%)
7.5 Phase 1 Scenario
No LEZ
Buy
minimum
5.0 50 requirement
Buy
Phase 2 cleanest petrol
Switch to
zero−emission
2.5 75 activity
Phase 3
Phase 4
Phase 5
0 Phase 6
100
2021 2022 2023 2024 2025 2026 2027
Year
Figure 8. The effects of the more stringent low-emission zone on fleet-average passenger car PM emission factors for four scenarios. The grey
shaded area indicates the timeframe the LEZ is in place.
Table 6. Years in which the baseline scenario and the scenarios that assume the accelerated LEZ implementation reach 50% and 75% reduction in
average PM emission factor and the numbers of years accelerated in comparison to the scenarios with no LEZ.
Reduction in PM Number of years
average emission factor Scenario Year accelerated
No LEZ 2026
50% LEZ - Buy minimum requirement 2023 2.5
LEZ - Buy cleanest petrol 2023 3.0
LEZ - Switch to zero-emission activity 2023 3.0
No LEZ 2030
75% LEZ - Buy minimum requirement 2024 5.9
LEZ - Buy cleanest petrol 2024 6.2
LEZ - Switch to zero-emission activity 2024 6.2
14other diesel vehicles equipped with diesel particulate vehicle restrictions at a faster pace. The LEZ schedule
filters, petrol vehicles, or zero-emission modes, will that tightens restrictions every year would deliver a 75%
have substantial benefits. By 2027, the average PM reduction in NOX emissions approximately three years
emission factors estimated for all LEZ scenarios are at earlier and PM emissions two years earlier than the two-
least 80% lower than in the baseline scenario, which year interval schedule.
is a greater relative reduction than what any LEZ
scenarios can achieve at the end of the less rapid LEZ Incentives to switch to clean or zero-emission vehicles
implementation timeline. would maximize the emission reduction benefits of
the LEZ. When the non-compliant vehicles are replaced
The accelerated implementation of LEZ shortens by clean vehicles or zero-emission transport, the LEZ
the time in which a 50% reduction in the average yields a greater reduction in emissions. If affected
PM emission factor is achieved by about three years drivers buy the minimum compliant vehicles, such as
compared with the no LEZ scenario and by one year marginally cleaner used cars, the NOX emission benefits
compared with the less rapid LEZ implementation of the LEZ are delayed significant until all pre-Euro
case (Table 6). The differences are more striking for 6d diesel vehicles are restricted. This finding implies
the 75% reduction goal. With the accelerated LEZ that creating incentives for affected drivers to buy the
implementation, a 75% reduction in average PM best available standards or to opt for zero-emission
emission factors is achieved around 1.7 years earlier transport options is necessary to maximize the impact
than with the slower implementation. of the LEZ. It is also important that these measures aim
at helping lower-income drivers buy clean vehicles and
More details on the evolution of average NOX and PM more easily access zero-emission transport, such as
emission factors in the case of the accelerated LEZ public transit, cycling, and walking. For example, these
implementation are summarized in Table A2 of can be purchase subsidies, development of charging
the appendix. infrastructure network, and consumer awareness
campaign at both national and local levels. Ensuring that
SUMMARY AND POLICY regular drivers in the LEZ are aware of the progressive
restrictions that tighten every year or two could also
IMPLICATIONS help drivers make well-informed purchasing decisions
rather than buying used vehicles that will have to be
This analysis of the emissions impacts of a low- replaced in successive years.
emission zone in Sofia reveals that the LEZ designed
for this study can achieve a significant reduction in Implementation of an LEZ should be supported with
traffic-related NOX and PM emissions regardless of other policies to promote fair transition. An LEZ can
how vehicle owners may respond to such a policy. In play an important role in addressing the fact that low-
cities like Sofia, where the average vehicle is relatively income populations that are less likely to own a vehicle
old and thus more polluting, LEZs can accelerate are disproportionately affected by air pollution. 24 An
transitions to cleaner transportation. A summary of LEZ could alleviate the unequal distribution of health
our findings and how they can inform effective LEZ damages by tackling one of the main sources of air
policy in Sofia are described below. pollution in Sofia. Furthermore, lower-income drivers
tend to be the least able to purchase new cars, as
A well-designed LEZ could significantly accelerate newer, cleaner vehicles are more costly. A just LEZ
reductions in NOX and PM emissions in Sofia. policy should thus consider increasing access to public
A gradual phase-in of LEZ restrictions not only transport by improving public transportation and cycling
progressively increases emission benefits but also infrastructure and ensuring that public transport is
provides affected drivers adequate lead time to plan more affordable than private cars. In addition, financial
their future vehicle purchases. The implementation support could be offered to help lower-income groups
steps that phase out pre-Euro 6 diesel for NOX purchase clean or zero-emission vehicles. A successful
emissions and pre-Euro 5 diesel vehicles for PM example of such a program is the French scrappage and
emissions are especially important for achieving EV replacement scheme that has helped France stabilize
emission reductions. Moreover, greater emission
benefits can be achieved more quickly by tightening
24 Müller and Le Petit.
15
IMPACTS OF A LOW-EMISSION ZONE IN SOFIA | DECEMBER 2021emissions from new passenger cars and increase
sales of electric cars. 25 Establishing different rules
LIMITATIONS AND
for residents and small business owners and setting
exceptions for emergency vehicles and drivers and
RECOMMENDATIONS FOR
passengers with disabilities should also be considered. FURTHER RESEARCH
Monitoring and enforcement are key to ensure the This study is based on modeling that relied on a number
effectiveness of the LEZ. The effectiveness of a LEZ in of assumptions which impact the results. The main
reducing emissions depends on numerous factors related assumptions included full compliance of all affected
to the LEZ design, such as enforcement mechanisms, the drivers, three purchasing patterns in response to an LEZ,
area covered, and stringency. City-specific factors can and a constant total vehicle activity. Compliance rates
also impact its effectiveness, such as the contribution and the behavior of affected drivers may vary depending,
of road transport to air pollution, the prevalence of for example, on the level of awareness in drivers, the
certain vehicle types and standards, and driver behavior. existence of a scrappage incentive scheme, or the
Projections can help shape how the LEZ is initially accessibility of public transport. It is uncertain whether
designed but monitoring is necessary to evaluate the the total number of vehicles driven may decrease as
effectiveness of the LEZ once put in place. Monitoring a result of an LEZ or if there will be an influx of new
of ambient air quality in the LEZ, compliance rates, and vehicles, a phenomenon that Sofia has experienced in the
the responses of affected drivers gives an opportunity last few years due to its growth. Further studies that track
to evaluate the policy performance and calibrate areas the changes in traffic activity, including the overall fleet
of improvement. Continuous investigation of real-world composition, and survey compliance with the LEZ will be
emissions would also help address uncertainties in able to inform LEZ policies.
long-term emission performance of new vehicles, such
Future study should extend the focus to beyond
as Euro 6d diesel, and inform readjustments over time.
passenger cars and other pollutants, such as
Moreover, transparent communication of such process
hydrocarbons (HC), carbon monoxide (CO), and
will be important to build public support around next
ammonia (NH3), that pose a threat to human health.
phases or the expansion of the LEZ.
Light-commercial and heavy-duty vehicles made up
More ambitious LEZ options should be considered. 14% and 0.2% of the total measurements, respectively,
The LEZ assessed in this study is one example of an and are likely to have higher distance-specific emissions
LEZ that we designed based on the area currently under than passenger cars but were not accounted for in this
consideration. Aside from accelerated implementation, study. Capturing the entirety of the existing vehicle
a more ambitious LEZ policy can include scaling up fleet will help account for the total emissions in the LEZ
to cover the entire city or a greater geographic area area. Including other pollutants that may come from
over time to reap greater emission benefits for a larger sources other than tailpipes would further help address
fraction of residents. The Paris LEZ provides a good dangerous pollutants that are currently not regulated.
example of an LEZ first applied to the City of Paris and
In addition, conducting new remote sensing
then and gradually expanding to the Greater Paris area
campaigns in Sofia could be used to monitor and
over time, eventually covering the entire Metropolitan
measure the effects of the LEZ. The additional remote
area. 26 Moreover, LEZ restrictions can be eventually
sensing measurements would help define local
extended to all vehicles that are certified below Euro 7,
emission factors that can be used to produce refined
as the fuel-neutral standard that is expected to deliver a
projections. Regular testing campaigns can also offer a
significant reduction in pollution. 27
means of continuous monitoring and evaluation of the
LEZ implementation stages.
25 Sandra Wappelhorst, “Actions Speak Louder than Words: The French
Commitment to Electric Vehicles,” ICCT Staff Blog (blog), January 16,
2020, https://theicct.org/blog/staff/actions-speak-louder-words-french-
commitment-electric-vehicles.
26 Bernard et al., “Impacts of the Paris Low-Emission Zone and Implications for
Other Cities.”
27 Eamonn Mulholland, Josh Miller, Caleb Braun, Lingzhi Jin, and Felipe
Rodríguez, Quantifying the long-term air quality and health benefits from Euro 7/
VII standards in Europe, (Washington, DC: ICCT, 2021), https://theicct.org/
publications/eu-euro7-standards-health-benefits-jun21.
16APPENDIX
The tables below show the changes in the emission factors and the percent changes compared to the reference
year (2021) for both NOX and PM. Table A1 corresponds to Figures 5 and 6 and Table A2 to Figures 7 and 8 in the
results section.
Table A1. Mean distance-specific NOX and PM emission factors for all scenarios when each phase of the LEZ is implemented every two years.
Change in NOX Percent change Change in PM Percent change
emission factor compared to emission factor compared to
Scenario Phase Year (mg/km) 2021 (mg/km) 2021
Phase0 2021 456 0% 10.3 0%
Phase1 2022 425 -7% 9.1 -11%
Phase2 2024 372 -18% 6.9 -33%
No LEZ Phase3 2026 327 -28% 4.9 -52%
Phase4 2028 281 -38% 3.4 -66%
Phase5 2030 234 -49% 2.5 -76%
Phase6 2032 185 -59% 1.8 -83%
Phase0 2021 456 0% 10.3 0%
Phase1 2022 414 -9% 8.3 -19%
Phase2 2024 348 -24% 5.5 -46%
LEZ - Buy
minimum Phase3 2026 311 -32% 1.8 -82%
requirement
Phase4 2028 191 -58% 1.4 -86%
Phase5 2030 68 -85% 1.2 -88%
Phase6 2032 33 -93% 0.8 -92%
Phase0 2021 456 0% 10.3 0%
Phase1 2022 385 -15% 7.8 -24%
Phase2 2024 291 -36% 4.2 -59%
LEZ - Buy
Phase3 2026 206 -55% 1.6 -85%
cleanest petrol
Phase4 2028 93 -80% 1.2 -88%
Phase5 2030 45 -90% 1 -91%
Phase6 2032 27 -94% 0.7 -93%
Phase0 2021 456 0% 10.3 0%
Phase1 2022 383 -16% 7.8 -24%
LEZ - Switch to Phase2 2024 286 -37% 4.1 -60%
zero-emission
Phase3 2026 202 -56% 1.5 -86%
activity
Phase4 2028 86 -81% 1 -90%
Phase5 2030 35 -92% 0.7 -93%
Phase6 2032 11 -98% 0.3 -97%
17
IMPACTS OF A LOW-EMISSION ZONE IN SOFIA | DECEMBER 2021Table A2. Percentage decreases of NOX and PM average emission factors for all scenarios in the more stringent LEZ design.
Change in NOX Percent change Change in PM Percent change
emission factor compared to emission factor compared to
Scenario Phase Year (mg/km) 2021 (mg/km) 2021
Phase0 2021 456 0% 10.3 0%
Phase1 2022 425 -7% 9.1 -11%
Phase2 2023 397 -13% 8 -22%
No LEZ Phase3 2024 372 -18% 6.9 -33%
Phase4 2025 349 -23% 5.9 -43%
Phase5 2026 327 -28% 4.9 -52%
Phase6 2027 304 -33% 4.1 -60%
Phase0 2021 456 0% 10.3 0%
Phase1 2022 414 -9% 8.3 -19%
LEZ - Buy Phase2 2023 365 -20% 6.2 -40%
minimum
Phase3 2024 343 -25% 2 -81%
requirement
Phase4 2025 216 -53% 1.5 -85%
Phase5 2026 76 -83% 1.3 -87%
Phase6 2027 36 -92% 0.8 -92%
Phase0 2021 456 0% 10.3 0%
Phase1 2022 385 -15% 7.8 -24%
Phase2 2023 288 -37% 4.4 -57%
LEZ - Buy
cleanest petrol Phase3 2024 188 -59% 1.5 -85%
Phase4 2025 93 -80% 1.2 -88%
Phase5 2026 45 -90% 1 -91%
Phase6 2027 28 -94% 0.7 -93%
Phase0 2021 456 0% 10.3 0%
Phase1 2022 383 -16% 7.8 -24%
LEZ - Switch to Phase2 2023 282 -38% 4.3 -58%
zero-emission
Phase3 2024 178 -61% 1.4 -87%
activity
Phase4 2025 75 -83% 0.9 -91%
Phase5 2026 31 -93% 0.6 -94%
Phase6 2027 7 -98% 0.1 -99%
18You can also read