Indian Point Replacement Analysis: A Clean Energy Roadmap
←
→
Page content transcription
If your browser does not render page correctly, please read the page content below
Indian Point Replacement Analysis:
A Clean Energy Roadmap
A Proposal for Replacing the Nuclear Plant
with Clean, Sustainable Energy Resources

Prepared for the Natural Resources Defense
Council and Riverkeeper

October 11, 2012

Tim Woolf, Melissa Whited, Tommy Vitolo,
Kenji Takahashi, and David White

Table of Contents
EXECUTIVE SUMMARY ..................................................................................................1

1. INTRODUCTION ........................................................................................................14

2. THE NEW YORK STATE ELECTRIC SYSTEM .......................................................16
          2.1 Recent Developments: New York Energy Highway Initiative ...................................... 16

          2.2 Current Electricity Resource Needs and Future Uncertainties .................................... 19

          2.3 Future Electricity Resource Needs without Indian Point ............................................. 22

          2.4 Recent Assessments of Maintaining Reliability without Indian Point .......................... 24

3. OPPORTUNITIES FOR ENERGY EFFICIENCY RESOURCES ...............................27
          3.1 Current Policies Supporting Energy Efficiency ............................................................ 27

          3.2 Energy Efficiency Savings from Current Initiatives ..................................................... 29

          3.3 Energy Savings Opportunities from Additional Initiatives .......................................... 32

          3.4 Policies to Support Additional Initiatives ..................................................................... 37

4. OPPORTUNITIES FOR RENEWABLE RESOURCES ..............................................40
          4.1 Current Policies Supporting Renewable Resources...................................................... 40

          4.2 Renewable Generation and Capacity from Current Initiatives.................................... 42

          4.3 Renewable Resource Opportunities from Additional Initiatives .................................. 44

          4.4 Policies to Support Additional Initiatives ..................................................................... 47

5. REPLACING INDIAN POINT WITH A CLEAN ENERGY PORTFOLIO ................ 50
          5.1 IPEC Replacement Scenarios ........................................................................................ 50

          5.2 Cost Implications of IPEC Replacement ....................................................................... 52

          5.3 Wholesale Market Cost Impacts ................................................................................... 53

          5.4 Public Policy Cost Impacts ............................................................................................ 57

          5.5 Potential Impacts on Retail Electric Bills ..................................................................... 59

WORKS CITED ................................................................................................................61
Figures
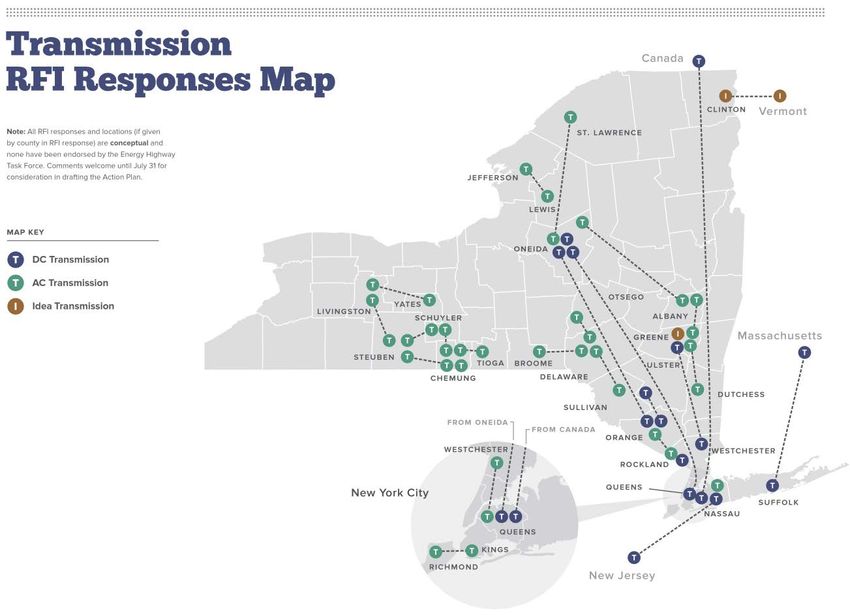
Figure 1: Transmission Responses from Energy Highway RFI ................................................... 18
Figure 2: Capacity (including IPEC) with Forecasted Peak Load for 2012 - 2022 ..................... 19
Figure 3: Capacity (excluding IPEC) with Forecasted Peak Load for 2012 - 2022 ..................... 22
Figure 4: Projected Capacity Surplus with and without Indian Point .......................................... 23
Figure 5: Historical & Forecast Energy Demand under Various Energy Efficiency Assumptions
...................................................................................................................................................... 30
Figure 6. Historical performance of EEPS and NYISO's forecast savings ................................. 32
Figure 7: Statewide Load Forecast: NYISO vs. Alternative Case with Aggressive Energy
Efficiency (GWh) ......................................................................................................................... 33
Figure 8: 2010 State Energy Efficiency Resource Standard Targets vs. Achieved Savings ........ 34
Figure 9: Annual Net Energy Savings: Reference Case vs. Alternative Case ............................. 36
Figure 10: Cumulative Energy Efficiency Savings (MW) above NYISO Reference Case ......... 36
Figure 11: Electricity Generating Capacity in New York State by Fuel Source (MW) ............... 43
Figure 12: Installed Wind Capacity in New York........................................................................ 44
Figure 13: Proposed New Renewable Capacity and Energy ........................................................ 46
Figure 14: Efficiency and Renewable Resources in the Clean Energy Replacement Portfolio ... 51
Figure 15: Efficiency and Renewable Resources in the Clean Energy Portfolio – By Region.... 52
Figure 16: 2011 Supply Curve for New York City and Long Island Zones ................................ 54
Figure 17: Wholesale Energy Market Price Impacts of IPEC Retirement and Clean Energy
Portfolio ....................................................................................................................................... 56
Figure 18: Levelized Resource Costs and Wholesale Market Price ............................................ 59
Tables
Table 1: NYISO Gold Book Proposed Capacity Additions 2012-2022 ....................................... 20
Table 2: Current Estimated Energy Efficiency Savings............................................................... 30
Table 3: Selected States' Annual Savings Targets ....................................................................... 34
Table 4: Proposed Renewable Capacity from Interconnection Queue, Energy Highway RFI, &
NY-Sun Initiative ......................................................................................................................... 45
Table 5: Efficiency and Renewable Resources in the Clean Energy Replacement Portfolio ...... 51
Table 6: Price-Response Coefficient (%Price/%Load) ................................................................ 55
Table 7: Renewable Energy Cost Assumptions ........................................................................... 58Executive Summary
Overview
Indian Point Energy Center (IPEC) in Westchester County, New York currently operates two
nuclear reactors with a combined capacity of 2,060 MW. The original 40-year operating licenses
for these two units are set to expire in 2013 and 2015. In hearings that will commence on
October 15, 2012, the Nuclear Regulatory Commission will consider whether to approve the
plant owner’s application to renew the units’ licenses for an additional twenty years.
In 2011 Synapse Energy Economics prepared a study of the
The case for replacing IPEC with
implications of not relicensing the IPEC units, finding that
clean energy resources is stronger
(a) there would be sufficient capacity to support electric
than ever due to on-going
system reliability in the absence of IPEC; (b) there is a
transmission and generation
significant potential for a variety of electricity resources to
initiatives, and the potential for
replace IPEC; and (c) the cost of replacing IPEC with new
expanding energy from
resources is likely to be modest, on the order of a one to three
renewables and efficiency. The
percent increase in electricity costs.
cost impacts of our clean energy
This report updates our 2011 analysis and focuses on whether scenario are likely to be very small
and how IPEC could be replaced entirely with a portfolio of – on the order of one percent.
clean energy resources, i.e., energy efficiency and renewable
resources. We consider recent developments such as Governor Cuomo’s Energy Highway
Initiative – an effort to identify new sources of power for New York including renewable energy,
traditional generation, and transmission – as well as assess recent data provided by the New
York Independent System Operator (NYISO) regarding future capacity needs. We then identify a
set of policies that the State should pursue to promote the development of a clean energy
replacement scenario.
Our updated analysis reaffirms our previous study’s conclusion that numerous options exist for
safely and cost-effectively replacing IPEC, and also describes an energy replacement strategy for
Indian Point based entirely on energy efficiency and renewable generation. The key findings of
our study demonstrate that:
• IPEC’s two reactors can be retired without undermining the reliability of New York’s
electric system. Even if IPEC’s two units were retired immediately, New York is
projected to retain a capacity surplus through 2020, based on the generation capability
in the New York Independent System Operator’s 2012 Gold Book. Thus, there is at least
seven years for the market and the State to develop the resources necessary to replace
IPEC and maintain a reliable electric system.
• New York could replace the entirety of Indian Point’s 2,060 MW of capacity by
implementing a clean energy portfolio comprised of 1,030 MW of energy efficiency and
Synapse Energy Economics, Inc. – Indian Point Replacement Analysis Page 11,030 MW of renewable capacity. This portfolio of resources could easily be installed by
2022 to replace IPEC, even though the full 2,060 MW will not be needed until sometime
after that. Because of their relatively modular nature, these resources could be installed
gradually over the next decade in order to best meet the growing need for capacity.
• The cost impacts of our clean energy replacement scenario are likely to be very small,
with the net effect being an increase of roughly one percent in costs to customers in
2022, equivalent to roughly one dollar per month for the average residential customer.
• Over the past year, progress has been made in developing new generation and
transmission facilities, such as the 1,136 MW Cricket Valley Energy Center, the 660 MW
Hudson Transmission Project, and the 1,000 MW Champlain Hudson cable. In addition,
the Governor’s Energy Highway Initiative has spurred a significant number of proposals
for developing new generation and transmission facilities.
• New York State has a large amount of untapped energy efficiency that could be used to
help replace IPEC. We estimate that expanding the current energy efficiency initiatives
in the state to more aggressive but very feasible levels could result in 1,600 MW of new
efficiency resources by 2022.
• New York State also has enormous potential to develop new renewable resources. Our
analysis of the renewable resources currently proposed in the Interconnection Queue,
under consideration in the Energy Highway RFI, and called for by the NY-Sun Initiative
could result in the addition of more than 4,000 MW of wind and solar resources by
2022.
Maintaining Reliability in the Event Indian Point is Retired
It is clear that IPEC could be retired without posing reliability problems for the New York electric
system, for several reasons. First, the system currently has a surplus of capacity that is expected
to last many years into the future. Figure ES-1 presents a summary of the electricity capacity
surplus in the state as of 2012, as well as a forecast of how that surplus of capacity is likely to
change over the next decade both with and without IPEC, based upon the New York
Independent System Operator’s expectation of generation changes
over the next few years. As indicated by the blue bars, if IPEC is Based on the 2012 NYISO
retired, the net capacity when accounting for proposed additions and Gold Book data, without
retirements exceeds the reserve requirements through 2020. Thus, IPEC, New York is projected
there is a period of at least seven years for the market and the State to to maintain surplus capacity
develop the resources necessary to replace IPEC and maintain a reliable through 2020.
electric system.
Second, the generation capacity in New York is expected to increase over the next few years. As
indicated by the orange bars in Figure ES-1, NYISO currently projects net capacity additions to
the electric system through 2016. The Bayonne Energy Center (500 MW) and the Marble River
Wind Farms (215 MW) are new generators that NYISO assumes are very likely to reach
Synapse Energy Economics, Inc. – Indian Point Replacement Analysis Page 2commercial operation and thus should be assumed operational for planning purposes. Similarly,
upratings at Nine Mile Point 2 (168 MW) and the Munnsville Wind Power site (6 MW) are also
assumed operational for planning purposes. Additionally, the NYISO Gold Book lists a number of
projects in the Interconnection Queue that have achieved substantial milestones in the approval
process. This list includes, for example, the Cricket Valley Energy Center, which has recently
received several permits and is expected to commence construction in 2013. Finally, the NYISO
Interconnection Queue includes many additional generators that may become operational in
later years, but are not accounted for yet by the NYISO for planning purposes.
Figure ES-1: Capacity Surplus, Including 2012 Gold Book Proposed Additions and Retirements
Source: Figure 4
Third, several new transmission facilities are in the process of being planned, constructed or
completed, which will significantly assist the transmission of power into different regions of the
state, including the regions near IPEC. These include, for example, (a) a 345 kV transmission line
from Bergen, New Jersey to West 49th St in New York City, with a thermal rating of 660 MW;
(b) a 15 MW transformer uprate for an existing 345 kV transmission line from New Jersey to
New York City; and (c) a 320 kV direct current (DC) transmission line from Hydro Quebec to
Astoria, New York, with a thermal rating 1,000 MW.
Fourth, the Governor’s Energy Highway Initiative is expected to spur the development of new
generation and transmission facilities over the next several years. The recent responses from
the Governor’s Request for Information included the following:
• New renewable generation projects, totaling 1,600 to 4,200 MW.
• Repowering projects, in the event that existing marginally economic facilities retire,
totaling as much as 2,400 MW.
• New natural gas-fired generation projects, totaling as much as 4,000 MW.
Synapse Energy Economics, Inc. – Indian Point Replacement Analysis Page 3• Nine new DC transmission projects, ranging in capacity from 500 MW to 2,000 MW
each, designed to bring electricity from Canada, the PJM Electricity Market, and upstate
New York to locations in the region around IPEC. Two of these proposals would deliver
electricity directly into New York City.
• Twenty new alternating current (AC) transmission lines, five of which are new lines
while the remainder are upgrades to existing lines. Two of the new projects are
specifically designed to mitigate contingencies and increase line capacity in the event
that IPEC is retired soon.
Fifth, in the event that IPEC’s retirement is announced, the wholesale electricity markets are
likely to respond with new generation projects beyond what is proposed today.
Finally, there are many steps that the State can take to promote the development of new
resources and maintain the reliability of the electric system in the event that IPEC is retired.
Over the next seven to ten years while there is excess capacity on the system, the State can
(a) modify public policies to promote the development of additional energy efficiency and
renewable resources, as outlined in this report; (b) take steps to develop some of the proposals
submitted in the context of the Energy Highway Initiative; (c) ensure that the wholesale
electricty markets are functioning as effectively as possible, for example by creating a new
capacity zone in the highly-constrained regions near New York City; and (d) in the unlikely event
that reliability becomes threatened in future years, the State can take steps to temporarily
continue operation of existing generators that would otherwise be retired.
Most stakeholders now agree that IPEC could be retired and its power replaced
through a combination of new generation, transmission, and efficiency NYISO testified that
resources, without jeopardizing the reliability of the New York electric system. proposed generation projects
In January 2012 numerous stakeholders testified before the New York State in Southeast New York could
Assembly Standing Committee on Energy and Assembly Standing Committee add up to 2,000 MW of new
on Corporations, Authorities and Commissions regarding IPEC replacement power by 2015 and several
options. Several of the witnesses, including representatives from NYISO and transmission projects could
Consolidated Edison, testified that IPEC could be retired without causing bring up to 3,000 MW online
reliability concerns. At the conclusion of the hearings, the Committee Chairs by 2016. Further, relieving
determined that IPEC could close without threatening reliability or significantly transmission constraints
impacting electric rates, provided proper planning and investments in could free up over 1,500 MW
transmission, energy efficiency, and completion of currently planned resources from existing power plants.
is carried out (NY State Assembly, 2012).
Despite the evidence presented at these hearings, some concern regarding reliability has
persisted. One source of this concern stems from NYISO’s Reliability Needs Assessment (RNA)
sensitivity analyses prepared in 2010 and 2012. These assessments included a sensitivity
analysis in which the IPEC units are not relicensed. The 2012 RNA sensitivity results found that
there would be a deficiency in 2016 if the units were retired in 2013 and 2015 (NYISO, 2012b,
pp. 42-43).
Synapse Energy Economics, Inc. – Indian Point Replacement Analysis Page 4However, it is important to recognize that the RNA IPEC retirement scenario represents a very
conservative scenario, in which NYISO assumes that no new generation will come online after
2013, and all generators that are considering retirement will go offline. In particular:
• The RNA IPEC retirement scenario assumes that no new electricity generators are
installed after 2013, due to the uncertainty of predicting when and where new
generators will be installed. However, there is no question that new generators will be
added to the New York electric system after 2013, especially if IPEC is not relicensed.
For example, the RNA analysis did not include the capacity of the 1,136 MW Cricket
Valley Energy Center in its RNA IPEC scenario.
• The RNA IPEC retirement scenario assumes that all plants that are currently designated
for mothballing or retirement are in fact retired. This results in roughly 1,527 MW of
retirements in addition to what is assumed in the NYISO Gold Book. Some of this
capacity may not be mothballed or retired in the next few years, especially if IPEC is not
relicensed.
• The RNA IPEC retirement scenario does not account for the fact that the State could
take steps to address potential reliability issues following the decision to not relicense
IPEC. However, there are many actions that the State could take to address potential
reliability issues, if needed.
In August 2012, the New York State Energy Planning Board released its New York State
Transmission and Distribution Systems Reliability Study and Report, which specifically addressed
the reliability concerns associated with IPEC retirement. 1 Regarding the draft NYISO RNA
sensitivity analyses that show a potential deficit in capacity following IPEC’s closure, the Energy
Planning Board writes:
“…there are mechanisms in place that would adequately replace any
deficiency related to the closure of the IP [Indian Point] units. New York
has robust planning and regulatory processes that would automatically
implement either market-based options or regulatory backstop
solutions in the event a deficiency is identified.
In addition, there are a variety of generation and transmission projects
that are in different stages of development that could provide adequate
replacement power.” (State Energy Planning Board, 2012, p. 84)
New York State’s energy market is dynamic and flexible, and is subject to thorough reliability
planning processes and regulatory oversight. The retirement of IPEC therefore represents a
1
The New York State Energy Planning Board is directed by the New York State Legislature to undertake
a study of the overall reliability of the State’s electric transmission and distribution systems.
Synapse Energy Economics, Inc. – Indian Point Replacement Analysis Page 5change to the New York electric system that must be properly planned for, but not one that is
likely to threaten the reliability of the electric system.
A Clean Energy Replacement Portfolio
We have created a portfolio consisting of both energy efficiency and renewable resources to
illustrate how a combination of such clean energy resources can be used to replace IPEC. Our
portfolio includes equal amounts of energy efficiency and renewable capacity, with each
resource type contributing 1,030 MW to replace the 2,060 MW from IPEC. We assume that this
portfolio of resources could be installed by 2022 to replace IPEC, even though the full 2,060 MW
will not be needed until sometime after that.
Figure ES-2: Efficiency and Renewable Resources in the Clean Energy Replacement Portfolio
6,000 18,000
IPEC Current
5,000 Res Solar PV 15,000
C&I Solar PV
Utility Solar PV
4,000 12,000
Offshore Wind
Onshore Wind
GWh
MW
3,000 Energy Efficiency 9,000
2,000 6,000
1,000 3,000
0 0
Nameplate Derated IPEC Capacity Replacement IPEC Energy
Replacement Replacement (MW) Energy (GWh)
Capacity Capacity (GWh)
(MW) (MW)
Source: Figure 14
For energy efficiency, we assume that a portion of the incremental savings described below will
contribute to the clean energy portfolio. These resources will be distributed throughout the
state roughly according to where the electricity demand is located.
For renewable resources, we include renewable capacity at the UCAP value, because this is the
value that is comparable to the capacity from IPEC for reliability purposes. 2 We choose a mix of
renewable resources that reflects the mix of those resources currently proposed in the
Interconnection Queue, the Energy Highway RFI, and the NY-Sun Initiative. Figure ES-2 presents
the mix of efficiency and renewable resources included in our illustrative clean energy portfolio.
2
Capacity values are reported in Summer Unforced Capacity MW, or UCAP, which is the net anticipated
useable capacity when outages and other generator operating characteristics are considered.
Synapse Energy Economics, Inc. – Indian Point Replacement Analysis Page 6Potential Costs of the Clean Energy Replacement Scenario Retiring IPEC and replacing it with a portfolio of clean energy resources will have two primary impacts on costs to New York electricity customers. First, wholesale electricity market costs will be impacted by a combination of generation supply mix changes and demand reduction. Second, additional costs will be incurred to support the development of expanded energy efficiency programs and renewable generation. We refer to these latter costs as “public policy” costs, because they will be incurred as a result of public policy mechanisms, such as the energy efficiency system benefits charge and the renewable energy certificates. We estimate the impacts on wholesale electricity markets by constructing a supply curve of the generation resources in the New York electricity market. We start with actual data for 2011, creating supply curves for annual, summer, winter, and spring/fall seasons in order to capture the different market impacts across the different seasons. We also create supply curves for two separate regions of the state: (1) New York City and Long Island, and (2) the rest of the state. These two regions currently experience significantly different wholesale electricity prices. Then we construct the same set of supply curves for 2022 by modifying the 2011 curves to account for expected changes in generation capacity and fuel costs. For each of the 2022 supply curves we create one that includes IPEC capacity and energy, and one that includes the capacity and energy from our clean energy portfolio. We then take the difference in average costs to estimate the likely impact of replacing IPEC on the electricity market costs. Figure ES-3: Wholesale Energy Market Price Impacts of IPEC Retirement and Clean Energy Portfolio Source: Figure 17 Figure ES-3 illustrates some of our findings. The leftmost bar indicates that if IPEC is removed from the system with no replacement, the wholesale energy cost is likely to increase by roughly 16 percent for the whole state. When energy efficiency is included in the market, along with the IPEC retirement, the increase in wholesale energy costs is on the order of six percent. When Synapse Energy Economics, Inc. – Indian Point Replacement Analysis Page 7
renewable resources are added to the system, along with the efficiency and the IPEC retirement,
wholesale electricity costs are likely to be reduced by approximately two percent.

We then estimate the public policy costs that are likely to be required to implement the clean
energy portfolio. Figure ES-4 presents an estimate of these costs on a $/MWh basis. We
forecast that the overall electricity market price in 2022 is likely to be roughly $70/MWh,
including both energy and capacity. The energy efficiency resources included in our portfolio
are likely to cost approximately $30/MWh, resulting in a savings of $40/MWh as compared with
the market price of energy. The renewable resources are all expected to cost more than the
market price, as indicated in the graph. The public policy costs of the renewable resources will
equal the difference between the renewable resource costs and the electricity market price of
$70/MWh.

Figure ES-4: Public Policy Costs of the Clean Energy Portfolio

Source: Figure 18

We estimate that the public policy costs are likely to include more than $200 million in savings
from energy efficiency and approximately $750 million in costs for renewable resources, for a
net cost of roughly $550 million per year. This represents an increase in New York system
electricity costs on the order of two percent.

In terms of customers’ electricity bills, the impacts of the wholesale energy market will affect
only that portion of the bill that includes the energy generation costs, rather than the portion
that includes charges for distribution and other services. For residential customers, the energy
portion is typically about half of the bill. The public policy costs, on the other hand, are
generally collected across the entire bill. When these two effects are combined, we estimate
that the total impact on customers’ bills will be very small, on the order of a one percent
increase.

For a typical residential customer this would translate into roughly one dollar per month in
increased costs. Those customers that participate in the expanded energy efficiency programs
in our portfolio will see reductions in electricity bills that far outweigh this increase in cost.

Synapse Energy Economics, Inc. – Indian Point Replacement Analysis                           Page 8
Energy Efficiency Opportunities
The state of New York has supported various successful energy efficiency programs and policies
for many years. Nonetheless, there is no question that a large amount of cost-effective
efficiency resources remains undeveloped.

The NYISO Gold Book includes forecasts of future electricity load, both with and without energy
efficiency. As indicated in Figure ES-5, the current forecast assumes that under current planning
assumptions, efficiency savings will decline over the next decade, and by 2019 will be less than
half of what they are today.

Figure ES-5: Annual Energy Efficiency Savings Assumed by NYISO versus Our Analysis

Source: Figure 9

We recommend that the State take an alternative, lower-cost approach and pursue higher levels
of energy efficiency savings. Energy efficiency program administrators should pursue a slightly
more aggressive level of savings over the next few years, on the order of what several leading
states are achieving today, and then maintain this level of savings for at least the next decade.

This increase in energy efficiency savings will be sufficient to provide more than 1,600 MW of
new energy efficiency capacity by the end of the decade. As indicated in Figure ES-6, much of
this energy efficiency capacity (more than 900 MW) could be installed in the New York City and
Long Island area where the need for electricity capacity is greatest.

This energy efficiency can be installed at very low cost. The energy efficiency program budgets
for 2012-2015 approved by the Public Service Commission for New York program administrators
exhibit an average cost of less than $30/MWh, much lower than any other electricity resource
available.

Synapse Energy Economics, Inc. – Indian Point Replacement Analysis                         Page 9
Figure ES-6: Cumulative Energy Efficiency Available from Our Analysis

Source: Figure 10

Renewable Resource Opportunities
Over the past decade, New York has begun to tap into its significant renewable energy resource
base with policies to support the development of wind, solar, and other renewable resources.
For example, since 2005, NYSERDA has procured 1,862 MW of new renewable capacity
(NYSERDA, 2012c). Nonetheless, there remains a significant amount of renewable resources
that can be developed, both to help replace IPEC and to meet other important state energy
goals.

There are numerous proposals for adding new renewable resources to the system soon. For
example:

    •    The 2012 NYISO Gold Book assumes for planning purposes that 1,288 MW (143 MW
         derated) of renewable capacity will be installed over the next several years.

    •    The NYISO Interconnection Queue includes an additional 1,312 MW (215 MW derated)
         of renewable projects that are in varying stages of development.

    •    The Energy Highway Request for Information resulted in several new proposals for
         renewable generators of various types, totaling at least 1,047 MW (335 MW derated)
         beyond what is included in the NYISO Gold Book or Interconnection Queue.

    •    Furthermore, the NY-Sun Initiative – a solar photovoltaic (PV) expansion program – is
         expected to spur the development of PV facilities throughout the state.

Figure ES-7 presents a summary of the renewable resources that have been proposed to date
from the Interconnection Queue, the Energy Highway RFI, and the NY-Sun Initiative. As
indicated, more than 4,000 MW of renewable capacity could be developed from these proposals
alone.

Synapse Energy Economics, Inc. – Indian Point Replacement Analysis                        Page 10
We also present the amount of UCAP capacity available from these different renewable
resources in order to indicate the extent to which NYISO will account for the reliability value of
the intermittent renewable resources. Even after accounting for the UCAP value, there is nearly
1,000 MW of derated capacity available from these proposals. Given that currently proposed
renewable projects could replace nearly half of IPEC’s capacity, it is reasonable to expect that
new renewables could provide 1,030 MW of capacity by 2022, as significantly more renewables
could be developed over the next decade to help replace IPEC. In particular, there remains a
large untapped potential in New York for onshore wind, offshore wind, rooftop PV, and utility-
scale PV.
Figure ES-7: Proposed Capacity and Energy from Renewable Resources (Queue, RFI, & NY-Sun)
6,000 12,000
5,000 10,000
Hydro
4,000 Biomass & Methane 8,000
Solar
GWh
MW
3,000 6,000
Offshore Wind
2,000 Onshore Wind 4,000
1,000 2,000
0 0
Nameplate (MW) UCAP (MW) Energy (GWh)
Source: Figure 13
Recommended Policy Options for Implementing the Clean Energy Replacement
Portfolio
There are a number of policy options that the State could adopt to promote the development of
the clean energy replacement portfolio. We recommend the following policies be adopted to
promote energy efficiency resources:
• Update the Energy Efficiency Portfolio Standard Goal. This goal should be updated in
the spring of 2013 to allow program administrators and other stakeholders time to
respond by 2015. The new goal should encourage program administrators to pursue all
cost-effective energy efficiency, and should require a minimum level of annual
electricity savings of 1.5 percent per year.
Synapse Energy Economics, Inc. – Indian Point Replacement Analysis Page 11• Improve the energy efficiency screening process. The Public Service Commission should
require that energy efficiency resources be screened at the program level, not at the
measure level, in order to minimize lost opportunities, recognize the interdependence
of energy efficiency measures, and promote equity across customer types.
• Enable the spending of the full energy efficiency budget. The State should work with
the efficiency program administrators to assess the barriers to spending the existing
energy efficiency funds and identify ways to overcome them.
• Enable energy efficiency to participate in wholesale electricity markets. The State
should allow energy efficiency to participate in wholesale electricity markets in order to
improve the efficiency of those markets and provide revenues to support additional
efficiency.
• Provide resources and support to enforce building codes. NYSERDA should continue and
expand its support for architects, engineers, builders, code officials, and energy
modelers.
• Facilitate greater private sector support for clean energy These policy options can
resources. The State should take steps to create the right be considered “no
market conditions for the private sector to support energy regrets” options: they all
efficiency and renewable resources. For example, this should make sense on their own
include more public-private partnerships such as a Green Bank, regardless of whether
and other financing strategies such as Property Assessed Clean IPEC is retired soon.
Energy (PACE).
We recommend the following policies be adopted to promote renewable resources:
• Update and expand the RPS. The State should update the RPS structure and goals in the
spring of 2013 to allow NYSERDA and project developers time to prepare for compliance
after 2015. The new goal should require renewables to provide 30 percent of annual
energy by 2016, with that goal increasing by one percent each year thereafter.
• Improve the NYSERDA renewable energy certificates (RECs) solicitation process.
NYSERDA should issue solicitations on a more predictable basis, should offer higher
prices for RECs as needed, and should coordinate their solicitations with NYPA and LIPA.
• Modify the RPS to support specific technologies. The RPS should include additional tiers
to support the development of offshore wind and PV because of the unique benefits
that these resources offer the state.
• Extend the NY-Sun Initiative. This initiative should be extended legislatively to run for
ten years, with a goal of providing 2,200 MW of solar power by 2022, and could provide
$1.5 billion in support for solar projects.
• Support and Expand the Offshore Wind Collaborative. This effort should be supported
in order to increase the development of this key resource located in the regions near
Synapse Energy Economics, Inc. – Indian Point Replacement Analysis Page 12New York City and Long Island. The Collaborative should establish a goal of developing
5,000 MW of offshore wind by 2020, and support this goal with siting and long-term
financing support for offshore wind.
• Implement Public-Private Financing Strategies for Renewables and Efficiency. New York
State should also do a lot more to leverage its support for efficiency and renewables by
creating the right market conditions for the private sector to step in. This should include
implementation of more public-private partnerships such as a Green Bank and other
financing strategies such as commercial Property Assessed Clean Energy (PACE)
financing programs.
Note that these policy options can all be considered “no regrets” options. That is, they all make
sense on their own regardless of whether IPEC is retired soon. However, in the event that IPEC
is retired, it will be especially important to implement these policies to ensure that the state is
able to maintain an electric system that is both clean and reliable.
Synapse Energy Economics, Inc. – Indian Point Replacement Analysis Page 131. Introduction
Indian Point Energy Center (IPEC) in Westchester County, New York currently operates two
nuclear reactors with a combined capacity of 2,060 MW. The original 40-year operating licenses
for these two units are set to expire in 2013 and 2015, and it is uncertain whether the Nuclear
Regulatory Commission (NRC) will approve the units’ license renewals, particularly given recent
operating and waste disposal legal challenges. 3 Therefore it is an opportune time for New York
to consider alternatives to the Indian Point Energy Center.
The NRC’s Atomic Safety and Licensing Board is currently scheduled to hold hearings regarding
IPEC’s relicensing on October 15-24, 2012. However, on June 8, 2012, the U.S. Court of Appeals
for the District of Columbia invalidated the Nuclear Regulatory Commission’s Waste Confidence
Decision Update and directed the NRC to perform a more thorough analysis of the risks
regarding temporary storage and permanent disposal of nuclear waste. 4 This evaluation of
waste storage risks must now be completed prior to a decision being made concerning IPEC’s
relicensing.
This report focuses on whether and how IPEC could be safely retired and its capacity replaced by
clean energy resources, i.e., energy efficiency and renewable generation, and the policies that
would be needed to support this transition. Synapse Energy Economics prepared this analysis at
the request of the Natural Resources Defense Council, Inc. and Riverkeeper, Inc. 5 This analysis
is an update to the 2011 report titled Indian Point Energy Center Nuclear Plant Retirement
Analysis, which found that a surplus of capacity exists near IPEC resulting in no need for
additional capacity for reliability purposes until 2020. Additionally, the 2011 analysis concluded
that IPEC’s capacity could be replaced through a combination of energy efficiency and demand
response, local renewable resources, repowering of existing older power plants, and new
efficient generation plants. The economic impact of such a replacement strategy on customer
3
The Indian Point units’ two federal operating licenses expire in September 2013 and December 2015,
although they may be administratively extended by the Nuclear Regulatory Commission (NRC) if
currently pending relicensing proceedings are not resolved by those dates. Additionally, in August
2012, the NRC voted to postpone its decision regarding Indian Point’s relicensing until it addresses
issues of spent fuel storage.
4
In its decision on State of New York v. NRC No. 11-1045 regarding the NRC’s rulemaking on temporary
storage and permanent disposal of nuclear waste, the court held that “the rulemaking at issue here
constitutes a major federal action necessitating either an environmental impact statement or a finding
of no significant environmental impact. We further hold that the Commission's evaluation of the risks
of spent nuclear fuel is deficient….” The court directed the NRC to provide a more thorough analysis
than it provided in the Waste Confidence Decision Update.
5
Synapse Energy Economics, Inc. is a research and consulting firm specializing in energy, economic and
environmental topics. Additional information about Synapse Energy Economics and the report
authors is available at www.synapse-energy.com.
Synapse Energy Economics, Inc. – Indian Point Replacement Analysis Page 14bills was estimated to be modest, and customers who participate in energy efficiency programs
would experience an overall reduction in their bills due to energy savings.
Our updated analysis reaffirms our previous study’s conclusion that numerous options exist for
safely and cost-effectively replacing IPEC and takes new developments into account. The New
York energy landscape has changed since the 2011 Synapse study. A key development is
Governor Cuomo’s Energy Highway Initiative, the purpose of which is to modernize New York
State’s energy system through upgraded transmission capabilities and energy projects.
Additionally, the New York Independent System Operator (NYISO) has released updated load
and energy forecasts pertaining to New York’s electricity needs for the next decade.
Our analysis is based upon existing literature regarding electricity resource development in New
York, particularly the New York Independent System Operator Gold Book, which contains
forecasts of peak demand and a comprehensive queue of electricity resources that are currently
being proposed (NYISO, 2012a). Transmission and energy project proposals from the Energy
Highway Initiative are also considered.
We note at the outset that this report provides an overall assessment of the potential
opportunities and costs associated with replacing IPEC’s energy and capacity, based upon
readily available current data. The actual impacts of retiring IPEC will depend upon a variety of
factors in the New York electricity market that are very difficult to forecast with precision at this
time. Nonetheless, our analysis provides useful information illustrating some likely impacts. 6
6
This report does not address the policy arguments for or against relicensing of the IPEC units or the
environmental, public health and safety issues associated with IPEC.
Synapse Energy Economics, Inc. – Indian Point Replacement Analysis Page 152. The New York State Electric System
Below we discuss the current state of New York’s electric system and possible developments
over the coming decade, followed by an analysis of the effect of IPEC’s retirement on system
reliability.
At the outset we note that any electric system has both capacity and energy requirements.
Capacity (measured in megawatts) represents the system’s ability to generate enough electricity
in order to meet peak demand. Energy (measured in megawatt-hours) represents the total
amount of electricity generated to meet demand over a given period of time (e.g., over the
course of a year). To ensure reliability, the system must have sufficient capacity to meet the
highest anticipated amount of electricity demand in any one hour.
Over the past year, progress has been made in developing new generation and transmission
facilities, such as the 1,136 MW Cricket Valley Energy Center, the 660 MW Hudson Transmission
Project, and the 1,000 MW Champlain Hudson cable. In addition, the Governor’s Energy
Highway Initiative (discussed in the following section) has spurred a significant number of
proposals for developing new generation and transmission facilities.
2.1 Recent Developments: New York Energy Highway Initiative
In his 2012 State of the State address, Governor Cuomo called for the construction of an “energy
highway,” a public-private partnership to upgrade and modernize New York’s energy system.
The goals of the New York Energy Highway Initiative include
reducing constraints on transmission throughout the state, as “Just as we built the New York State
well as encouraging the development of renewable generation Thruway to unite distant parts of the
(Anderson, 2012). The Energy Highway is envisioned to bring state, we will develop an “Energy
generation from the northern and western portions of the Highway” system that will bring excess
state, Canada, and New England to more congested areas in fossil-fuel energy from Western New York
the Hudson Valley and the New York City area, while also downstate, and also tap into Upstate’s
supporting the development of new wind, solar, and other potential for renewable energy, like wind
renewable energy projects. The introduction of the initiative power. Just like we built the Northway,
by Governor Cuomo sends a strong message that New York is we will develop an energy expressway
committed to addressing its energy infrastructure needs and down from Quebec. This will preserve
developing its renewable energy resources. Western New York’s current allocation of
low cost hydropower and at the same
On April 11, 2012, the New York Energy Highway Task Force time help address the energy needs of
(“Task Force”) issued a Request for Information (RFI) for Downstate.”
project proposals and received 130 submissions from various
developers, utilities, and other entities. The responses from Governor Andrew M. Cuomo, 2012 State
the Governor’s Request for Information included the of the State Address, January 4, 2012
Synapse Energy Economics, Inc. – Indian Point Replacement Analysis Page 16following:
• New renewable generation projects, totaling 1,600 to 4,200 MW.
• Repowering projects, in the event that existing uneconomic facilities retire, totaling as
much as 2,400 MW.
• New natural gas-fired generation projects, totaling as much as 4,000 MW.
• Nine new DC transmission projects, ranging in capacity from 500 MW to 2,000 MW
each, designed to bring electricity from Canada, the PJM Electricity Market, and upstate
New York to locations in the region around IPEC. Two of these proposals would deliver
electricity directly into New York City.
• Twenty new alternating current (AC) transmission lines, five of which are new lines
while the remainder are upgrades to existing lines. Two of the new projects are
specifically designed to mitigate contingencies and increase line capacity in the event
that IPEC is retired soon.
Implications for the Development of Transmission
Following the release of a transmission needs study in April 2012, a coalition of New York State
transmission owners proposed forming a public-private partnership called NY Transco to
undertake construction of 18 transmission projects that would relieve many current constraints
on the flow of electricity to major load centers. Of the proposed work, three projects are
currently underway or “immediately actionable,” while four others are ranked as “actionable.”
In addition to addressing general congestion issues, a pair of projects is designed specifically to
address reliability in the event of IPEC’s retirement. Other projects in the plan are expected to
integrate greater amounts of wind generation in Jefferson County and in western New York,
with the timing of these projects corresponding to the completion of wind projects in the NYISO
queue (Finlay, 2012). Proposed transmission projects are presented in Figure 1.
The development of new transmission capabilities across the state will have a considerable
effect on the ability to transmit energy from areas of surplus to areas of need. It is also
expected to expand the fuel diversity of generation resources serving the southeastern regions
of the state and improve reliability.
With these transmission investments, the location of energy resources across the state becomes
less important in ensuring that sufficient resources are available to serve major load centers. In
particular, the infrastructure upgrades will reduce New York City and Long Island’s dependence
on local generation and allow the region to benefit from the substantial clean energy generation
resources that exist or are under development in other parts of the state.
Synapse Energy Economics, Inc. – Indian Point Replacement Analysis Page 17Figure 1: Transmission Responses from Energy Highway RFI
Source: http://www.nyenergyhighway.com/rfidocument/transmission/
Implications for the Development of Renewable Resources
Among the projects proposed in response to the Energy Highway RFI are renewable energy
projects totaling between 335 and 1,047 megawatts (MW) beyond what is currently listed in the
Interconnection Queue, and after adjusting for each resource’s UCAP value (the reliability value
of the intermittent renewable resources to the electric system as defined by NYISO). 7
Following a review of the RFI responses and stakeholder input in the fall of 2012, the Task Force
will issue an action plan regarding these proposals. The purpose of the action plan is to provide
an environment that will spur private sector action. The issuance of the RFI illustrates both the
State’s support for renewable energy and the potential resources available to serve New York’s
7
Capacity values are reported in Summer Unforced Capacity MW, or UCAP, which is the net anticipated
useable capacity when outages and other generator operating characteristics are considered. For new
resources with no historical data, NYISO’s default UCAP values are 0.10 for onshore wind, 0.42 for
offshore wind, 0.42 for utility-scale solar PV, and 0.37 for residential and commercial PV. Once
resources are in operation, these values are modified based on historical data, typically resulting in
higher UCAP values. For the purposes of this analysis, however, only NYISO’s default values are used.
Our results are therefore conservative.
Synapse Energy Economics, Inc. – Indian Point Replacement Analysis Page 18electricity demand. In Section 4 we present more information regarding the renewable projects
that were proposed in response to this RFI.
2.2 Current Electricity Resource Needs and Future Uncertainties
The New York Independent System Operator annually prepares ten-year forecasts of future
electricity demand and changes in generation capacity, compiling this data in an annual
publication titled Load and Capacity Data “Gold Book.” In the Gold Book, NYISO reports that,
including IPEC, the total existing resource capability for 2012 is 43,686 MW, while the projected
peak load (including a 16% reserve margin) amounts to 38,456 MW. The difference indicates a
current capacity surplus in New York of more than 5,000 MW.
As shown in Figure 2, the generation capacity in New York is expected to increase over the next
few years. As indicated by the orange bars in Figure ES-1, NYISO currently projects net capacity
additions to the electric system through 2016. The Bayonne Energy Center (500 MW) and the
Marble River Wind Farms (215 MW) are new generators that NYISO assumes are very likely to
reach commercial operation and thus should be assumed operational for planning purposes.
Similarly, upratings at Nine Mile Point 2 (168 MW) and the Munnsville Wind Power site (6 MW)
are also assumed operational for planning purposes. Additionally, the NYISO Gold Book lists a
number of projects in the Interconnection Queue that have achieved substantial milestones in
the approval process. This list includes, for example, the Cricket Valley Energy Center, a 1,136
MW power plant that has recently received several permits and is expected to commence
construction in 2013.
Figure 2: Capacity (including IPEC) with Forecasted Peak Load for 2012 - 2022
45,000
40,000
35,000
30,000
25,000
Proposed Capacity (NYISO Gold Book)
MW
20,000 Existing Capacity
15,000 Forecast Load - High
Forecast Load - Reference
10,000 Forecast Load - Low
5,000
0
2012 2013 2014 2015 2016 2017 2018 2019 2020 2021 2022
Source: NYISO 2012 Gold Book
As shown in Figure 2, NYISO expects the surplus of existing capacity to continue through 2022.
The figure presents the amount of capacity available from existing generators, as well as the
amount of capacity that is expected to be available after accounting for proposed capacity
Synapse Energy Economics, Inc. – Indian Point Replacement Analysis Page 19changes. The proposed capacity changes in the Gold Book include 1,533 MW of capacity
retirements, 2,856 MW of capacity additions (derated), and additional uprates, demand
resources, and distributed generation for a total net addition of 1,776 MW by 2022. The
capacity additions are summarized in Table 1.
Table 1: NYISO Gold Book Proposed Capacity Additions 2012-2022
Derated Capacity by
Generation Type Nameplate Capacity (MW) Summer UCAP (MW)
Wind Turbines 1,272 127
Hydro 11 11
Methane 2 2
Solid Waste 19 19
Combined Cycle 2,198 2,198
Dual Fuel 500 500
Total Proposed Additions 4,002 2,856
Note: Numbers may not add due to rounding
The amount of proposed capacity can be compared to the Reference Case load forecast,
including a 16 percent reserve margin, to get an indication of the extent of capacity excess or
shortfall. As indicated in Figure 2, New York State is expected to have an excess amount of
capacity through 2022, despite load growth.
The NYISO Gold Book provides a useful resource for documenting expected future
developments in New York’s electricity demand and capacity requirements. However, other
factors such as new policy initiatives, transmission availability, future environmental regulations,
and other uncertainties must also be considered. Below we discuss several developments in
these areas and their ability to affect the New York energy landscape over the coming decade.
In addition to proposed capacity changes listed in the Gold Book, NYISO maintains the
Interconnection Queue, an extensive list of electricity resources that have been proposed by
developers but that are in various stages of development and study and are not accounted for
yet by NYISO for planning purposes. The Interconnection Queue currently lists 7,900 MW of
proposed new and uprated summer unforced capacity, of which 2,600 MW are renewable
resources.
The Queue also contains several new transmission facilities that are in the process of being
planned, constructed or completed. These transmission projects will significantly assist the
transmission of power into different regions of the state, including the regions near IPEC. The
projects include (a) a 345 kV transmission line from Bergen, New Jersey to West 49th St in New
York City, with a thermal rating of 660 MW; (b) a 15 MW transformer uprate for an existing 345
kV transmission line from New Jersey to New York City; and (c) a 320 kV direct current (DC)
transmission line from Hydro Quebec to Astoria, New York, with a thermal rating 1,000 MW.
Another indicator of the potential for new generation in New York is the Governor’s Energy
Highway Initiative. Proposals from the Energy Highway contain an additional 335 to 878 MW of
Synapse Energy Economics, Inc. – Indian Point Replacement Analysis Page 20renewable capacity (derated) beyond what is listed in the NYISO Gold Book and larger
Interconnection Queue. 8
Responses to the Energy Highway RFI also include $2.9 billion of proposed new and upgraded
transmission. Of these projects, three projects are listed as being “immediately actionable” and
are designed to mitigate transmission needs that may occur following the retirement of Indian
Point and generators in the New York City metropolitan area. The total estimated cost of this
subset of projects is $385 million, and progress is expected to occur rapidly due to having
already completed detailed engineering evaluations and, in certain cases, having already
received or initiated NYISO and/or New York Public Service Commission approval (New York
Transmission Owners, 2012).
Significant uncertainty also surrounds the possibility of future power plant retirements. As a
result of lower natural gas prices and recent and potentially forthcoming EPA regulations, some
of New York’s coal plants may become uneconomic. Higher coal prices and reduced demand
have already been blamed for AES Eastern Energy LP’s December 2011 bankruptcy filing. At the
time of its bankruptcy filing, AES owned or leased six New York coal-fired power plants
(Pettersson, 2011). Additionally, Dynegy Inc., the operator of the Roseton and Danskammer
power plants in the Town of Newburgh filed for Chapter 11 bankruptcy in 2011, in part due to
low electricity prices and nearly $400 million in projected environmental upgrades that would
be required by 2014 (Levensohn, 2011).
Some EPA regulations have been challenged by industry in court and efforts have also been
made in the House of Representatives to overturn regulations legislatively. While many EPA
regulations have been upheld by the courts, the Cross-State Air Pollution Rule (CSAPR), was
vacated by the United States Court of Appeals for the District of Columbia in August 2012. EPA
and environmental groups (including NRDC) have sought a rehearing of this decision.
Repowering projects are among those proposed in the Interconnection Queue and Energy
Highway RFI, many of which are candidates for replacing current coal-, gas-, and oil-fired power
plants in the event of their retirement. The likelihood of these repowering projects depends to
a large extent on future fuel prices, the timing of proposed EPA regulations, and state legislative
actions.
In sum, a high degree of uncertainty surrounds future capacity and transmission developments
in New York State, in addition to the possibility of IPEC’s retirement. Yet the large surplus of
existing capacity and abundance of new transmission and generation proposals point to the
flexibility of New York’s electric system to meet future electric needs under a variety of
scenarios. In the following section, the ability to meet capacity requirements without IPEC is
explored.
8
The RFI requested a low and high range of proposed capacity additions, with the low estimates
totaling 355 MW and the high estimates totaling 1,047 MW.
Synapse Energy Economics, Inc. – Indian Point Replacement Analysis Page 21You can also read