Distribution Future Energy Scenarios - Network-Level Outlook December 2020 - UK Power Networks ...
←
→
Page content transcription
If your browser does not render page correctly, please read the page content below
Distribution Future Energy Scenarios
Network-Level Outlook
December 2020
UK Power Networks
Distribution Future Energy Scenarios

                                       2
UK Power Networks
                                                                                                                     Distribution Future Energy Scenarios

Executive summary
The United Kingdom’s energy system is undergoing rapid transformation to accommodate the ambitious target of
reaching net zero emissions by 2050. The recently announced Ten Point Plan for a green industrial revolution highlights
the Government’s ambition to reach the net zero target and indicates the rapid changes in policy that will be rolled out
in the coming years. The Government is now expected to publish a range of strategy and policy papers in the near
future to follow up on the ambition of the Ten Point Plan. In March 2020, UK Power Networks published their first set of
distribution future energy scenarios (DFES) outlining three potential futures for energy consumption across UK Power
Networks’ distribution network. Scenarios were created for key drivers of energy demand and distributed generation
and these scenarios were then aggregated into three over-arching “scenario worlds” that each represented a single
cohesive view of a potential future world. In this update of the DFES, we present the view of four different scenario
worlds, with the addition of a fourth, more ambitious scenario world, Leading the Way, that reflects higher ambition and
quicker action from national and local government all the way down to individuals.

The four scenario worlds presented in this report closely align with the narrative presented by National Grid in their 2020
Future Energy Scenarios 1 but are built up by combining bespoke uptake forecasts for individual drivers of demand and
generation within UK Power Networks’ region. Steady Progression is the only scenario that does not reach net zero by
2050 despite continued progress towards decarbonisation. While the remaining three scenario worlds are consistent
with a net zero energy system in 2050 but they achieve decarbonisation via different pathways, especially for heating.

Given this ever increasing ambition to decarbonise, as part of this year’s DFES we undertook a significant programme
of regional stakeholder engagement to discuss our modelling with a range of local stakeholders and to understand how
our scenarios aligned to their own plans and ambitions for their regions.

We also updated all of our scenarios to reflect those changes in the policy environment, technologies, markets and
deployment levels that have occurred since the publication of the March 2020 DFES. For example, we have updated
our uptake scenarios for low emission cars and vans to reflect the ban on new petrol and diesel cars from 2030. Among
other key updates made in this update of the DFES are new scenarios for the uptake of low emission heavy duty vehicles
and a completely new view for decarbonised heating, a hybrid pathway that feeds into the fourth scenario world, Leading
the Way.

The scenarios produced in this work will enable UK Power Networks to more effectively plan for the future, thereby
ensure they deliver a reliable network for their customers in the most cost-effective manner whilst supporting the UK’s
decarbonisation ambitions. It is important to note that while these scenarios span a broad range of possible futures, in
such a rapidly evolving policy and technology environment, we expect that things will continue to change quickly and
we will continue to monitor developments and feed them into our modelling as part of the iterative annual update cycle
for the DFES.

                                   Table 1: Overview of the scenario worlds for the UK Power Networks DFES.

                                                             Steady                      System                       Consumer
                     Parameter                                                                                                            Leading the Way
                                                           Progression               Transformation                 Transformation
               Net-Zero by 2050?                                   No                          Yes                           Yes                Yes
             Low-carbon gas grid?                                  No                          Yes                            No                Yes
       Electric cars and vans in 2030                        2.6 million                  4.5 million                    4.5 million         4 million 2
     Homes with heat pumps in 2030                             320,000                     445,000                        712,000            1,245,000
     Homes with solar panels in 2030                           195,000                     248,000                        397,000             248,000
           Battery capacity in 2030                            1.3 GW                       2.7 GW                         4.8 GW             4.1 GW
    Total renewable generation in 2030                         6.1 GW                       7.2 GW                         8.1 GW             8.6 GW

1
    National Grid ESO, Future Energy Scenarios, July 2020.
2
    Leading the Way has lower electric vehicles due a change in the way people travel, further detail provided in Low-carbon transport.
                                                                                                                                                            3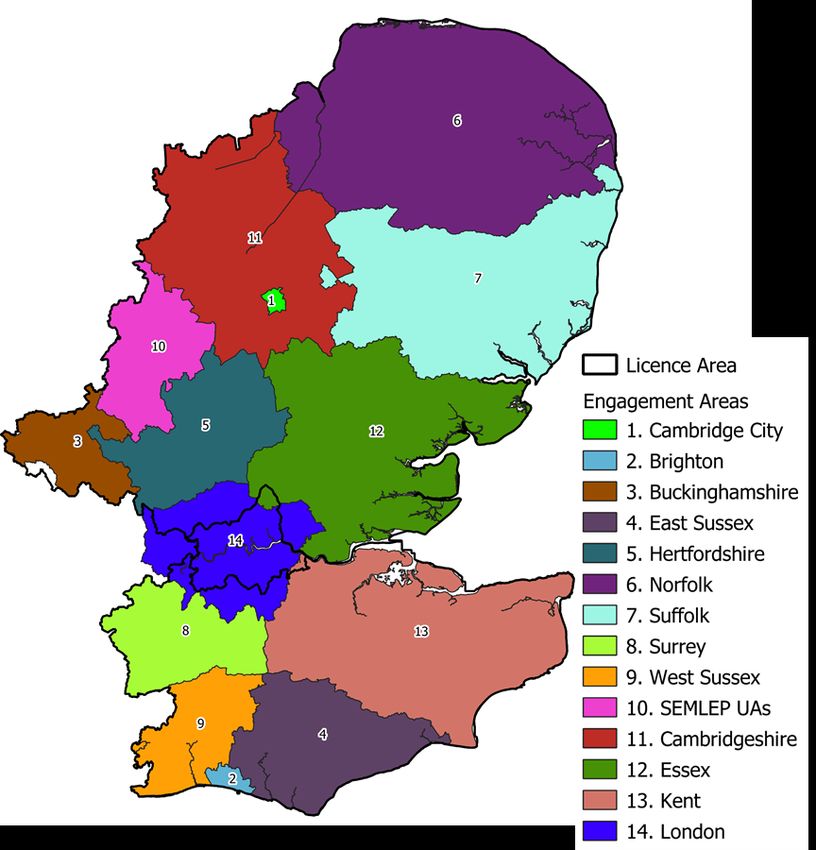
UK Power Networks
Distribution Future Energy Scenarios

                                       4
UK Power Networks
                                                                                                                           Distribution Future Energy Scenarios

Contents

Executive summary ....................................................................................................................................... 3
1      Introduction ............................................................................................................................................ 6
       1.1       UK Power Networks’ licence areas and DFES datasets ............................................................ 6
       1.2       Structure of the report ................................................................................................................. 7
2      Scenario framework............................................................................................................................... 7
       2.1       Scenario world overview ............................................................................................................. 8
       2.2       Building blocks .......................................................................................................................... 11
3      Stakeholder engagement – regional consultation ............................................................................... 12
4      Scenario development ......................................................................................................................... 16
       4.1       Core demand............................................................................................................................. 16
       4.2       Low-carbon transport ................................................................................................................ 24
       4.3       Decarbonised heating ............................................................................................................... 38
       4.4       Distributed generation ............................................................................................................... 50
       4.5       Battery storage .......................................................................................................................... 58
       4.6       Flexibility.................................................................................................................................... 64
5      Conclusions and future work ............................................................................................................... 67
Appendix ..................................................................................................................................................... 68
                 Licence network analysis .......................................................................................................... 68
                 Modelling methods for stock growth ......................................................................................... 80
                 Modelling methods for EV uptake ............................................................................................. 81
                 Calibration of the solar PV model.............................................................................................. 85
                 Demand side response modelling methodology ....................................................................... 85
List of figures and tables ............................................................................................................................. 86

                                                                                                                                                                      5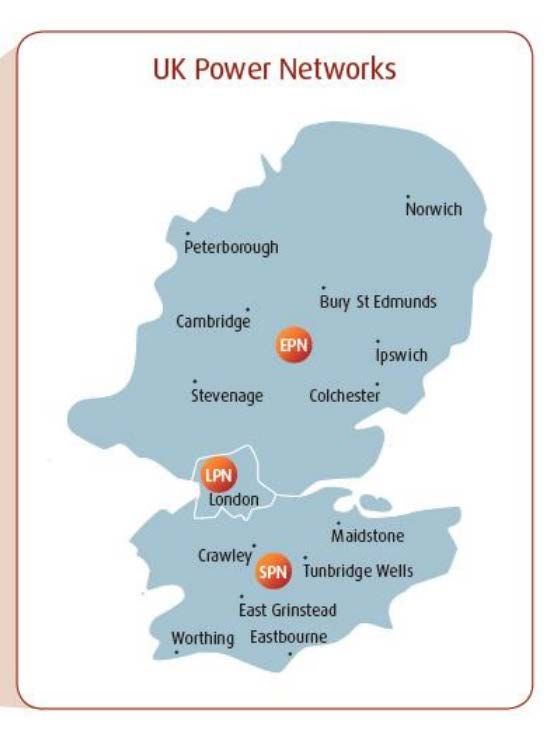
UK Power Networks
                                                                                Distribution Future Energy Scenarios

1 Introduction
1.1 UK Power Networks’ licence areas and DFES datasets
UK Power Networks serves 8.3 million customers; in doing so they provide the electricity network supplying electricity
to the homes and workplaces of 19 million people in the East of England, London and the Southeast. The UK Power
Networks area is broken into three major regions, called licence areas (Figure 1):

    •   Eastern Power Networks (EPN);
    •   London Power Networks (LPN); and
    •   South Eastern Power Networks (SPN)

                                      Figure 1: UK Power Network’s licence areas

While these three licence areas are broadly similar in location to the Government Office Regions of East of England,
London and the Southeast of England, their boundaries differ considerably from those Government Office Regions. We
published many of the scenario datasets at much higher geospatial resolution to allow for stakeholders to consider only
those areas of particular interest to them.

To breakdown the scenarios into these smaller geographical regions we used Office for National Statistics (ONS) areas
called:

    •   Middle Layer Super Output Areas (MSOAs); and
    •   Lower Layer Super Output Areas (LSOAs)

UK Power Networks’ region is made up of about 2,200 MSOAs which in turn are made up of around 11,000 LSOAs.
The average dimensions of MSOAs and LSOAs across England are given in Table 2. Outputs at LSOA resolution,
wherever possible, will published on UK Power Networks’ Open Data portal alongside this report.

                                                                                                                       6
UK Power Networks
                                                                                        Distribution Future Energy Scenarios

                                      Table 2: Average dimensions of MSOA and LSOA across England 3.

                                           Minimum             Maximum            Minimum number        Maximum number
          Geography
                                          population           population          of households         of households

    LSOA                                       1,000              3,000                  400                  1,200
    MSOA                                       5,000             15,000                 2,000                 6,000

1.2 Structure of the report
This report provides an overview of the process of generating UK Power Networks’ Distribution Future Energy Scenarios
(DFES). First, we outline the scenario framework and explain how individual scenarios are brought together to create
four different possible future scenario worlds. Next, we provide a high-level overview of feedback from regional
stakeholders, then we detail how future scenarios were developed for each of the drivers of demand and generation
considered in the DFES. These drivers are considered to have significant impact on energy demand and supply and
include, for example, the number of electric vehicles, uptake of energy efficiency measures and number of solar PV
installations. Finally, we present the key conclusions drawn from this work. The report is structured as follows:

Section 2 outlines scenario narratives for four different future worlds and details how the different future scenarios for
each of the key drivers are combined to produce those scenario worlds.

Section 3 gives an overview of consultations with UK Power Networks’ stakeholders and their expectations for future
technologies deployed in the area.

Section 4 describes how the different Distribution Future Energy Scenarios were developed, including the modelling
methodology and the geospatial disaggregation for the various key drivers modelled.

Section 5 presents the conclusions drawn from this work and outlines how UK Power Networks intends to use these
scenarios within their business going forward.

2 Scenario framework
In this work, we adopted the scenario framework published by National Grid in their latest Future Energy Scenarios 4.
The new framework introduces four potential energy pathways to 2050, three of which reach Net Zero emissions by
2050. These pathways represent different positions on two main axes, speed of decarbonisation and level of societal
change (Figure 2). We developed bespoke scenarios for each driver of demand and generation and constructed four
overarching scenario worlds that align with the narratives of the pathways from National Grid (see Section 2.2). By
developing our own uptake scenarios with local knowledge, we are able to more accurately reflect UK Power Networks’
region, the customers within this region and the current deployment of low-carbon technologies. The four scenario
worlds are structured as follows:

        1. Steady Progression: General progress is made towards decarbonisation; however, this is the only scenario
           world that does not meet net zero by 2050.
        2. System Transformation: The 2050 net zero target is met by relying on hydrogen to decarbonise the more
           difficult sectors of heat and heavy transport.
        3. Consumer Transformation: The 2050 net zero target is met by a high degree of societal change as well as
           deep electrification of transport and heat.

3
    https://www.ons.gov.uk/methodology/geography/ukgeographies/censusgeography
4
    National Grid ESO, Future Energy Scenarios, July 2020
                                                                                                                               7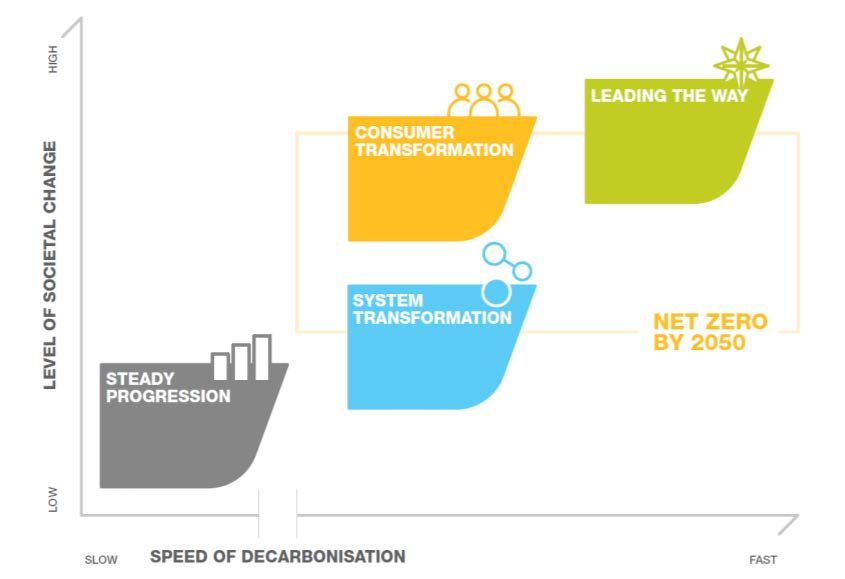
UK Power Networks
                                                                                Distribution Future Energy Scenarios

  4. Leading the Way: This is the fastest of the scenario worlds to achieve net zero, with the highest level of societal
     change utilising both hydrogen and electric low-carbon technologies.

                        Figure 2: Scenario world framework overview (source: National Grid).

2.1 Scenario world overview

  SP      Steady Progression

 The Steady Progression world sees the least amount of societal change and has the slowest speed of
 decarbonisation. Significant progress is made towards net zero, but ultimately the target is not reached by 2050.

 There is widespread uptake of electric vehicles, initially bought by early adopters, but as battery prices fall and
 electric vehicles reach price parity with internal combustion engine (ICE) vehicles, they become the most popular
 choice of domestic vehicle. However, a lack of viable options for Heavy Duty Vehicles (HDV) means that
 decarbonisation of large road vehicles is much slower.

 Natural gas continues to be the primary heating fuel, although there is a degree of success in the roll out of heat
 pumps – especially in new builds where gas and oil boilers are banned from 2025.

 There is a significant increase in the generation capacity of the UK, with increases seen in both small- and large-
 scale solar photovoltaic installations as well as an increase in distributed generation from waste, biomass and
 energy crops. However, despite these increases in renewable energy capacity, a significant increase in the number
 of gas fired turbines is seen as well. There is limited appetite from the public to participate in the energy market
 via smart mechanisms such as demand side response and time of use tariffs.

                                                                                                                        8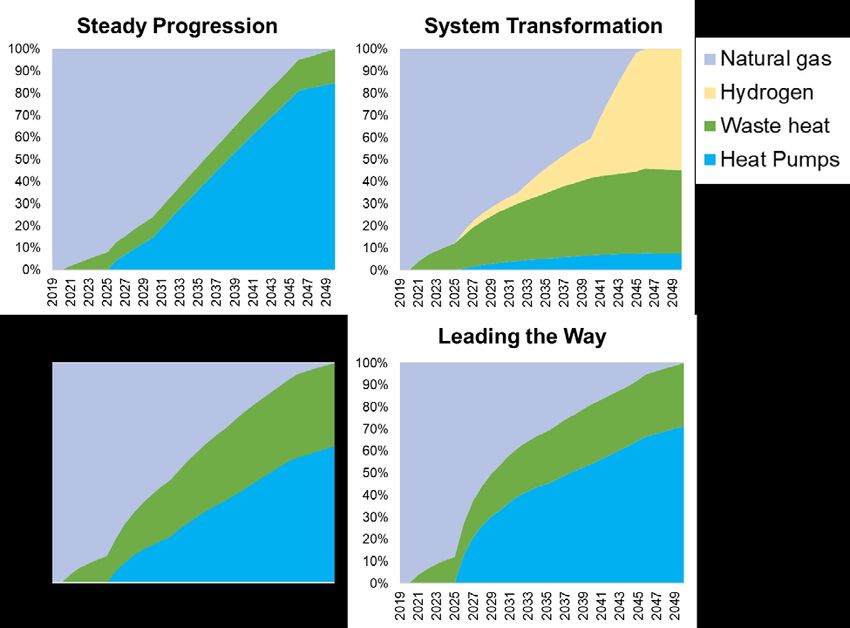
UK Power Networks
                                                                                Distribution Future Energy Scenarios

 ST      System Transformation

In a System Transformation world, the UK reaches its net zero target in 2050 by relying on hydrogen to decarbonise
the more difficult sectors of heat and heavy transport.

With the end of ICE and plug-in hybrid electric vehicles (PHEV) sales in 2030 and 2035, respectively, sales of
electric vehicles, especially cars and vans, continue to ramp up, resulting in a greater demand for rapid and fast
public chargers. Global production of hydrogen fuel cells ramps up, which enables large scale supply of zero
emission HDVs, including buses, coaches and heavy goods vehicles, to be available from mid-2030s.

The Government has chosen to decarbonise heat in existing buildings by repurposing the natural gas grid to
distribute low-carbon hydrogen and installing electric heat pumps in new builds.

Developments of distributed generation, including solar PV and other renewable generation, are steady along with
battery storage in this world. There is also a moderate level of grid flexibility brought by demand side response
and electric vehicle smart charging.

 CT      Consumer Transformation

The Consumer Transformation world sees the UK reach net zero by 2050, thanks to widespread electrification,
decarbonisation of electricity supply and consumers willing to change their behaviour and engage with new, smart
technologies. This scenario sees a great deal of societal change, and many of the decarbonisation efforts are
aided by innovative new revenue streams designed to encourage and reward consumers to adopt new routines.
For example, Time-of-Use Tariffs (ToUT) which offer cheaper electricity to consumers at off-peak times.

This scenario world sees a widespread uptake of electric vehicles, especially cars and vans. The decarbonisation
of larger vehicles is slower, but by the mid 2030’s there is a wide range of zero emission Heavy Duty Vehicles
available, and a nationwide refuelling network completed by 2045.

The Government decides that the electrification of heat is the best way to decarbonise the sector. New build homes
cannot install gas boilers from 2023 onwards, and gas boilers are banned outright by 2035. There is a nationwide
programme of energy efficiency improvements to all buildings, reducing the amount of electricity needed to heat
people’s homes. Various subsidies designed to make heat pumps more affordable are put in place and are kept
in operation until the late 2020’s.

With both heat and transport becoming electrified, there is a requirement for much more electricity in the grid. This
increase in demand is met predominantly through solar and wind installations, which become ever more affordable
as their industries grow. As the amount of renewable generation grows, so does the amount of both grid scale and
domestic battery storage.

                                                                                                                        9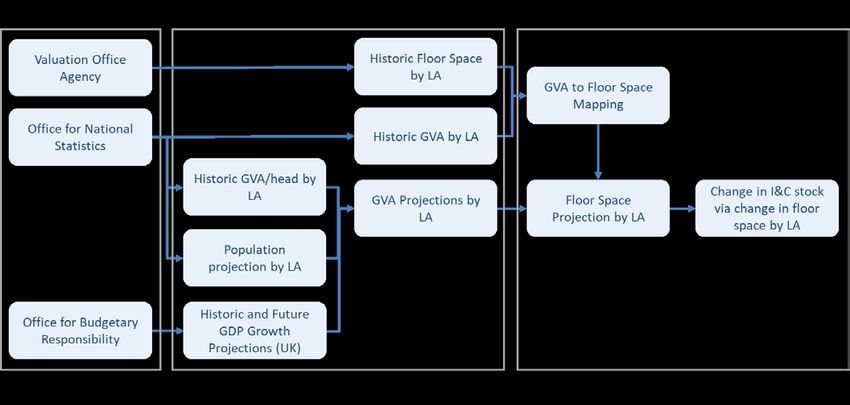
UK Power Networks
                                                                                Distribution Future Energy Scenarios

 LW      Leading the Way

In Leading the Way, the net zero target is reached before 2050 with the highest level of societal change involved.
By utilising state of the art low-carbon technologies, both hydrogen and electric options, this is the fastest of the
scenario worlds to achieve net zero.

All ICE and PHEV vehicle sales are banned from 2030, which boosts the adoption of electric vehicles and
engagement of vehicle-to-grid for network flexibility. At the same time consumers are more willing to take public
transport and opt for active transport such as cycling and walking, resulting in a significant reduction in demand
for passenger cars and a lower growth of van stock relative to other scenarios. For HDVs, both batteries and
hydrogen fuel cells are developed at scale, and diesel ICE vehicles are completely phased out by the 2040s.

The decarbonisation of heat is achieved through a hybrid approach, deploying both high numbers of heat pumps
as well as a gas grid converted to distributing low-carbon hydrogen. This provides a platform for hybrid heat pumps,
combining electric heat pumps with hydrogen boilers.

The electricity generation capacity required to support the many electric vehicles and heat pumps deployed in this
scenario is high and will be met with a more centralised approach than in Consumer Transformation. With large
solar PV being more popular, there will be a high uptake of co-located battery storage. Consumers are willing to
participate in flexibility programmes, with over 40% of those with EV charging at home taking part in some form of
smart charging.

                                                                                                                        10
UK Power Networks
Distribution Future Energy Scenarios
2.2 Building blocks
The four scenario worlds described above are constructed by combining uptake forecasts for all the individual drivers
of demand and generation. To capture a broad range of different possible futures for demand and generation across
UK Power Networks’ region, we produced three to four scenarios for each driver and took a bottom up approach to
modelling that aims to understand the types of customers across the network and thereby reflect the regional differences
that may arise as part of the transition to a low-carbon society. The modelled drivers have been categorised to align
with the Building Blocks agreed between National Grid ESO, UK Power Networks and the other distribution network
operators (DNO) to standardise the modelling outputs between National Grid’s Future Energy Scenarios (NG FES) and
the DFES. Table 3 lists the main drivers modelled and the uptake scenarios makin up each of the four scenario worlds.
Table 3: Drivers of demand and generation and the uptake scenarios that make up each of the four scenario worlds.
System Consumer
Parameter Steady Progression Leading the Way
Transformation Transformation
Net-Zero by 2050? No Yes Yes Yes
Core Demand
Energy efficiency Low Medium High High
Building stock growth Medium Medium Medium Medium
Low-Carbon
Transport
Cars and vans:
Low Medium Medium High
decarbonisation
Heavy duty vehicles:
Baseline Hydrogen world High electricity Fast rollout
decarbonisation
Decarbonised
Heating
Medium electrification Early high
Heating technologies Low electrification High electrification
with conversion to H2 electrification
District heat uptake Low Medium High High
District heat supply Baseline Decarbonised gas High electrification Decentralised
Distributed
Generation
Small-scale solar PV Low Medium High Medium
Large-scale solar PV Low Medium Medium High
Onshore wind Low Medium High High
Renewable engines Low Medium High High
Non-renewable CHP /
High Medium Medium low
Decentralised biomass
Gas engines/
High Low Low Low
Energy from waste
Battery Storage
Domestic battery
Low Medium High Medium
storage
I&C behind-the-meter
Low Medium High Medium
battery storage
Co-located battery
Low Medium Medium High
storage
Flexibility
Flexibility Low Medium High High
11UK Power Networks
Distribution Future Energy Scenarios
3 Stakeholder engagement – regional consultation
During the development of this year’s DFES we consulted a range of local government stakeholders, including councils
and local authorities from within UK Power Networks’ region, to discuss their plans for decarbonisation. Fourteen
sessions were held, each to discuss the DFES for a specific region (Figure 3). We discussed the climate ambition of
each region, their plans for achieving those ambitions and whether they had all the levers to do so. We introduced the
scenario framework discussed in this report and then asked the question of which scenario they thought was most likely
to occur in their region. We then went on a deep dive of four main sectors: low-carbon transport, decarbonised heating,
distributed generation, in particular solar PV, and battery storage.
Decarbonisation ambition
The majority of regional authorities consulted
have declared climate emergencies and put in
place some targets to reach specific climate
ambitions. A recurring theme in the districts
consulted was to focus on decarbonising council
or district owned estates first, and then to
incentivise the whole region to follow. In many
cases, this meant aiming for decarbonisation of
their own operations by 2030 and net zero in the
whole region by 2050. While some regions do
aim for earlier target dates for net zero, they
acknowledged that getting there will likely also
require interventions at a national level. The
regions consulted are working with the levers
that they have in order to reach their climate
goals; however, the widespread opinion was that
they do not have all the levers necessary to
achieve complete decarbonisation at the
regional level and many sectors will require top-
down government intervention.
When asked which scenario world most closely
resembled the path that each region is currently
following or aiming for, most answered that the
solution would likely be a hybrid approach,
picking different decarbonisation pathways for
each of the drivers. Some regions mentioned
that Leading the Way, as a scenario world with a
Figure 3: Map of the regions that each of the stakeholder sessions
variety of different technologies deployed, was represented
the most likely path going forward, although the
speed at which action is taken would be difficult to achieve. Many pointed out that policy is a key driver of which
technologies are deployed and some argued that the way forward will follow decisions from central government, as that
will influence the availability of funding for different approaches.
Low-carbon transport
There was a general consensus that the light vehicle segment will be dominated by battery electric vehicles in the future.
We discussed plans for the decarbonisation of taxis as some district councils either control the licencing of taxis or have
an influence on the actions taken in this regard. In some regions, such as the City of Cambridge, ambitious policies on
the electrification of taxis are already in place. To accommodate the possible speed of decarbonisation in these areas,
12UK Power Networks
Distribution Future Energy Scenarios
we have adjusted our uptake scenario of electric taxis for Leading the Way to match the highest ambition stated.
Although district councils have little control over the decarbonisation of cars and vans owned by the public, most regions
believe that a Steady Progression view of the future can be avoided. Many councils plan to incentivise and encourage
the public by facilitating the roll-out of charging infrastructure. Some urban areas have also implemented low emission
zones or are considering doing so in future, driven primarily by air quality standards; although, this approach is not
universally popular. Therefore, most regions expect a Consumer Transformation/System Transformation view for the
car and van vehicle segments. Some regions (for example Essex and London) have put in place ambitions for reduced
passenger car travel, shifting to more active modes of transport as well as public transport, similar to the narrative
presented in Leading the Way.
More variation was seen in the discussion of buses and other heavy-duty vehicles. While some areas, such as London,
aim to rely on battery electric buses in the future, others place more confidence in hydrogen fuel cell vehicles. Stronger
reliance on hydrogen fuel cell vehicles was often expected in rural areas where the buses will travel longer distances
with less access to recharging infrastructure or in regions that expect high levels of green hydrogen production in the
future, such as Kent. Many of the regions interested in deploying hydrogen in the transport sector do not disregard
battery electric heavy-duty vehicles, however, and expect that the solution may contain a mixture of both technologies,
depending on suitability. This closely aligns to the narrative and uptake scenarios for both System Transformation and
Leading the Way. Other regions aim to focus on introducing electric vehicles wherever they can and only deploy
hydrogen in the most difficult to decarbonise cases, which matches the narrative of Consumer Transformation.
Decarbonised heating
Stakeholders generally agreed that decarbonising heating is one of the biggest challenges to reaching net zero. They
argued that consumer-led changes in heating technologies are difficult to foresee while the economics of gas boilers
remain better than for heat pumps. Some district councils have struggled to make the business case for heat pumps for
their own properties stack up and emphasise that this is an area that will need top-down government intervention, such
as the Future Homes Standard. Stakeholders agreed with our modelling assumption that new builds will likely be
impacted by policy first. When asked which heating technology they believed new builds will adopt if a policy banning
fossil fuel heating is put in place, many mentioned heat pumps as the predominant technology. However, others believed
that as energy efficiency standards in new homes increase and thermal demand drops, some developers will install
electric resistive heating as it is cheaper than a heat pump. While the output of our modelling suggests that the majority
of new builds will run on heat pumps, we do also consider electric resistive heating in new builds and see some uptake
in both domestic buildings as well as industrial and commercial buildings, particularly in Steady Progression where the
overall heat pump deployment is low.
When it comes to the decarbonisation of the existing building stock, the stakeholders were not as confident. We
presented to stakeholders our modelling assumptions that off-gas properties would follow the new builds, predominantly
converting to heat pumps, with some properties on biomass. Stakeholders generally felt that these assumptions were
reasonable, and some have already constructed plans to tackle off-gas properties first, before a decision on the on-gas
properties is made. We then presented different options for on-gas properties depending on scenario, the main question
being whether the stakeholders expected a mass rollout of heat pumps, consistent with Consumer Transformation, or
a conversion of the gas grid to distribute low-carbon hydrogen, as we model in System Transformation. Several barriers
to the mass rollout of heat pumps were mentioned – lack of long-term funding, grid capacity issues, and level of energy
efficiency measures needed beforehand were among the most common ones. In urban areas, space constraints were
identified as an issue, both lack of space for the heat pumps themselves as well as difficulties to implement energy
efficiency measures such as wall insulation. In rural areas, energy efficiency requirements were highlighted as a
potential barrier for heat pumps, as large, poorly insulated properties would often require substantial measures to be
suitable for a heat pump. Customer perception was also noted to be an important factor and that if consumers prefer
gas boilers over heat pumps, mass rollout will prove difficult. Additionally, few regions were ready to commit to hydrogen
for heating as the technology is still in its infancy. Lack of trial data to gain confidence and understanding of the
technology as well as safety concerns were among the barriers mentioned for the rollout of hydrogen boilers.
A recurring theme throughout the discussion was that these changes would have to follow central government decisions
and building regulations. Some regions noted that the pace of development of centralised standards could prove to be
13UK Power Networks
Distribution Future Energy Scenarios
a barrier for local authorities that would like to move more quickly (for example Brighton), and others expressed a
reluctance to put in place local policy that might end up being contested (such as Surrey).
It is clear that decarbonised heating is an area where there is still much uncertainty. The regions we consulted have not
yet settled on a technology pathway and are looking at a range of possible future heating technologies. Some regions
plan to start with the rollout of energy efficiency measures to reduce energy consumption for heating as well as prepare
the building stock for a transition to heat pumps, should that path be decided. Some regions, such as Suffolk and
Cambridge, are looking at measures such as the Green Homes Grant to help facilitate this transition.
We also discussed the possibilities for district heat networks with the stakeholders and found that in general, they agreed
with our assumptions that heat networks will mainly be deployed in areas of high heat demand density or in concentrated
new build development sites. While many regions are looking into options for district heating, stakeholders identified a
number of challenges to district heating deployment. Customer perception was again identified as an important factor,
particularly concerning reluctance of individuals to becoming locked-in to a single heat source and supplier. Building
retrofits and infrastructure required was another main challenge mentioned. Some urban areas, particularly London, did
expect a considerable growth in district heat networks over the coming years, particularly in new builds, consistent with
our modelling of the Consumer Transformation and Leading the Way scenario worlds. There was some interest in district
heat networks for off-gas villages, but the practicality of such networks was debated across different regions.
Distributed generation
There was a general agreement that solar PV is a key technology and, in most regions, considered likely to be the
predominant distributed generation technology going forward. However, it depended on the region whether the focus
was on smaller roof-top installations or larger ground-mounted solar farms. Stakeholders from urban areas highlighted
that they have little free space available and are therefore less suited for large scale projects and primarily expected
growth in small-scale roof-top installations. We demonstrated to stakeholders that our modelling considered suitability
for large scale-generation and that in urban areas, we focussed on roof-top installations. Some stakeholders expected
growth in general to be more in large-scale solar installations and argued that better incentives were needed to drive
the uptake of domestic solar PV installations. This view aligns with that of Leading the Way, where generation is met
with a more centralised approach and we expect more large-scale projects. While stakeholders generally agreed that
balancing own energy consumption is the main driver for domestic solar PV at the moment, rather than incentives such
as the Smart Export Guarantee, not all of them view that as a barrier for uptake. Councils participating in Solar Together,
a collective purchasing scheme for domestic solar PV and battery storage, see that as a potential driver as well. Kent,
Suffolk and Sussex have already seen a high number of applications through Solar Together this year. Stakeholders
from Cambridgeshire had some experience with the scheme as they ran it last year, which prompted 1500 registrations
and resulted in a few hundred actual installations. In other areas, stakeholders expected rapid growth in both small-
scale and large-scale installations. Many of the regional councils consulted have plans in place to deploy solar PV on
their own estates, such as on top of council housing or school buildings, on old landfill sites, in county farm estates or
at park and rides. Some councils have also used or are working on power purchase agreements (PPA) for either roof-
top or ground mounted solar.
Battery storage
Most stakeholders highlighted that battery storage deployment is still at early stages and many have not considered the
technology in detail. The business cases being considered include batteries co-located with large-scale solar PV,
standalone grid-connected batteries and batteries at electric vehicle charging hubs/depots or park and rides, possibly
co-located with solar PV canopy installations. Stakeholders expect little growth in domestic batteries in the near term
and agreed that the business case for I&C behind-the-meter batteries is challenging at the moment. Others found
challenges to the business case for both behind-the-meter and large-scale batteries and some are simply waiting on
better options to come to the market to get the business case to stack up.
Summary
Our extensive programme of regional stakeholder engagement captured a broad range of views that generally provided
support for our modelling assumptions within the DFES. Feedback included examples of actual programmes that
14UK Power Networks
Distribution Future Energy Scenarios
regional authorities are working on to help facilitate the transition to net zero, that will be key to delivering the scenarios
in reality. Where opinions most notably differed was on the most likely overall decarbonisation pathway that their regions
might follow, some regions saw a strong role for low-carbon hydrogen, whereas some saw electrification as the more
likely option. These differing views were also found at a sector level e.g. electric versus hydrogen transport. Although
stakeholder views on the most likely pathway varied, all acknowledged the high degree of uncertainty that exists and
many highlighted that a hybrid pathway was, in fact, the most likely. While regions varied in the level of development
and extent of their decarbonisation plans, many have aspirations to deliver action plans in the near term. Element Energy
is working with UK Power Networks to plan for how those decarbonisation plans are reflected in future iterations of the
DFES as once adopted they could drive rapid deployment of low-carbon technologies in specific regions, particularly if
supported by national policy.
Additionally, many stakeholders expressed a clear desire to work more closely with UK Power Networks going forward.
These stakeholders want to continue to share their action plans as they are updated to make sure UK Power Networks,
as a DNO, is aware of upcoming transitions, especially if an electrification route is selected. Among the barriers to
decarbonisation via electrification mentioned throughout the stakeholder sessions were network charges and difficulty
of connecting to the electricity distribution grid. Therefore, both stakeholders and UK Power Networks expressed an
interest in continued collaboration to ensure that the necessary infrastructure will be in place to support the
decarbonisation ambition. Some regions are also interested in using the outputs of the DFES to help inform their climate
action plans and others, that have done their own modelling, are interested in seeing how they compare to the DFES.
In general, stakeholders expressed interest in continued collaboration and establishing communication channels to
share information in both directions, with a common goal to facilitate the transition to net zero.
15UK Power Networks
Distribution Future Energy Scenarios
4 Scenario development
4.1 Core demand
The majority of current electricity demand in UK Power Networks’ region can be attributed to the demand from either
domestic or industrial and commercial (I&C) customers. For the purposes of this report, we define the ‘core demand’
from these sectors as the electricity demand related to all existing appliances and cooling. Electric heating, including
the demand associated with low-carbon heating technologies such as heat pumps, is excluded from core demand and
discussed separately in this report (see Section 4.3). Future core demand for these two sectors is primarily controlled
by two key variables:
1. The total number of customers connected to the network – assumed to be controlled by the size of the building
stock (building and demolition); and
2. The energy intensity of the customers within those properties (energy efficiency and appliance uptake).
In this section we outline the modelling for each of the aspects of core demand outlined above, how they may change
in future and how our scenarios have changed since the publication of the March 2020 DFES. One key difference from
the March 2020 DFES is the new scenario framework. Table 4 shows how the uptake scenarios that we have generated
for the drivers of core demand maps to the new scenario world framework.
Table 4: Scenario world mapping for main drivers of core electricity demand
System Consumer
Parameter Steady Progression Leading the Way
Transformation Transformation
Building stock growth
Medium Medium Medium Medium
(domestic and I&C)
Electrical energy
Low Medium High High
efficiency
Air conditioning High Medium Medium Low
4.1.1 Building stock
We modelled the number of domestic properties and I&C premises connected to the distribution network as the net
result of two competing factors – demolition of the existing stock and the rate of new build completions in each sector.
Domestic building stock
Within the domestic sector there has been a recent trend of strong growth in the housing stock; however, the nature
and location of these new builds is not uniform throughout the regions served by UK Power Networks. We used
household growth projections for each local authority (LA) from the Office for National Statistics (ONS) 5 to define the
medium stock growth scenarios for the domestic building stock. Refer to Appendix A for more information on the
modelling.
We used the low and high population growth projections from ONS to produce scaling factors relative to their central
projection to produce low and high household stock growth projections for each local authority. As a result, we now
obtain three projections for the number of new build dwellings present in each local authority for each future year out to
5
Office for National Statistic, (ONS), Household projections for England: 2018-based, May 2019
16UK Power Networks
Distribution Future Energy Scenarios
2050 (Figure 4). We model a range from 8.5 million to 10 million domestic households in UK Power Networks’ region in
2050, compared to the current stock of 7.9 million. In our scenario framework, we choose the medium growth rate, the
scenario that best aligns with historic trends, and assume an 18% growth in domestic households by 2050, or a total
9.3 million households in 2050. While the scenario worlds represent a different view of future deployment of various
technologies, in line with their different speed of decarbonisation and level of societal change, they do not vary in
assumptions on population and household growth.
10.5
Low
Number of domestic households
10 Medium
High
9.5
(millions)
9
8.5
8
7.5
7
2019
2020
2021
2022
2023
2024
2025
2026
2027
2028
2029
2030
2031
2032
2033
2034
2035
2036
2037
2038
2039
2040
2041
2042
2043
2044
2045
2046
2047
2048
2049
2050
Figure 4: Domestic household growth scenarios for UK Power Networks' region.
UK Power Networks serves a region that includes areas that are expected to see significant growth in the number of
domestic homes over the next 30 years. The local authority specific housing forecasts that we use to model domestic
connections reflect the fact that certain areas are expected to see much more significant growth in the housing stock.
This growth, however, is not expected to be uniformly distributed within those local authorities. A significant fraction of
this growth is likely to occur in new housing development growth sites, with the remainder likely to be more evenly
distributed. To identify where these concentrated new build developments are expected, we used UK Power Networks’
analysis of local authority growth plans where available. These plans identify specific areas where local authorities are
planning for significant residential developments within their region, as well as an expected number of new homes in
those areas. We mapped the areas identified to their corresponding Lower Layer Super Output Areas (LSOAs) and,
based upon the projected size of the development, allocated the corresponding fraction of new builds from the local
authority totals to those areas. The remaining projected new build properties from the local authority level projection
were then allocated across the remaining LSOAs within the local authority. By combining these LSOA level projections
for new build homes with the existing building stock adjusted for expected demolition we were able to produce scenarios
for total domestic property numbers broken down by LSOA out to 2050.
Industrial and Commercial Building Stock
For the I&C sector, we consider floorspace as the starting point rather than customer connections, as floorspace is a
key metric for determining energy consumption. The total I&C floorspace across UK Power Networks’ region has
exhibited only very mild growth in recent years. In order to project future growth, we have determined the historic
17UK Power Networks
Distribution Future Energy Scenarios
relationship between floorspace and Gross Value Added (GVA) at LA resolution (Figure 45 in Appendix A) and then
used ONS and Office for Budgetary Responsibility (OBR) sources to generate local authority GVA projections that can
be converted to local authority floorspace projections on the basis of the historic floorspace to GVA relationship.
We used GDP projections to generate the GVA projections by LA. Due to Covid-19, a significant drop in the national
GDP is expected this year 6, followed by a ‘bounce-back’ or high GDP growth in the following year/years, eventually
recovering to pre-Covid-19 levels. 7 At the time of modelling the extent of these expected fluctuations is highly uncertain,
but the lockdown in response to the pandemic could have a long-lasting impact on the economy. We analysed the
relationship between floorspace and GDP in time of economic crisis by looking at historic data for the 2008 financial
crash and found that I&C floorspace does not directly follow GDP fluctuations. While we might not expect floorspace to
decrease if GDP drops, or at least for any change in floorspace to lag behind changes in GDP, it is reasonable to expect
some delay in I&C growth. Therefore, we modify the GDP projections from OBR by lowering the GDP growth in the next
few years to account for the impact of the virus.
Additionally, we enhanced our modelling approach by refining floorspace growth rates in regions of high economic
growth but where there is limited space available for expansion (other than upwards growth), such as central London.
We used local authority-specific historic floorspace data to inform realistic constraints on future floorspace growth in
these regions.
Summing the floorspace projections for all local authorities in UK Power Networks’ region results in the I&C floorspace
trends in Figure 5. The total UK Power Networks I&C floorspace increases to between 103% and 121% of 2019 values
by 2050 across the three scenarios. This is slightly lower than our projections of between 107% and 124% in the March
2020 DFES, which is a result of the modelling of Covid-19 impacts on near term growth rates on the overall floorspace
growth in the long term. While we model three scenarios to represent a range of possible futures, only the medium
projection is used in our scenario framework.
125%
Low
120% Medium
Total I&C floorspace extent
High
115%
relative to 2019
110%
105%
100%
95%
90%
2019
2020
2021
2022
2023
2024
2025
2026
2027
2028
2029
2030
2031
2032
2033
2034
2035
2036
2037
2038
2039
2040
2041
2042
2043
2044
2045
2046
2047
2048
2049
2050
Figure 5: Total Industrial & Commercial (I&C) floorspace growth in UK Power Networks’ region relative to 2019
6
OBR estimates. Available from: https://obr.uk/coronavirus-analysis/
7
Resolution Foundation, Doing more of what it takes, April 2020. Available from: https://www.resolutionfoundation.org/app/uploads/2020/04/Doing-more-of-what-it-
takes.pdf
18UK Power Networks
Distribution Future Energy Scenarios
The floorspace projections in Figure 5 were further broken down into premises type-specific projections. This distinction
is important because within UK Power Networks’ region there have been notably different historic trends in floorspace
for different premises types; for example, there has been a steady increase in retail and office space at the expense of
industrial premises. Furthermore, these different business types have notably different energy consumptions per area
of floorspace. It has been essential therefore to establish floorspace projections for each premises type to enable
accurate electricity load forecasting. We derived regionally specific trends by premises type and applied these
relationships to the local authority-specific total I&C floorspace projections.
We then mapped these growth trends to high geospatial resolution using a detailed understanding of the existing
customer split, established from high resolution proprietary business data purchased from Experian. This data allowed
us to map the UK Power Networks non-domestic customer counts to specific business archetypes at LSOA resolution.
The growth trend for each business type determined at LA level was then applied to produce archetype-specific growth
projections at LSOA resolution.
4.1.2 Electrical energy efficiency
Domestic appliances
Based on work initially done for the Low Carbon London project 8, we modelled energy efficiency scenarios for major
domestic appliances. We categorised household appliances into “wet”, “cold”, and “other” and created three scenarios
of efficiency gain that all meet the EU minimum energy performance standards 9. For Leading the Way, we model a high
degree of efficiency gain, equivalent to a complete stock turnover to the best available technology, that is appliances
with the highest energy efficiency rating available, for example A+++ for washing machines. On the other hand, we
model low efficiency gains in Steady Progression, with a stock in 2050 that is predominantly made up of the two lowest
energy efficiency ratings (A+ and A++ for washing machines). We expect the highest efficiency gains in the Cold
appliances, followed by Wet, and minimal gains in Other. Coupled with this, we also modelled the uptake of specific
household appliances from the growing trends in both population and percent appliance ownership across the
population. Table 5 summarises the types of appliances modelled and the projected range of efficiency gains by 2050
from Steady Progression to Leading the Way. Figure 6 and Figure 7 depict the projected overall relative demand for
two example appliances (fridge/freezers and washing machines respectively) when both the increase in ownership and
efficiency gains are accounted for. It is important to note that in most cases the net demand by 2050 increases; however,
depending on the scenario, the near-term demand may decrease due to early gains in efficiency.
Table 5: Summary of domestic appliance type and efficiency gains by 2050, relative to 2019.
Modelled efficiency gain by 2050,
Appliance type Examples of appliances modelled
relative to 2019
Cold Refrigerator, freezer 13% - 25%
Wet Dishwasher, washing machine, tumble dryer 11% - 13%
Other Television 0% - 3%
8
Low carbon London, UK Power Networks Innovation project, 2010-2014.
9
We assume that Brexit will not impact the appliance supply chain in such a way that these minimum efficiency standards will not be met.
19UK Power Networks
Distribution Future Energy Scenarios
I&C baseload
We estimated the technical potential for non-thermal electrical energy efficiency in the I&C sector from BEIS’s Building
Energy Efficiency Survey (BEES) 10. We considered electrical efficiency measures for demand drivers such as air
conditioning and cooling, lighting, and ventilation. After breaking down the available energy efficiency measures by cost-
effectiveness and acceptable payback periods, we then attributed them to different energy efficiency packages
accordingly.
We developed three energy efficiency scenarios based on cost-effectiveness and payback periods of measures applied,
130% 130%
Steady Progression Steady Progression
125% 125%
Required energy demand
Required energy demand
System Transformation System Transformation
120% 120%
Consumer Transformation Consumer Transformation
relative to 2019
relative to 2019
115% 115%
110% Leading the Way 110% Leading the Way
105% 105%
100% 100%
95% 95%
90% 90%
85% 85%
80% 80%
2019
2021
2023
2025
2027
2029
2031
2033
2035
2037
2039
2041
2043
2045
2047
2049
2019
2021
2023
2025
2027
2029
2031
2033
2035
2037
2039
2041
2043
2045
2047
2049
Figure 6: Relative energy demand for all fridge/freezers in UK Figure 7: Relative energy demand for all washing machines in
Power Networks' region, accounting for increasing ownership UK Power Networks’ region, accounting for increasing
and efficiency gains. ownership and efficiency gains.
measured in £/tCO2 abated and years, respectively. The cost-effectiveness and payback period bands selected, and
description of the scenarios are shown in Table 3, and the resulting deployment scenarios for the “Offices” sector is
shown in Figure 8 as an example.
Table 6: Electrical efficiency scenario definitions based on cost-effectiveness and acceptable payback period.
Payback
Cost effectiveness
Scenario Scenario world period Description
range (£/tCO2 abated)
(years)
Low cost and short payback
Low Steady ProgressionUK Power Networks
Distribution Future Energy Scenarios
100%
Required electrical energy
95%
relative to 2019
90%
85%
Steady Progression
80%
System Transformation
75% Consumer Transformation
Leading the Way
70%
2019
2021
2023
2025
2027
2029
2031
2033
2035
2037
2039
2041
2043
2045
2047
2049
Figure 8: Electrical energy efficiency rollout scenarios in the "Offices" sector.
Air-conditioning
Due to climate change, hot summers are expected to become more common in the UK. 11 If coupled to increases in
economic wealth, there is the potential for these hotter summers to drive the uptake of air conditioning (AC) units in both
the domestic and I&C building stock. We modelled the uptake of air conditioning units in the domestic and I&C sectors
separately.
The AC uptake forecasting methodology we used is consistent with that published in the March 2020 DFES and is based
on work by the Tyndall Centre for Climate Change Research at the University of Manchester 12.
Domestic sector
Domestic air conditioning in England is relatively uncommon and there is limited data available to describe the current
number of AC units, or their geographical distribution. We developed three uptake scenarios in the March 2020 DFES
based on analysis of a number of different sources, including historic uptake trends from countries that have already
seen a higher uptake of domestic AC units. 13 In the absence of any changes in the availability of data for the current
deployment of AC or to the drivers for uptake, the scenarios remain consistent with those developed in the previous
DFES; however, these scenarios have now been mapped onto the new scenario worlds.
These scenarios for domestic AC uptake were defined as follows:
- Low: Growth according to extrapolated historical growth observed in the UK 14.
- Medium: Deployment defined according to the historical trend observed in Australia 15.
11
‘UK Climate Projections: Headline Findings’, Met Office, 2019
12
‘Air conditioning demand assessment’, A. McLachlan, S. Glynn, F. Hill, R. Edwards, J. Kuriakose and R. Wood, 2016.
13
For more detail on the methodology, refer to: UK Power Networks and Element Energy, Distribution Future Energy Scenarios: Network-Level Outlook. Available from:
https://innovation.ukpowernetworks.co.uk/wp-content/uploads/2020/03/UKPN_Distribution_Future_Energy_Scenarios_10_March_2020.pdf
14
Euromonitor International 2016, Consumer Appliances in the United Kingdom.
15
Australian Bureau of Statistics, 2014, Energy Use and Conservation.
21UK Power Networks
Distribution Future Energy Scenarios
- High: Deployment defined by observed growth in the US 16, with the addition of heatwave effects (increased
uptake during rare weather events) 17.
Figure 9 shows the resulting uptake scenarios and how they fit into our scenario framework. In Leading the Way, the
public is very aware of the importance of mitigating climate change and are willing to change their behaviour in order
to reach net zero earlier. This includes limiting their energy use and avoid investing in unnecessary energy-intensive
gadgets, resulting in a low uptake of AC units. This is not the case in Steady Progression where society is not as
engaged in tackling climate change and a greater frequency of extreme weather events like heat waves cause an
increase in the uptake of AC units.
20% Steady Progression
customers that have air
Proportion of domestic
System Transformation
15% Consumer Transformation
conditioning
Leading the Way
10%
5%
0%
2019
2021
2023
2025
2027
2029
2031
2033
2035
2037
2039
2041
2043
2045
2047
Figure 9: Air conditioning uptake in the domestic building stock within UK Power Networks' region.
2049
I&C sector
The modelling of the industrial and commercial (I&C) sector AC demand is based on a set of archetypes, which already
considers a certain amount of cooling. By default, certain building types (e.g. offices, retail) already cool certain fractions
of their floorspace. As such, this existing cooling demand is part of the core electricity demand of the I&C sector. The
scenario approach developed in the March 2020 DFES therefore reflects the assumption that current I&C floorspace is
equipped with AC to a certain degree. As the I&C sector grows (more floorspace), there will be growth in this traditional
cooling requirement. Our AC scenarios reflect that there will be a certain amount of additional I&C AC uptake, as warmer
temperatures will mean that a higher fraction of the floorspace needs to be cooled. As such, the AC forecast represents
“additional air-conditioning” for the I&C sector. Similarly to the domestic AC uptake, we assume that the scenario
definitions hold as we identified no strong grounds for changing our assumptions.
The scenarios for additional I&C AC uptake were defined as follows:
- Low: Extrapolates trend forecast by Carbon Trust 18;
- Medium: As for low, but with effect of increased purchase decisions during heatwaves included; and
- High: Aggressive growth scenario where penetration of air conditioning reaches 80% by 2050. The vast
majority of suitable I&C floor space will be cooled.
The resultant uptake scenarios and how they map to scenarios in our scenario framework are displayed in Figure 10.
16
U.S. Department of Energy, Energy Information Administration, 2001 Residential Energy Consumption Survey.
17
‘Economics of Climate Resilience Buildings and Infrastructure Theme: Overheating in Residential Housing – Annexes’, A. Day, Frontier Economics, 2013.
18
‘Air Conditioning, Maximising comfort, minimising energy consumption’, The Carbon Trust, 2012.
22You can also read