Strength in Numbers A Ten-Year Trend Analysis of Women's Shelters in Alberta - Alberta Council of Women's Shelters
←
→
Page content transcription
If your browser does not render page correctly, please read the page content below

Strength in Numbers
     A Ten-Year Trend Analysis
  of Women’s Shelters in Alberta
INTRODUCTION AND ACKNOWLEDGEMENTS
On behalf of Alberta Council of Women’s Shelters (ACWS)
For as long as there have been women’s shelters, there has been a need to demonstrate their
life-saving impact to government and community. Women’s shelters believe strongly in their
accountability to the women and children they serve as well as to their funders and donors.
This report, Strength in Numbers: A Ten-Year Trend Analysis of Women’s Shelters in Alberta,
is a testament to both the professionalism and leadership shown by Alberta women’s shelter
staff. Together, they transformed data collection from paper and pencil— and those yellow,
green, blue and peach government forms— to an online database.

This transformation began in 2001 when three Calgary shelters signed on with the Canadian
Outcomes Research Institute (CORI) to use the Hull Outcome Monitoring and Evaluation
System (HOMES). CORI offered a vision of using data and outcomes to inform practice in a
continuous improvement loop both on an individual agency and sector wide basis. This vision
resonated with the Alberta Council of Women’s Shelters (ACWS), and in 2002 ACWS started
to bring the majority of its member shelters on board. To facilitate data gathering and input,
ACWS sought funding from the Muttart Foundation for computers for the shelters and from
the National Crime Prevention Centre to implement the database. ACWS also negotiated a
tripartite information sharing agreement between the shelters, ACWS and Alberta Children
and Youth Services. The agreement was ground-breaking in that ACWS would for the first time
play a contributing role in the design of the database and data collection process and have
access to its members’ aggregate data.

This report, based on ten years of aggregated data collected by Alberta shelters, large and
small, investigates what this data shows us about the women and children we serve and
about changes in both the shelter populations and shelter practices and services. It is first
and foremost a testament to women’s courage. It also attests to shelters’ domestic violence
expertise and their willingness and commitment to do whatever it takes to improve services
for women and their children. This commitment includes developing expertise in utilizing
data to inform practice and advocacy, most often without the funding required to support and
sustain such initiatives.

ACWS wishes to express their thanks and profound gratitude to shelter directors, their boards
and the many front-line and administrative staff who contributed to this innovative project,
and most importantly to the women whose experiences are reflected here. We are reminded
that although Alberta’s shelters are diverse in many ways— in location, in the demographic
characteristics of the women and children they serve, and in the services they offer— shelters
share a common dedication to providing women and children fleeing domestic violence with
safe and caring environments. Their commitment to a supportive and collaborative climate
makes studies such as this one, which is unique in Canada, possible. We also wish to thank
the funder, Prairieaction Foundation, as well as individual donors, whose support contributed
to making this study possible.

ACWS THANKS...
The results of this ten-year analysis creates a strong foundation for using our strength in   The directors and staff of member organizations that gathered the information discussed in
numbers to make a difference for women, children, seniors and shelters.                       this report. Those organizations are:

ACWS looks forward to working with our members to use this report to develop                  Northwest Alberta
recommendations and leverage our collective knowledge to improve services for women and       • Fairview & District Women’s Centre Association
children.                                                                                     • Grande Prairie Women’s Residence Association
                                                                                              • Northwest Alberta Resource Society
                                                                                              • Peace River Regional Women’s Shelter Society
                                                                                              • Sucker Creek Emergency Women’s Shelter
                                                                                              • Wellspring Family Resource & Crisis Centre Society

                                                                                              Northeast Alberta
                                                                                              • Bigstone Cree Nation Women’s Emergency Shelter Society
                                                                                              • Dr. Margaret Savage Crisis Centre Society
                                                                                              • Fort McMurray Family Crisis Society
                                                                                              • Hope Haven Society
                                                                                              • Mikisew Cree First Nation
                                                                                              • Northern Haven Support Society
                                                                                              • St. Paul & District Crisis Association

                                                                                              Central Alberta
                                                                                              • Camrose Women’s Shelter Society
                                                                                              • Central Alberta Women’s Emergency Shelter Society
                                                                                              • Ermineskin Women’s Shelter Society
                                                                                              • Mountain Rose Women’s Shelter Association
                                                                                              • Lloydminster Interval Home Society Inc.
                                                                                              • Yellowhead Emergency Shelter for Women Society

                                                                                              Central Alberta - Edmonton and Area
                                                                                              • Edmonton Women’s Shelter Ltd.
                                                                                              • Catholic Social Services
                                                                                              • Lurana Shelter Society
                                                                                              • Seniors Association of Greater Edmonton (SAGE)
                                                                                              • Strathcona Shelter Society
                                                                                              • Wings of Providence Society
Financial assistance was provided by the Community Action, Research and Education Grants
                      Program (CARE) of the Prairieaction Foundation.
ACWS THANKS... Table of Contents
Alberta South
Section I. Executive Summary 1
• Brooks and District Women’s Safe Shelter Society
• Community Crisis Society 1.1 Shelter Admissions.................................................................................. 1
• Stoney Tribal Administration 1.2 Capacity Issues........................................................................................ 2
• Medicine Hat Women’s Shelter Society 1.3 Rural Service Delivery Context................................................................ 2
• Pincher Creek Women’s Emergency Shelter Association 1.4 Length of Stay in Shelters........................................................................ 3
Strength in Numbers: A Ten-Year Trend Analysis of Women’s Shelters in Alberta
• Region 3 Family Based Care Society 1.5 Increasing Client Complexity................................................................... 3
• Safe Haven Women’s Shelter Society
1.6 Aboriginal Women in Shelters................................................................. 3
• YWCA of Banff
• YWCA Lethbridge and District 1.7 Rising Rates of Unemployment............................................................... 4
1.8 Services Provided.................................................................................... 4
Alberta South - Calgary 1.9 Need for Increased and Specialized Children’s Programming................. 4
• Awo Taan Healing Lodge Society 1.10 Police Involvement................................................................................ 5
• Calgary Women’s Emergency Shelter Association
Section II. Background and Project Purpose 7
• Discovery House Family Violence Prevention Society
• Kerby Centre 2.1 Alberta Shelters..................................................................................... 8
• Sonshine Community Services 2.2 Description of the Data in this Report................................................... 11
• The Brenda Strafford Society for the Prevention of Domestic Violence 2.3 This Report.............................................................................................. 13
• YWCA of Calgary Section III. ACWS Aggregated Data Set— Trends in Admissions, Turn-aways and
Crisis Calls 16
3.1 Shelter Location and Adult Admissions................................................. 16
The Project Manager 3.2 Shelter Location and Adult Admissions Over Time............................... 17
Carolyn Goard, ACWS Director, Member Programs and Services
3.3 Shelter Capacity Shortages.................................................................... 21
3.4 Crisis Calls.............................................................................................. 24
And her colleagues contributing to the project at ACWS
Jan Reimer, Provincial Coordinator Section IV. HOMES Data Set— Demographic Trends 28
Ken Seto, Finance and Information Administrator 4.1 Shelter Population Diversity.................................................................. 28
Charleen Shaw, Office Administrator 4.2 Age........................................................................................................ 32
Christie Lavan, Communications and Partnerships 4.3 Marital Status........................................................................................ 33
Melissa Cloutier, Communications Associate 4.4 Dependent Admissions.......................................................................... 35
Jennifer Ness, Administrative Assistant, Projects
4.5 Dependents’ Age................................................................................... 37
Joy Medori, Research and Outcomes Specialist
Sylvia Hoang, Summer Student 4.6 Employment Status of Women in Shelter.............................................. 38
Amy Mercure, Research and Outcomes Specialist Section V. Reasons for Shelter Access and History of Abuse 41
5.1 Types of Admission................................................................................ 41
Principal Authors 5.2 Abuse Type............................................................................................ 42
Irene Hoffart M.S.W., Synergy Research Group and 5.3 Primary Abuser...................................................................................... 44
Dr. Kathleen Cairns, PhD Section VI. Length of Stay and Shelter Services 47
6.1 Length of Stay in Emergency Shelters.................................................... 47
Completed for 6.2 Length of Stay in Second-Stage Shelters................................................ 49
The Alberta Council of Women’s Shelters 6.3 Services Provided.................................................................................. 49
January 2012 ISBN# 978-1-927125-01-4
Table of Contents                                                                                                         List of Figures
                                                                                                                              Figure 1.  Shelter Availability by Geographic Location.............................................                       10
Section VII. Transportation and Distance Travelled                                                                       51   Figure 2.  Number of Adult Admissions by Location...............................................                          16
              7.1 Means of Transportation to the Shelter..............................................                   51   Figure 3.  Proportion of Adult Admissions Recorded by On-Reserve Shelters........                                         17
             7.2 Distances Travelled..............................................................................       53   Figure 4.  Number of Adult Admissions by Year and Shelter Geographic Location                                             18
Section VIII. Police Involvement                                                                                         55   Figure 5.  Number of Adult Admissions by Year and Shelter Location Size.............                                      19
              8.1 Type of Police Involvement.................................................................            56   Figure 6.   Number of Emergency Shelter Beds in Alberta by Year and Location....                                          20
Section IX. Trends for Aboriginal Population                                                                             59   Figure 7.  Number of Adult Women Turned Away in Edmonton and Calgary by
              9.1 Admissions..........................................................................................   59              Year and Reason......................................................................................          22
              9.2 Demographic Characteristics of Aboriginal Women...........................                             61   Figure 8. Number of Adult Women Turned Away by Year and Reason— Smaller
              9.3 Abuse History......................................................................................    65             Centres.....................................................................................................    23
              9.4 Shelter Services..................................................................................     67   Figure 9. Number of Crisis Calls by the Size of Municipality...................................                           25
              9.5 Transportation and Distance Travelled...............................................                   69   Figure 10. Average Length of Crisis Calls by Shelter Location by Year......................                               26
Section X. Overall Summary and Conclusions                                                                               71   Figure 11. Shelter Admissions by Cultural Background and Year.............................                                30
             10.1 Shelter Admissions.............................................................................        71   Figure 12. Cultural Background by Size of Municipality............................................                        31
             10.2 Capacity Issues...................................................................................     72   Figure 13. Cultural Background by Shelter Location................................................                        31
             10.3 Rural Service Delivery Context............................................................             72   Figure 14. Age of Women in Shelters......................................................................                 33
             10.4 Length of Stay in Shelters...................................................................          73   Figure 15. Marital Status by Shelter Catchment Area..............................................                         34
             10.5 Increasing Client Complexity..............................................................             73   Figure 16. Marital Status by Year.............................................................................            34
             10.6 Aboriginal Women in Shelters............................................................               73   Figure 17. Admissions of Single Women by Year......................................................                       35
             10.7 Rising Rates of Unemployment..........................................................                 74   Figure 18. Number of Dependents Accompanying Women to Shelters...................                                         36
             10.8 Services Provided...............................................................................       74   Figure 19. Number of Dependents Accompanying Women to Shelters by Year.......                                             36
             10.9 Need for Increased and Specialized Children’s Programming............                                  74   Figure 20. Age of Admitted Dependents..................................................................                   37
             10.10 Police Involvement...........................................................................         75   Figure 21. Employment of Women Admitted to Shelters by Year............................                                   39
             10.11 Directions for Future Research and Analysis....................................                       76   Figure 22. Type of Admission by Size of Shelter Catchment Area............................                                41
Appendix A. Organziations Currently Members of ACWS                                                                      79   Figure 23. Adult Admissions in Smaller Centres by Type of Admission....................                                   42
Appendix B. Focus Group Locations and Participating ACWS Members                                                         81   Figure 24. Types of Abuse Reported by Women Accessing Shelters........................                                    43
                                                                                                                              Figure 25. Types of Abuse Reported by Year............................................................                    44
                                                                                                                              Figure 26. Type of Primary Abuser............................................................................             45
                                                                                                                              Figure 27. Abuser Type by Year.................................................................................           46
                                                                                                                              Figure 28. Number of Days in Shelter by Proportion of Admissions........................                                  47
                                                                                                                              Figure 29. Average Length of Stay in Emergency Shelters by Year and Type of
                                                                                                                                        Centre.......................................................................................................   48
                                                                                                                              Figure 30. Services Provided by Shelter....................................................................               49
                                                                                                                              Figure 31. Transportation to Shelter..................................................................                    51
                                                                                                                              Figure 32. Transportation Method by Centre Size....................................................                       52
                                                                                                                              Figure 33. Transportation Method by Year...............................................................                   53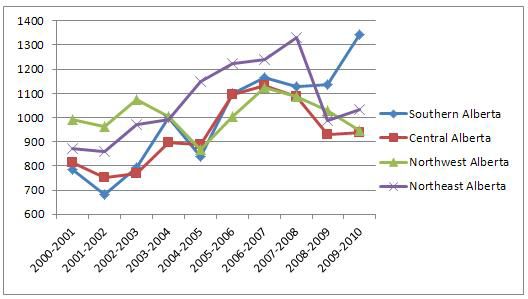
List of Figures                                                                                              SECTION I. EXECUTIVE SUMMARY
Figure 34. Distances Travelled to Shelter by the Size of Centre................................                             53   This study used the recent transition of ACWS and its members from HOMES to a new
                                                                                                                                 system as an opportunity to review all shelter data collected on the HOMES system
Figure 35. Porportion of Admissions Involving Police by Shelter Location and
                                                                                                                                 between 2000 and 2010. The analysis of data entered by shelters into HOMES, as well
           Woman’s Background..............................................................................                 55
                                                                                                                                 as ACWS aggregated data (including data from all ACWS member shelters), provided
Figure 36. Police Involvement by Year and Background...........................................                             56   a clearer understanding of the characteristics of women served by Alberta’s shelters.
Figure 37. Type of Police Involvement......................................................................                 56   This understanding can now be used to inform shelter practices, improve care, provide
Figure 38. Type of Police Involvement by Shelter Resident Background..................                                      57   evidence-based information to funders and decision makers and document trends in
Figure 39. Proportion of Aboriginal Shelter Admissions by Centre Size...................                                    60   shelter use across the province. It can also be used to improve future data collection in the
                                                                                                                                 shelters.
Figure 40. Location of Shelter Admission for Women who Reside On-Reserve by
           Year..........................................................................................................   60
                                                                                                                                 The ACWS aggregated annual data set used in some components of this trend analysis
Figure 41. Aboriginal Women Using Shelters by Age Range.....................................                                61   was based on the annual reports provided by ACWS’s members, including 34 emergency
Figure 42. Age of Aboriginal Dependents................................................................                     62   shelters (five on First Nations reserves), seven second-stage shelters (including one on a
Figure 43. Marital Status of Aboriginal Women by Year..........................................                             63   First Nation reserve) and the two seniors’ shelters. The analyses that required individually
Figure 44. Employment Status of Aboriginal Women by Year.................................                                   64   coded data (e.g. cross-group comparisons) used the HOMES data only. This data set
Figure 45. Type of Admission: Aboriginal Women....................................................                          65   included 34 shelters— 32 emergency (two on-reserve) and two second-stage shelters—
                                                                                                                                 for a total of 46,571 adult admissions to shelters as well as 34,260 dependent admissions.
Figure 46. Primary Abuser by Background..............................................................                       66
                                                                                                                                 The data analyses considered the geographical location of shelters (Northwest, Northeast,
Figure 47. Type of Abuse Reported by Aboriginal Women in Alberta Shelters........                                           67   Central and Southern Alberta), as well as centre size: Edmonton and Calgary1 (large urban),
Figure 48. Length of Stay in Emergency Shelters by Aboriginal Women..................                                       68   small cities2 and towns/rural locations.3
Figure 49. Length of Stay in Emergency Shelters Over Time by Aboriginal Women                                               68
Figure 50. Means of Transportation Used by Aboriginal Women.............................                                    70   The initial results of the data analysis were presented and discussed with focus groups
                                                                                                                                 that included 62 staff members representing 32 ACWS members around Alberta. These
Figure 51. Distance Travelled by Aboriginal Women by Year....................................                               70
                                                                                                                                 discussions identified additional analyses that could be useful as well as some possible
                                                                                                                                 explanations for findings. This final report includes information from the ACWS aggregated
                                                                                                                                 data set, the HOMES data set and the staff focus groups.

                                                                                                                                 The following trends and their implications for future practice represent key findings from
                                                                                                                                 this study.

                                                                                                                                 1.1      Shelter Admissions
                                                                                                                                 About a third of overall shelter admissions were documented in Edmonton or Calgary
                                                                                                                                 (n=20,478 or 33%). Another third occurred in small cities such as Medicine Hat or Grande
                                                                                                                                 Prairie (n=18,407 or 29.8%), and the remaining 36% of admissions (n=22,533) were in
                                                                                                                                 towns/rural areas such as Brooks or Sucker Creek. The majority of shelters in towns or rural
                                                                                                                                 areas (86%) are located in Northern Alberta.

                                                                                                                                 Admissions to shelters in Alberta increased by half or more until 2005/2006, before starting
                                                                                                                                 to decrease albeit to levels higher than those found in the first three years. Factors related

                                                                                                                                 1
                                                                                                                                   Includes Strathcona County
                                                                                                                                 2
                                                                                                                                   Grande Prairie, Fort McMurray, Lethbridge, Medicine Hat, Red Deer
                                                                                                                                 3
                                                                                                                                   Fairview, Grande Cache, High Level, Peace River, Sucker Creek, Whitecourt, Wabasca, Cold Lake, Lac La Biche, Fort
                                                                                                                                 Chipewyan, St. Paul, Camrose, Hobbema, Lloydminster, Rocky Mountain House, Hinton, Brooks, Strathmore, Pincher
                                                                                                                                 Creek, Black Diamond, Taber, Banff

                                                                                                                                                                                            1
to the increase in admissions in those years include increased shelter funding, growing           currently experience other multiple issues such as homelessness, poverty, lack of available
number of available shelter beds and various public awareness and media campaigns. After          housing, or problems with mental health or addictions. The need to accommodate diverse
2006 the number of admissions has been gradually decreasing. Particularly in Calgary,             needs places additional pressure on town and rural shelters since staffing and staff training
Edmonton and Central Alberta this decrease may be associated with the number of beds              must be more encompassing.
available in those areas.
                                                                                                  Issues of transportation and distances travelled to shelter illustrate the different nature of
While Edmonton and Calgary have over half of the overall population in Alberta, they              service delivery in urban and smaller centres.
account for only a third of all provincial admissions. The number of beds has not kept pace
with population increases. Shelters can only accept the number of admissions that bed             1.4    Length of Stay in Shelters
space allows. Since occupancy rates in all emergency shelters in Edmonton and Calgary are         Length of stay in emergency shelters has shown increases in the proportion of women
high, this finding suggests that additional shelter capacity is needed in both cities.            with longer stays and corresponding decreases in the number of short stays. The average
                                                                                                  length of stay increased from 11 to 13 days. These changes may reflect the increasing
1.2    Capacity Issues                                                                            complexity of client needs, as well as the economic downturn with its concomitant increase
The number of women turned away from Alberta shelters has decreased since 2000 and                in unemployment and shortages of affordable housing.
about half of turn-away numbers are for reasons other than shelters being full. However,
turn-away rates continue to be a significant concern. The impact on the safety of these           However, the fact that more than one third of the shelter population stays in shelter for only
women and children is severe.                                                                     one to five days suggests that shelter staff have very little time to assist these women. This
                                                                                                  pattern is particularly true for abused women without children, abused women who are
In addition, while immediate abuse may not be the presenting factor for those women who           living with their partners at the time of admission and those who enter shelters for reasons
were turned away for other reasons, abuse is a significant contributor to homelessness,           Other than Abuse.
addiction and mental health concerns. Moreover, considerable time is expended by shelter
staff to provide crisis, advocacy and referral support to the women and children who are          1.5    Increasing Client Complexity
turned away.                                                                                      The overall population of Aboriginal women and women of Other Backgrounds (e.g.
                                                                                                  immigrants, refugees, visible minorities, etc.) using Alberta’s shelters rose from 64% of
The trends in the number of turn-aways from 2000 to 2010 likely reflect a combination of          the shelter population in 2003 to about 71% currently. These two groups have lower
factors, including:                                                                               employment rates and income levels related to lack of employment opportunities,
• Decreases in 2000-2005 correspond to increases in shelter capacity as a result of               discrimination, and cultural and language barriers. These results reinforce staff-identified
    federal, provincial, government and community funders’ initiatives;                           needs for appropriate training to best serve women from various cultures and backgrounds.
• Increases during 2005-2008: the economic boom years in Alberta;
• Decreases in turn-aways in 2007/2009 due to use of new provincial funding to hire               The results also support shelter workers’ observations of increasing client complexity, which
    outreach workers, reducing demand on emergency facilities;                                    results in increased length of stay in shelters. The regions and communities in which they
• Increases for 2008-2010 reflecting Alberta population growth coupled with slower                reside are less likely to have sufficient capacity in community resources such as access to
    growth in the number of funded beds, particularly in Calgary and Edmonton; and                affordable housing, child care and mental health or addiction treatment.
• Recent increases reflecting the longer length of stay at some shelters as the complexity
    of women’s needs increase, the economic downturn lengthens and scarce subsidized              Women entering shelters typically report more than one type of abuse, with emotional
    housing.                                                                                      abuse, physical abuse, financial abuse and verbal abuse being most frequently identified.
                                                                                                  The data for this report confirm that abuse is multifaceted. The complex combination of
1.3    Rural Service Delivery Context                                                             abuse types emphasizes the need for a careful and comprehensive assessment of each
Shelters in smaller Alberta centres must deal with a number of other issues that are unique       woman’s circumstances to inform shelter services.
to their locations. For example, a domestic violence shelter in a small centre may be one of
very few services available in its area, resulting in a large variety of service needs that the   1.6    Aboriginal Women in Shelters
shelter may not be able to meet. A rural or small centre shelter may experience increased         Aboriginal women make up more than half of the shelter population (60% overall in 2010,
demand for services from women who, in addition to a history of domestic violence,                rising from 56% in 2003), and this proportion rises to almost 70% in Alberta’s northern

                                          2                                                                                                  3
shelters. The information in this report suggests that Aboriginal women using Alberta’s They also reflect the growing need for trained child care staff to work with mothers and
shelters come with unique characteristics, experiences and needs when compared to their children to mitigate the impact of domestic violence on children. Reducing their
women from Other Backgrounds on a number of important variables. For example, they trauma can substantially improve the likelihood of resilience in neurologic, cognitive
are younger than the general shelter population, they are more likely to be in a common and social development. Children’s programming, particularly programming focusing
law relationship, they are more likely to be unemployed, they have more children and they on preschool children, is an essential component of shelter service requirements.
have shorter shelter stays. If shelter services for Aboriginal women are to be effective, they Implementation of this programming will require increases in specialized staffing, staff
must be responsive to the unique characteristics of Aboriginal women’s shelter use as well training and completed referrals to community support programs when mothers and their
as the cultural requirements and social needs that diverse groups within the Aboriginal children leave the shelters.
population may bring to shelter.
Moreover, shelter policies and women’s circumstances often result in lower number of
1.7 Rising Rates of Unemployment older dependent admissions. These older children, although not in shelter, might also
Unemployed women made up an increasing proportion of the shelter population overall, need additional services and support that may be best provided through shelter outreach
rising from 69% in 2006 to about 75% in 2010. This change has implications for shelter programming.
service requirements, increasing the emphasis on assisting women with child care,
affordable housing, employment opportunities and other sources of income supports. The 1.10 Police Involvement
increasing number of unemployed women and children living in poverty may also imply The rate of police involvement with women accessing shelters is a function of multiple
a more chronic population since women with mental health or addiction problems have factors, including women’s own choices about whether and how to involve the police,
greater difficulty in finding and maintaining employment. Abused women with no regular the nature and severity of the offence, the legislation that is in place guiding the work of
income may also be more likely than other women to use shelters as a consequence of the police, the training of new police recruits and the resources available to the police in
having fewer resources at their disposal. In addition, employers may not understand the different geographic areas. Taking all these considerations into account, the information
implications that domestic violence may have on the workplace. Adding poverty to the described here identifies some areas where progress has been made (e.g. more charges
abuse equation is likely to result in women needing either to return to shelters more laid, arrests made and orders enforced, etc.) but also some areas of concern (e.g. decrease
frequently or to extend their length of stay. in proportion of women informed about assistance and women who were assisted to leave
home, etc.).
1.8 Services Provided
Information about the scope and types of services provided by shelters is essential to Of particular concern are the reductions in services that police provide for Aboriginal
understand what services or a combination of services work for women and children in women (e.g. the police are less likely to provide information to Aboriginal women, to help
shelters. Documentation of shelter services also provides a comprehensive view of the them leave home, or to provide them with transportation, etc.). It is impossible to know
work that shelter staff must undertake to support women and children in their care. from the available data whether these differences were partially due to the women’s own
Identifying a list of core services common to shelters across Alberta and then developing preferences or perceptions. Discussions are needed on a provincial level between ACWS and
a method to guide consistent and accurate tracking of those services is an important provincial police representatives, as well as between individual shelters and their relevant
task that Alberta shelters should consider undertaking to better inform funders and the police/RCMP detachments to further examine and understand these trends and address any
community of the varied and complex work they do. issues of concern.
1.9 Need for Increased and Specialized Children’s Programming ACWS may wish to further explore women’s experiences with police through further
Over the period of the study, 35,651 dependents accompanied women to the shelter and research including data analysis and focus groups.
accessed shelter services. 48% of those children are aged zero to six years and about 30%
are under three years of age; the proportion of preschool children in shelters is increasing.
These findings emphasize the importance of programming for children in shelters. Trauma
prevention, early assessment and interventions, and informed referrals of women with
young children to appropriate community resources following shelter stays are increasingly
critical components of shelter services.
4 5SECTION II. BACKGROUND
AND PROJECT PURPOSE
Alberta’s women’s shelters have led the country in the development of a knowledge-based
approach to service delivery. Particularly important was the ACWS effort to unite members
in collecting information on a common online database system to better describe their life-
saving work. Until August of 2010, the Alberta Council of Women’s Shelters (ACWS) and
most of its members used the HOMES database4 to collect data on client access to services.
The resulting data were used to inform individual shelters about internal trends, to create
an aggregate picture of shelter work in the province on an annual basis and to undertake
projects to explore the implementation of promising practices within shelters.
Their data collection was marked with successes. For example, understanding reasons
why women returned to their abuser informed the provincial government’s move to
increase financial support to women leaving abuse. This benefit is now available to women
regardless of how many times they leave.5 Reports on the numbers of women who were
unable to access shelter because the shelter was full resulted in increases in the number
of funded beds across the province.6 With the data on police response, ACWS encouraged
the RCMP to review their response to domestic violence, resulting in a full file review of all
cases following a tragic death in Northern Alberta. And lastly, two significant collaborative
promising practice projects have been completed that helped inform shelter service
delivery.7
The recent transition of ACWS and 39 of its 43 member organizations from HOMES to a new
system8 presented an opportunity to review shelter data collected between the initial use of
the HOMES database in 2000 and its final use in 2010.
The experiential knowledge of Canadian shelter workers in the field of domestic violence
indicates that trends in abuse rates parallel larger socio-economic trends, such as changes
in employment and income or in the availability of affordable housing. However, there is
currently no comprehensive research in Canada to substantiate this understanding. The lack
of specific data diminishes shelters’ ability to anticipate changes in demand for services and
undertake timely and proactive preventive work in the community. A lack of understanding
of the impact of such trends also limits the development of appropriate, responsive
partnerships among stakeholders and the ability to inform provincial policy and funding
models.
4 HOMES is Hull Outcome Monitoring and Evaluation System that shelters used to gather their data between 2000
and August of 2010
5 In the period between 2006/2007 fiscal year and February 2012 a total of 15,172 women were helped as a
result of the escaping abuse benefit, (Alberta Human Service’s e-mail dated March 28, 2012).
6 Based on the information received from Alberta Human Services (February 3rd, 2012)— a total of 134 additional
emergency beds were funded from 2005 to 2009.
7 Cairns, K. & Hoffart, I. (2009). Keeping women alive: Assessing their danger. A report prepared for The Alberta
Council of Women’s Shelters. Retrieved from http://www.acws.ca/documents/KeepingWomenAlive.pdf; Hoffart, I. (2011).
Practical Frameworks for Change. A report prepared for The Alberta Council of Women’s Shelters. Retrieved from http://
www.acws.ca/documents/PFCFinalEvaluationReport.pdf.
8 Outcome Tracker is a web-based data management software program that ACWS member organizations chose
to replace the discontinued HOMES program. Outcome Tracker was developed and is managed by Vista Share, which was
formed in 2001 to serve the data management needs of non-profit organizations across North America.
6 7The analysis of the shelters’ 2000-2010 Aggregated and HOMES data is therefore intended • Seniors’ Shelters. These shelters provide specialized services to seniors experiencing
to contribute to developing an understanding of how socio-economic trends relate to the abuse. There are two seniors’ shelters in Alberta, one in Edmonton and the other in
use of Alberta’s women’s shelters. Calgary.
The purposes of the analysis include: Most Alberta shelters receive funding from the Alberta Human Services. The Ministry’s
1. Gaining a better understanding of the characteristics and needs of the women served funds are primarily allocated to staffing. These allocations vary depending on the shelter
by Alberta’s emergency and second-stage shelters; type and location. For example, of the ten second-stage shelters, only two have ongoing
2. Informing shelter practice and improving care; contracts for some of their programs.
3. Supporting evidence-based requests for funders and decision makers;
4. Documenting trends in shelter use across the province, within geographic areas and Emergency shelters located on First Nations reserves receive limited federal government
within population groups; and funding; several also have per diem contracts with the province. Most shelters rely on
5. Motivating the improvement of data collection to support future initiatives to other funding sources and donations to support the full range of services they provide.
continuously improve and support services to abused women and their children.
2.1 Alberta Shelters
Alberta’s women’s shelters support women and their children fleeing abuse by providing
a continuum of services ranging from prevention to crisis intervention to follow-up. There
are currently 43 organizations in Alberta that operate 50 shelters, distributed across all
regions of the province (see figure 1 for map; please see Appendix A for a complete list of
ACWS member organizations).
For the purposes of this study, shelter data was analyzed in a number of ways, including
geographic location, type and size of municipality.9 In some instances, shelters were
considered geographically in four groups— Northwest, Northeast, Central and Southern
Alberta. At other times, it was more informative to analyze based on centre size.
In some locations— particularly large centres such as Edmonton and Calgary— there
may be more than one shelter and more than one type of shelter. Some sheltering
organizations may also manage more than one shelter. There are three different types of
women’s shelters in Alberta, including:
• Emergency Domestic Violence Shelters. These shelters provide short-term, secure,
temporary and supportive accommodation in a communal living environment. There
are currently 38 emergency shelters in Alberta, including six located on First Nations
reserves.
• Second-Stage Domestic Violence Shelters. Second-stage shelters provide secure
apartment accommodation for six months or more. There are currently ten second-
stage domestic violence shelters in Alberta, half of which are in Edmonton and Calgary.
The remainder are either in rural or on-reserve communities. Five organizations offer
both emergency and second-stage shelter services.
9 Size of municipality included large urban locations (Edmonton and Calgary, with populations of over a million
people), small cities (populations of 10,000 people or more) and towns/rural locations (generally fewer than several thou-
sand people).
8 92.2 Description of the Data in this Report
This report includes the analysis of information from two data sets, described below, as
Northwest Alberta
well as input from focus groups with shelter workers who reviewed results.
Fort Chipewyan
ACWS Aggregated Annual Data
High Level ACWS’s fiscal year data collection includes information from shelters using HOMES as well
as information submitted to ACWS by shelters that did not use HOMES. This annual data
Fort was aggregated and did not include coded individual data. It included shelter-specific
McMurray variables such as the total number of admissions of women and children, information
about the crisis calls received, and the number of women who were turned away due
Peace River Wabasca Northeast Alberta to lack of capacity. The aggregated annual data was indexed by shelter rather than by
individual admissions.
Fairview
Sucker Creek
The final aggregated annual data set used in the trend analysis was based on the annual
Slave Lake reports provided by 43 Alberta member organizations, including 34 emergency shelters
Lac La Biche
Grande (five on First Nations reserves), seven second-stage shelters (including one on a First Nation
Prairie reserve)10 and the two seniors’ shelters. The information was collected starting in fiscal
Cold Lake
year 2000/2001 and concluded in August of 2010. The aggregated annual data set included
Whitecourt a total of 58,326 adult admissions and 53,235 dependent admissions.11
Grande
Cache
St. Paul HOMES Data
Sherwood Park
The HOMES data set included only information that was entered into HOMES by shelter
Hinton
staff. An initial review of the HOMES data for 2000–2010 indicated that, for many shelters,
Edmonton Lloydminster
routine data entry was not achieved until 2003. The analyses reported here using the
Maskwaci Camrose
Rocky Central Alberta HOMES data are therefore limited to 2003–2010. Shelters with data entry rates of less
Mountain than 50% for a variable were excluded from the analysis of that variable.
House
Red Deer
Unlike the ACWS Aggregated Annual Data described above, all data entered into HOMES
LEGEND Banff
Morley were indexed by individual admission, using anonymous client identification numbers
Strathmore
Southern Alberta to protect each woman’s identity. Each shelter’s HOMES file included information about
Emergency Shelters Brooks
Calgary each client, the services they received and their shelter outcomes. Since the data were
Second-Stage Housing Medicine Hat individual-based rather than aggregated, it was also possible to consider differences across
High River
clients on variables such as age or ethnicity, as well as to compare client groups and shelter
Taber experiences over time. Data from HOMES could also be analyzed by provincial region, size
Calgary Centre
Pincher Creek Lethbridge of the catchment area or shelter type.
Edmonton Centre
Standoff
10
The number of second-stage shelters in Alberta has changed over the years. Fort McMurray Family Crisis
Society temporarily operated a second-stage shelter during the time frame, and due to lack of funding not all second-
stage shelters were able to provide us with detailed usage data.
11
Each time a woman and/or a dependent are admitted to a shelter their admission is recorded as a single
Figure 1. Shelter Availability by Geographic Location. admission. Therefore, an individual woman or a child may have had multiple admissions to a particular shelter or
different shelters across the province. Their demographic, service and discharge information was gathered for each
individual admission. The HOMES program did not have a capacity to aggregate information from multiple admissions for
each individual woman and/or child.
10 11The final HOMES data set included 34 Alberta Shelters— 32 emergency and two second- 2.3 This Report
stage shelters. In comparison to the ACWS aggregated annual data, the HOMES data set When comparing the two data sets, the ACWS Aggregated Data Set paints a more
did not include seniors’ shelters, and had information from fewer emergency shelters (32 comprehensive picture of shelter use from the perspective of overall numbers, etc.
as compared to 34) and fewer second-stage shelters (two as compared to seven). There However, finer analyses are possible with the HOMES Data, which enables group
were two on-reserve shelters in the HOMES data set as compared to five on-reserve comparisons. The analysis of information from the aggregated annual data set (overall
shelters represented in the annual aggregated data set. The HOMES data set included a shelter admissions, turn-away numbers and information associated with crisis calls)
total of 46,571 adult admissions and 34,260 dependent admissions. includes regional and annual comparisons and is provided in Section II of this report.
The rest of the report discusses information from the HOMES data set, also integrating
Information from both data sets was downloaded into Excel and then analyzed using annual and regional comparisons, and discussing demographic characteristics of women
SPSS.12 and children in Alberta shelters, their domestic violence history, services and supports
provided by the shelters, as well as information about the transportation women used
Data Analysis Limitations to get to the shelter and police involvement with assistance to women who accessed the
Both data sets were indexed by number of admissions, rather than number of unique shelters during the study period.
women or children using the shelters. In other words, over the course of the trend
analysis period, one particular woman or child may be admitted more than once to a The data analyses included in this report suggest that the experiences and characteristics
particular shelter or to any shelter in Alberta. Some variables had low response rates. As of Aboriginal women using Alberta’s shelters are unique from other groups on a number
mentioned previously, any variable where response rates fell below 50% was not included of important variables. Aboriginal women also make up more than half of the shelter
in the analysis, with the result that sample size may vary across different analyses. population (55% overall in 2010), and this proportion rises to almost 70% in Alberta’s
northern shelters. Therefore, a separate section is devoted to analysis of information
Feedback from Shelter Staff pertaining specifically to the Aboriginal women and children accessing women’s shelters in
An initial analysis of the data was disseminated to focus groups in seven Alberta Alberta. We hope that the findings in this section will assist in improving policies, practices
locations, to which all member organizations were invited to participate, during May and procedures of member organizations and their partners who work with and support
and June of 2011. The purpose of the focus groups was to present information to Aboriginal women in our province.
shelter representatives in each provincial region and to discuss it from the perspective of
individual shelter and regional experiences, as well as from an historical perspective. The
feedback from these focus groups has been incorporated into the analysis sections of this
report.
Sixty-two staff representing 32 women’s shelters participated in seven focus groups, which
were held in the following locations:
• Grande Prairie (shelters in NW Alberta)
• Lac La Biche (shelters in NE Alberta)
• Edmonton #1 (on-reserve shelters)
• Edmonton #2 (shelters in Edmonton)
• Red Deer (shelters in Central Alberta)
• Calgary (shelters in Calgary)
• Lethbridge (shelters in Alberta South)
For a full list of member organizations participating in the focus groups, please see Appendix B in this report.
12 Statistical Package for Social Sciences (SPSS) is a computer program used for statistical analysis. IBM SPSS is
now fully integrated into the IBM Corporation, and is one of the brands under IBM Software Group’s Business Analytics
Portfolio, together with IBM Cognos.
12 13AGGREGATED DATA SET 14 15
SECTION III. ACWS AGGREGATED DATA SET—
                                                                                                            TRENDS IN ADMISSIONS,
                                                                                                       TURN-AWAYS AND CRISIS CALLS
                                                                                3.1      Shelter Location and Adult Admissions
                                                                                About 30% of all Alberta shelters (in the aggregated data set 12 out of 43) are located
                                                                                in Edmonton and Calgary. As shown in Figure 2 (below), about 34% (n= 20, 804) of all
                                                                                admissions are reported by shelters in these two urban centres.13 Another third occurred in
                                                                                small cities such as Medicine Hat or Grande Prairie (n=18,407 or 30.2%), and the remaining

Strength in Numbers: A Ten-Year Trend Analysis of Women’s Shelters in Alberta
                                                                                36% of admissions (n=21,642) were in towns/rural areas such as Brooks or Sucker Creek. The
                                                                                majority of shelters in towns or rural areas (86%) are located in Northern Alberta.

                                                                                Figure 2. Number of Adult Admissions by Location.

                                                                                The distribution of shelter admissions across Alberta is disproportionate to its overall
                                                                                population distribution. Between 2000 and 2010, the combined populations of Calgary and
                                                                                Edmonton represented about half of the overall Alberta population.14 However, admissions
                                                                                to shelters in these two cities accounted for only about a third of all provincial admissions:
                                                                                this is likely a direct result of the number of beds available in these shelters. Since occupancy
                                                                                rates in all emergency shelters in Calgary and Edmonton are high, this finding suggests that
                                                                                additional shelter capacity may be needed in both cities.

                                                                                While smaller Alberta centres do not experience the same level of demand for service as the
                                                                                larger urban centres do, they must deal with a number of other issues that are unique to
                                                                                their locations. For example, a domestic violence shelter in a small centre may be one of very
                                                                                few services available in its area, creating challenges in the form of needs that the shelter
                                                                                may not be able to meet. A rural or small centre shelter may experience increased demand
                                                                                for services from women who, in addition to a history of domestic violence, experience
                                                                                multiple other issues such as homelessness, poverty, lack of available housing, or problems
                                                                                with mental health or addictions. Larger urban shelters may not be able to admit those
                                                                                women due to lack of capacity or there may be other community resources available to them
                                                                                in urban communities.

                                                                                13 Includes admissions in all shelter types— emergency, second-stage and seniors.
                                                                                14 Government of Alberta. Municipal census and population lists 2000-2010. Retrieved May 2012 from http://www.mu-
                                                                                nicipalaffairs.alberta.ca/mc_official_populations.cfm.

                                                                                                                                        16
The ACWS Aggregated Data Set also contains information from five shelters on First Nations
reserves.15 About 6%, or 3,748, of all admissions to shelters were recorded by these on-
reserve shelters. The proportion of provincial admissions within the on-reserve group (see
Figure 3 below) ranges from 21% of all on-reserve admissions in Southern Alberta and
Northwest Alberta (n=794 and n=781 respectively) to 32% of admissions in Northeast Alberta
(n=1,212).
Figure 3. Proportion of All Adult Admissions Recorded by On-Reserve Shelters.
3.2 Shelter Location and Adult Admissions Over Time
Figure 4 on the following page compares the annual trends in adult admissions by
geographical area across Alberta. When considered over the ten-year study period, the
overall adult shelter admissions showed a gradual increase over the first six fiscal years of
the study period. The total number of shelter admission increased from 5,396 in 2000/2001
to 6,844 admissions in 2005/2006, although there was a slight drop in overall admissions in
2004/2005 fiscal year. Thereafter, the total admissions remained fairly stable or decreased,
fluctuating between 6,778 in 2006/2007 and 6,092 in 2008/2009 fiscal year.
The overall trend toward increasing numbers of admissions until 2005/2006 followed by
decrease in admission numbers was particularly evident for shelters in the Calgary and
Edmonton. The number of admissions continued to increase until 2006-2007 year in all other
areas and until 2007-2008 in Northeastern Alberta.
Figure 4. Number of Adult Admissions by Year and Shelter Geographic Location.
When number of admissions was compared across the size of centre (Edmonton and
Calgary, small cities, towns and rural areas– see Figure 5 next page), the results produced
a similar distribution of admissions over the years, but with some additional trends. While
the number of admissions in Edmonton and Calgary increased until 2005/2006 and then
decreased or remained stable, the number of admissions in small cities peaked in 2007/2008
fiscal year, and the growth of admissions continued in towns and rural areas, with the
15 Kainai Children Services Corporation became a member at the end of 2010 and is not included in these calculations.
17 18exception of interruptions to this trend in 2001/2002, 2004/2005 and 2008/2009.
An analysis comparing changes in all types of beds and bedrooms over time would be
important to help understand the trends in shelter funding and how they influence shelter
capacity and services.
Figure 6. Number of Emergency Shelter Beds in Alberta by Year and Location.
Figure 5. Number of Adult Admissions by Year and Shelter Location Size.16 The focus group discussions with shelter staff suggested that the upward trend in admission
patterns, particularly between 2003 and 2006, were related to several factors that
Trends in the number of shelter beds available across the province appear to be related to contributed to an increase in shelter funding, allowing some shelters to fund previously
the admission trends.17 As Figure 6 shows (see next page), since 2002, there has been an unfunded beds and increase staff wages. These factors included:
overall gradual increase in the number of emergency shelter beds.18 Those increases were 1. The federal government’s funding of emergency shelter capacity and program
particularly prominent in Southern Alberta (from 82 to 161 beds) and Northwest Alberta improvement;
(from 102 to 152 beds). By comparison, the number of emergency beds in Central Alberta 2. The Alberta Roundtable on Family Violence and Bullying that took place in 2004. The
and in Calgary has not changed substantially, with the exception of some bed increases in Roundtable was initiated as a result of the high domestic violence homicide rates in
Calgary in 2011/2012 fiscal year. Alberta and, in particular, several domestic violence related homicides that occurred
in 2002 and 2003; one homicide case in particular resulted in an inquiry and was
As was noted earlier, there are also currently ten second-stage shelters in Alberta: three in accompanied by a media campaign and wide ranging publicity for the issue;
Calgary, two in Edmonton, one each in Southern and Central Alberta and two on-reserve. 3. ACWS was funded by the provincial government for two years of major advertisement
One second-stage shelter in Northeastern Alberta started operations in the 2010/2011 fiscal and public awareness campaigns. This funding ended in 2006/2007;
year. The number of bedrooms available in those second-stage shelters has not changed 4. The ‘oil boom’ in Alberta was at its peak in 2004/2005, resulting in population increases,
substantially in the South, Central Alberta or in Edmonton but has increased in Calgary from housing access problems and major changes in other provincial socio-economic
48 bedrooms in 2002 to 77 in 2011/2012. indicators;
5. The Minister of Children’s Services between 2001 and 2004 supported the shelters and
Figure 6 on the following page refers to all emergency shelter beds— both those that are was committed to addressing the issue of domestic violence; and,
funded by the provincial government, those that are funded through other sources as well 6. A new 1-800 line was advertised in 2004/2005 and may have encouraged more women to
as beds that are not funded. Reasons for gradual decrease in admissions in locations such as use shelters.
Calgary and Central Alberta since 2006 may reflect an interaction between existing shelter
capacity, continued demand for shelter services and increasing average length of stay.
16 One second-stage shelter in Northwestern Alberta started operations in the 2010/2011 fiscal year.
17 Note that information for some fiscal years was not available at the time of this report.
18 The figure includes emergency shelter beds— those that are funded by Alberta Human Services, those that are
funded from other sources and those that are not funded. According to Human Services, provincial government funded an
additional 134 emergency shelter beds between 2005 and 2009.
19 20Admissions to shelters in Alberta increased by half or more until 2005/2006 before 2006/2007, corresponding with the economic boom and related population growth and
starting to decrease, albeit to levels higher than those found in the first three years. housing shortages in those years. When the economy slowed, however, turn-aways again
Factors related to the increase in admissions in those years include increased shelter decreased (2007/2008). Recently, the rate has begun to rise again, from a low of about 2,200
funding, growing number of available shelter beds as well as various public awareness and turn-aways in 2007/2008 to just under 4,000 in 2010, suggesting increasing strain on shelter
media campaigns. capacity.
Since 2006, the number of admissions has been gradually decreasing. In Calgary, In contrast to turn-aways due to capacity limitations, the number of women turned away
Edmonton and Central Alberta this decrease may be associated with the number of for other reasons has increased substantially in Calgary and Edmonton, possibly indicating
beds available in those areas. The two cities in particular have about half of the overall a narrowing of shelter entry criteria as capacity became strained. However, many of these
population in Alberta, while they account for only a third of all provincial admissions. The turn-aways may also be the result of a lack of available services in the community, even
disproportionate number of admissions is probably a direct result of the number of beds in Edmonton and Calgary, in the critical areas of mental health and addiction services and
available in the shelters, as well as the disproportionate growth in the number of beds housing programs. Note that the turn-away numbers in Edmonton and Calgary may also
available across the province. Shelters can only accept the number of admissions that have been influenced by differences in approaches taken in those two cities with respect
space allows. Since occupancy rates in all emergency shelters in Edmonton and Calgary to reporting (i.e. counting requests for admission versus number of unique women making
are high, this finding suggests that additional shelter capacity may be needed in both those requests— it is not always possible for shelters to determine if women have phoned
cities. more than once, or phoned multiple shelters).
3.3 Shelter Capacity Shortages
103,343 women and 108,955 children were recorded as having been turned away by shelters
across Alberta in the span of the ten years considered for this study.19 Over 80% of these
women and children were turned away from Edmonton or Calgary shelters. As was noted
in the discussion above, the number of shelter spaces available in these two locations is
disproportionately lower than would be expected on the basis of provincial population
distribution.
48% of these women and children were turned away because shelters were full (i.e. lacked Figure 7. Number of Adult Women Turned Away in Edmonton and Calgary by Year and
additional funded capacity). The remaining 52% were turned away for reasons related Reason.
to complex needs that could not be managed in the shelter, an unmet shelter priority
established for the shelter, and/or when admission would potentially compromise the safety Capacity Shortages in Smaller Locations
and security of women currently in residence. Turn-away patterns were also examined separately across geographic areas and location
size. This analysis showed that it is the population size in a shelter’s service area that makes
Capacity Shortages in Calgary and Edmonton the difference in the turn-away rates, rather than the location of the shelter within Alberta.
As shown in Figure 7 on the following page, the number of women turned away in Calgary As shown in Figure 8 (on the following page), turn-away patterns are substantially different
and Edmonton differed substantially by year, depending on reason for service refusal. In when small cities and towns/rural locations are examined separately from Calgary and
Alberta’s two largest cities, the number of women and children turned away due to lack of Edmonton. In those shelters, the overall turn-away numbers increased steadily over the first
capacity decreased very substantially from 2001 through 2005, as the number of funded eight years (2000-2008) and then dropped substantially in the last two years. The increase
shelter beds increased. There were temporary increases in this turn-away category in in 2006/2007 may again have been a result of economic boom conditions in Alberta. Small
cities, particularly in the more recent years, also appear to be more likely to turn-away
19 This number reflects separate requests for admission that shelters were unable to accommodate due to lack of women for reasons other than the shelter being full and are less likely to be full than the
suitable or available space. Turn-aways are counted in the same way as admissions, that is by each admission/turn-away
rather than by individual women or children that may request admission multiple times.
shelters in urban centres.
21 22You can also read


