Land, Economy, Opportunity: Industrial Land Supply and Demand in Greater Boston
←
→
Page content transcription
If your browser does not render page correctly, please read the page content below
Land, Economy, Opportunity:
Industrial Land Supply and Demand in
Greater Boston
Produced by the Metropolitan Area Planning Council
MetroCommon 2050

February 2023

                                                     Photo credit: Tima Miroshnichenko, via pexels.com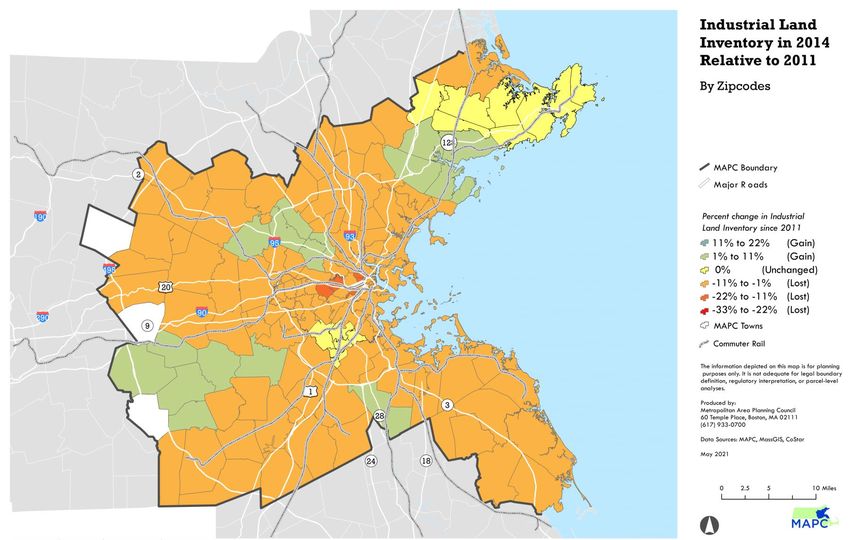
Contents
Acknowledgments .......................................................................................................................................................................................................................................... 4
Executive Summary........................................................................................................................................................................................................................................ 5
Introduction...................................................................................................................................................................................................................................................... 9
        Why Industrial? ..................................................................................................................................................................................................................................... 9

        Defining Industrial.............................................................................................................................................................................................................................. 10

        Real Estate .......................................................................................................................................................................................................................................... 11

        Report Goals ...................................................................................................................................................................................................................................... 12

Literature Review ........................................................................................................................................................................................................................................ 12
        Key Themes ......................................................................................................................................................................................................................................... 12

        Case Study – London’s Industrial Land Supply and Economy Study ....................................................................................................................................... 15

        Previous studies in the Boston Region ............................................................................................................................................................................................ 16

        Key Takeaways ................................................................................................................................................................................................................................. 16

Industrial Business and Occupational Analysis ...................................................................................................................................................................................... 17
        Methodology ...................................................................................................................................................................................................................................... 17

        Industrial Business Composition ....................................................................................................................................................................................................... 18

        Industrial Employment Composition................................................................................................................................................................................................ 19

        Key Takeaways ................................................................................................................................................................................................................................. 25

Land Use Analysis ....................................................................................................................................................................................................................................... 25
        Methodology ...................................................................................................................................................................................................................................... 25

        Assessors Data Analysis.................................................................................................................................................................................................................... 26

        Industrial Land Use Parcels and Community Types..................................................................................................................................................................... 28

        Key Takeaways ................................................................................................................................................................................................................................. 32

                                                                                                                                                                                                                                                                 2
Real Estate Analysis ................................................................................................................................................................................................................................... 32
        Methodology ...................................................................................................................................................................................................................................... 32

        Industrial Inventory Trends ............................................................................................................................................................................................................... 33

        Key takeaways .................................................................................................................................................................................................................................. 40

Conclusion and Recommendations ........................................................................................................................................................................................................... 40
        Conclusion............................................................................................................................................................................................................................................ 40

        Recommendations for Municipal Stakeholders: Planners, Planning Boards, Economic Development Committees, & more .......................................... 41

        Recommendations for Regional Efforts: Regional Planning Agencies, Workforce Investment Boards, Metropolitan Planning Organizations,
        Regional and State Economic Development Agencies, & more................................................................................................................................................ 42

References .................................................................................................................................................................................................................................................... 44
Appendices .................................................................................................................................................................................................................................................. 47
        Appendix A – Examples of Light Industrial Space Use in U.S. Cities...................................................................................................................................... 47

        Appendix B – PDR Codes with Descriptions ................................................................................................................................................................................. 48

        Appendix C – Massachusetts Community Types ......................................................................................................................................................................... 50

        Table 6 Massachusetts Community Types Summary Description.............................................................................................................................................. 50

        Appendix D – Industrial Land Inventory Across MAPC subregions ......................................................................................................................................... 53

        Appendix E – Industrial Land Inventory by Zip Codes .............................................................................................................................................................. 54

        Appendix F – Median Industrial Rents Across MAPC Subregions............................................................................................................................................ 57

        Appendix G – Industrial Land Vacancy Rates ............................................................................................................................................................................ 59

        Appendix H – Annual Industrial Inventory Change 2011-2020 ............................................................................................................................................. 60

                                                                                                                                                                                                                                                               3
Acknowledgments
Research Authors
   •      Sukanya Sharma, Regional Land Use Planner II (former)
   •      Josh Eichen, Senior Planner (former)
   •      Jessie Partridge Guerrero, Research Manager
   •      Tim Reardon, Data Services Director
   •      Aseem Deodhar, Research Analyst I (former)

Editors

   •      Camille Jonlin, Economic Development Planner II
   •      Raul Gonzalez, Senior Economic Development Planner

Event Planning and Communications

   •      Sasha Parodi, Events and Special Projects Specialist
   •      Amanda Belles, Digital Media and Marketing Specialist
   •      Tim Viall, Senior Communications Specialist
   •      Ellyn Morgan, Visual Designer
   •      Eric Hove, Director of Strategic Initiatives

Advisors

   •      Travis Pollack, AICP, Senior Transportation Planner
   •      Alison Felix, AICP, Principal Planner and Emerging Technologies Specialist
   •      Chris Kuschel, AICP, Land Use Specialists' Manager and Principal Planner
   •      Betsy Cowan Neptune, Chief of Economic Development (former)
   •      Angela Brown, Chief of Economic Development
   •      Mark Racicot, Land Use Planning Director

External Partners

   •      Sandy Johnston, Senior Transportation Planner, Central Transportation Planning Staff (CTPS)
   •      Uday Schultz, Intern, Central Transportation Planning Staff (CTPS)

                                                                                                        4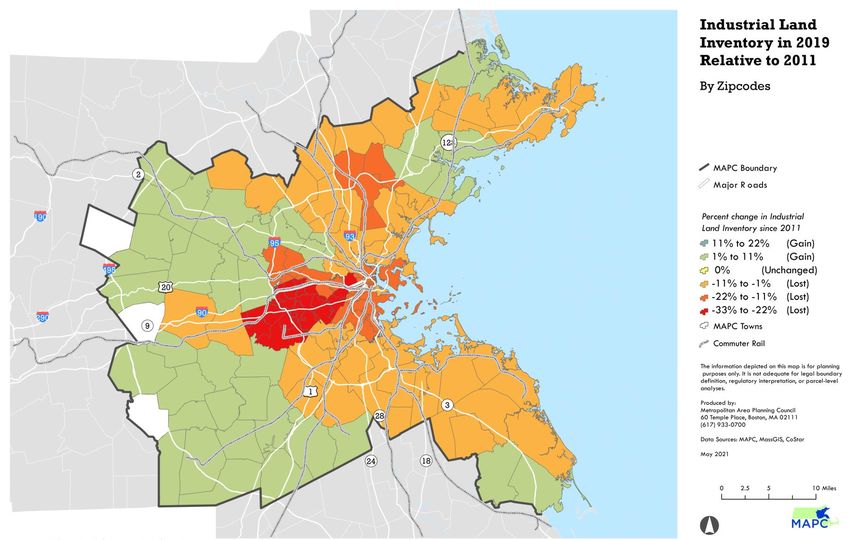
Executive Summary
Why this research?
Industrial jobs are important for regional economic development, wage equity, and economic resilience and innovation
Revitalization of American industry is nationally acknowledged as critical to the country’s economic strength, building a middle class,
and equalizing wage disparities.1 Economic studies2 tie healthy manufacturing employment and ecosystems to greater economic
resilience and innovation, which is of particular importance to the Boston region given its diversity of manufacturing firms, ranging from
consumer-facing products like food and furniture to construction products. Production of medical devices,3 pharmaceutical/therapeutics,4
and aerospace and defense equipment5 are also key regional economic drivers. The COVID-19 pandemic has caused ongoing supply
chain disruption and accelerated preexisting shifts in industrial business operations and workforce needs. Workforce shortages and
misperceptions of manufacturing jobs continue to compound the challenges industrial sectors face today.6
This study of industrial land use in the Boston region provides insight into the issues faced by greater Boston’s industrial businesses and
workforce. Manufacturing and other industrial jobs have been a traditional method of gaining a foothold in the American economy over
the course of the country’s history, and inclusive economic development is closely linked to these industries.7 We define industrial
businesses as those involving production, distribution, and repair activities, which include construction, manufacturing, wholesale trade,
transportation, and warehousing. Real estate pressures, namely that of converting land to its “highest and best use,” often result in
conversion of industrial land to uses such as commercial or residential for financial benefit. As described in the Land Use Analysis of this
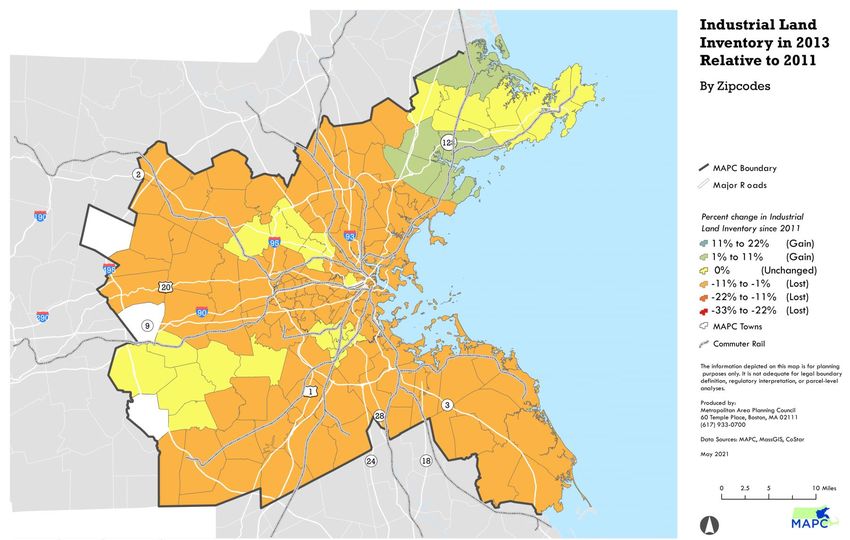
report, greater Boston has experienced measurable losses of industrial land over the last decade. In 2021, there were 30,600 acres of
existing industrial land, accounting for approximately 3.3% of the total developable8 land in the region, but the region lost 10.9 million
square feet of built industrial space between 2011 and 2021. Nearly 75% of this loss occurred in the Metropolitan Area Planning
Council’s Inner Core,9 which boasts the highest land values in the region.
Challenge
1 Stettner, A. & Williams, R. C. (2021) Industry and Inclusion: A Blueprint for Action. The Century Foundation. Retrieved from 12/20/22 at https://tcf.org/content/report/industry-inclusion-blueprint-action/
2 Scott, R. E. (2015). The Manufacturing Footprint and the Importance of U.S. Manufacturing Jobs. Economic Policy Institute. Retrieved from https://www.epi.org/publication/the-manufacturing-footprint-and-the-importance-of-u-s-manufacturing-jobs/
3 LQ of 1.94, BLS QCEW 2021
4 LQ of 1.6 BLS QCEW 2021
5 LQ of 1.16 BLS QCEW 2021
6 Wellener, P., Reyes, V., Moutray, C., & Hardin, K. (2022). Competing for talent: Recasting perceptions of manufacturing. Deloitte Insights. Retrieved from https://www2.deloitte.com/us/en/insights/industry/manufacturing/competing-for-
manufacturing-talent.html
7 Stettner, A. & Williams, R. C. (2021) Industry and Inclusion: A Blueprint for Action. The Century Foundation. Retrieved from 12/20/22 at https://tcf.org/content/report/industry-inclusion-blueprint-action/
8 Represents total land area within the MAPC region except area under water bodies, permanently protected land area, and land under roadways.
9 https://www.mapc.org/get-involved/subregions/icc/
5
Industrial land, and thus industrial businesses and jobs, are facing external and internal pressures

While industrial space in greater Boston declined 3.5% over the past ten years, the utilization of remaining space increased by 6.5
percentage points over that same period, from 89% to 96% – in other words, there is more industrial space in use in 2021 than there
was in 2011. Industrial space that sat vacant in 2011 (approximately 36 million square feet, or 11% of regional inventory10) provided
a cushion to allow for industrial sector growth. Despite this cushion, rents grew by 34 - 41% (adjusted to 2021 dollars), indicating
strong demand and willingness to pay by industrial users. Now, regional industrial vacancy rates have decreased significantly (to 4.4%)
and there is no more cushion for additional loss. Any increase in demand or continued loss of industrial space not compensated for by
new construction will continue to drive rent increases, threatening the survival of industrial firms throughout the region.
If the regional industrial base continues to deteriorate due to real estate absorption and loss, long term damage to the Boston region’s
economic strength and resilience may occur. As industrial market rents are driven upward, many businesses, particularly smaller firms
without a corporate support system, may be priced out of the areas where their presence is needed to maintain a diverse job market
with the relatively high wages that industrial jobs provide. Compared to industrial sector wages, the median annual earnings for
workers without a college degree in non-industrial sectors, like food service and retail, is $12,000 to $22,000 less per annum. As these
high-paying businesses move out of the population-dense Inner Core, workers may experience longer commute times or be unable to
access industrial jobs at all due to a lack of consistent public transportation options.

Environment and Equity
Industrial displacement exacerbates environmental pressures and racial wealth gaps
Declining industrial inventory can contribute to regional labor market imbalances, harmful environmental impacts, and inequity. As
industrial businesses are outpriced and move out from the core, it becomes more difficult to hire and retain workers. The mismatch
between job centers and public transit access leads to more workers undertaking long-distance, single occupancy car commutes11,
worsening traffic conditions and increasing emissions. Industrial outmigration likely also increases truck travel, stressing the region’s
transportation infrastructure, harming air quality and public safety, and increasing congestion. The equity implications of the decline are
shown in the disproportionate impact that workers of color and workers without college degrees experience due to loss of well-paying
industrial jobs, thereby exacerbating racial and economic segregation in the region.
The decline of manufacturing employment opportunities has had devastating effects on Black, Hispanic, and other workers of color due
to the lower-wage options available to workers without college degrees in non-industrial sectors.12 The comparatively high pay, good

10 CoStar
11 Reverse Commute Areas Analysis, Boston Region Metropolitan Planning Organization (2019), accessed at: https://www.bostonmpo.org/reverse-commute-areas-analysis
12 Scott, R. E., Wilson, V., Jori, K., & Perez, D. (2022). Botched policy responses to globalization have decimated manufacturing employment with often overlooked costs for black, Brown, and other workers of color: Investing in infrastructure and
rebalancing trade can create good jobs for all. Economic Policy Institute. Retrieved from https://www.epi.org/publication/botched-policy-responses-to-globalization/

                                                                                                                                                                                                                                                         6
benefits, and unionization opportunities that industrial jobs offer are available to workers from backgrounds where a college education
or English language proficiency were not accessible. Workers without a college degree or English language proficiency in the Boston
region are disproportionately represented by Black, Hispanic, and other workers of color.
The Boston region has a notable racial wealth gap; the Federal Reserve Bank of Boston’s 2015 “The Color of Wealth in Boston”
report13 found that the net worth of the median Black household in the region is $8, while the median White household wealth is
$247,500. Workers of color comprise 28% of the industrial workforce, which is higher than most major industries in greater Boston.
While wages are higher in industrial occupations, racial wage gaps remain large, even among workers without a college degree.
However, the core non-managerial, non-engineering industrial occupations - namely, physical production activities - show a smaller
racial wage gap. Addressing racial wage gaps experienced by Black, Latinx, and Asian American and Pacific Islander (AAPI)
populations across industries and occupations14 is critical to the Boston region’s economic future.

Opportunity
There is opportunity to rethink the utilization of industrial space and an imperative to retain it

This report was conducted to establish a baseline understanding of the industrial sector in the MAPC region through research and
analysis of industrial land use trends, how industrial occupations compare to occupations in other sectors with similar educational and
English language requirements, and how industrial land use has changed in the Boston region over the past ten years. It is the first
attempt by MAPC to provide an overview of the region’s industrial sector. It should be used as a foundation for additional research
and inquiry that can support local and state decision making.
The “key takeaways” summaries at the end of each section of this report highlight the economic impacts of industrial displacement for
the consideration of policymakers, economic development stakeholders, developers, and others. Combined with rapidly increasing
housing prices, the loss of accessible and family-sustaining jobs provided by industrial businesses has the potential to exacerbate
resident displacement and racial wealth gaps already experienced in the Boston metropolitan area.

Recommendations
To begin building policies and programs that mitigate the loss of industrial real estate in the region, MAPC recommends taking
the following actions, further outlined in the recommendations section of this report:

             •      Forecast industrial real estate needs to maintain a strong industrial sector and equitable and accessible jobs in the region.
             •      Incentivize industrial retention through creative zoning and financial incentives.
             •      Build intentional transportation networks that connect industrial businesses to needed labor.

13 Muñoz, A.P.; Kim, M.; Chang, M.; Jackson, R. O.; Hamilton, D.; & Darity Jr., W. A. (2015). The Color of Wealth in Boston. Federal Reserve Bank of Boston. Retrieved from https://www.bostonfed.org/publications/one-time-pubs/color-of-wealth.aspx
14 MAPC Comprehensive Economic Development Strategy, January 2021

                                                                                                                                                                                                                                                   7
Note on COVID-19
COVID-19 continues to upend the economy and real estate market in the region. This research is conducted within the context of
ongoing shifts in the industrial landscape – particularly in the warehousing, transportation, and logistics sectors. We acknowledge the
existing trends of land consolidation by global logistics firms that command the warehouse market, pricing out smaller operators and
other types of industrial businesses, and the potential impact this can have on job quality, business diversity, and supply chain
development within the MAPC region. While the long-term effects of COVID-19 on production, delivery, commuting, and shopping
remain unknown, these macro trends are likely to continue and must be addressed irrespective of the pandemic’s long-term impacts.

Note on Adjacent Study
MAPC also worked with the Town of Stoughton through its Campanelli Rezoning Study & Recommended I-2 Zoning Bylaw Text, Policy &
Map Amendments report of January 2022. Some of the findings from the MAPC-led section of the Campanelli rezoning report will be
incorporated throughout this study.

                                                                                                                                          8
Introduction

Why Industrial?
Over the past ten years, the Boston regional economy has thrived. The Gross Regional Product has risen significantly,15 driven by key
industries such as healthcare, technology, finance, life sciences, and professional and technical services. Despite these strengths, a more
in-depth analysis reveals that the region’s growing economy worked well for some, but not for others. A majority of jobs within these
growth sectors require high levels of education as a prerequisite for employment, which poses a significant barrier to many of the
region's residents. Residents without a college degree earn significantly less than those with a degree, a trend that plays out along
racial lines as well, with Black, Latinx, and Asian American and Pacific Islander (AAPI) workers earning less than White workers in
similar industries and occupations.16
While many organizations, researchers, elected officials, and civil servants have worked tirelessly to develop and deploy funding,
programs, and policies designed to ameliorate these inequities, the Boston region continues to be a stark example of a binary low
wage/high wage economy and racial wealth divide.17 One of the reasons for this polarized job market is the loss of middle-wage jobs
that are accessible to individuals without higher education or English language skills; jobs that are frequently found in the industrial
sector.18 Manufacturing jobs have been a traditional method of gaining a foothold in the American economy over the course of the
country’s history, and inclusive economic development is closely linked to manufacturing. Communities of color have depended on
manufacturing jobs as a pathway to the middle class, particularly during the Great Migration northward during the first half of the
twentieth century. Deindustrialization in the latter half of the twentieth century hurt urban Black and Latinx communities the hardest, and
today, U.S. manufacturing workers are 67% White non-Hispanic.19
Revitalizing American industry is nationally recognized as critical to the country’s economic recovery and long-term prosperity,20 but
policymakers at the state and local levels frequently misunderstand or undervalue the role that manufacturing or other industrial
activities play within their local economies. Tropes regarding “underutilized real estate” or “an already dying sector” have led to policy
decisions that may be contributing to the ongoing deterioration of these sectors in the places where they are needed most – urban
areas with high concentrations of non-college-educated workers. This occurs while the average national wage premium for

15 Boston Indicators, U.S. Bureau of Economic Analysis, Federal Reserve Economic Data, & Federal Reserve Bank of St. Louis.
16 MAPC Comprehensive Economic Development Strategy, January 2021
17 Muñoz, A.P.; Kim, M.; Chang, M.; Jackson, R. O.; Hamilton, D.; & Darity Jr., W. A. (2015). The Color of Wealth in Boston. Federal Reserve Bank of Boston. Retrieved from https://www.bostonfed.org/publications/one-time-pubs/color-of-wealth.aspx
18 Adult Workers with Low Measured Skills: A 2016 Update (2016). U.S. Department of Education Office of Career, Technical and Adult Education.
19 Stettner, A. & Williams, R. C. (2021) Industry and Inclusion: A Blueprint for Action. The Century Foundation. Retrieved from 12/20/22 at https://tcf.org/content/report/industry-inclusion-blueprint-action/
20 The Biden Plan to Ensure the Future is “Made in All of America” by All of America’s Workers. Biden Harris Democrats. Retrieved from https://joebiden.com/made-in-america/

                                                                                                                                                                                                                                                   9
manufacturing workers without a college degree was 10.9% in 2012-2013 (with variation depending on the industry and location)
compared to nonmanufacturing industries.21
The preservation of industrial land should be accompanied by equitable expansion of access to jobs in the sector. The industrial sector is
experiencing significant labor shortages, with 2.1 million unfilled manufacturing jobs expected by 2030;22 the National Association of
Manufacturers shows that “attracting and retaining a quality workforce” is the top issue manufacturing employers experience today.23
Partial solutions cited by the 2021 Deloitte and The Manufacturing Institute Manufacturing Talent study24 include automation – which
has already begun to drastically redefine the industry – and efforts to promote a more equitable and inclusive work environment for
the manufacturing workforce. This, along with the comparatively high wages that manufacturing provides, has clear benefits for workers
of color without college degrees or English language proficiency, and the manufacturing industry benefits by attracting and retaining
workers. This could also benefit the long-term economic health of greater Boston by helping to close the racial wealth gap and
establishing a diverse and stable labor pool. This study shows that greater Boston may pursue this opportunity and further inclusive
economic development by strategically considering industrial land use.

Defining Industrial
The industrial base of the Boston region has undergone dramatic shifts over the past 50 years. These shifts are reflected in industry
trends, including the movement from mass production to just-in-time25 and make-to-order26 modes of production, the limited use of
expensive robotics, the widespread use of inexpensive robotics, transitioning from centralized to distributed logistics systems,
developing more sustainable processes than the former polluting and consumptive production processes, and switching from demand for
lower-skilled, inexpensive labor to a growing need for a more educated and specialized workforce.27 More research is needed to
study the wage implications of these shifts for workers without access to bachelor’s degrees or higher in industrial sectors.
Within that context, it is important to clarify what types of businesses are associated with the “industrial” sector. A review of relevant
literature28 indicates an important shift away from interpreting ‘industrial’ as synonymous with ‘manufacturing’ to account for the diverse
nature of today’s business ecosystem. Instead, the more descriptive categorization of “Production, Distribution, and Repair,” or PDR, has

21 Scott, R. E. (2015). The Manufacturing Footprint and the Importance of U.S. Manufacturing Jobs. Economic Policy Institute. Retrieved from https://www.epi.org/publication/the-manufacturing-footprint-and-the-importance-of-u-s-manufacturing-jobs/
22 Wellener, P.; Reyes, V.; Ashton, H.; & Moutray, C. (2021). Creating Pathways for Tomorrow’s Workforce Today: Beyond Reskilling in Manufacturing. Retrieved from https://www2.deloitte.com/us/en/insights/industry/manufacturing/manufacturing-
industry-diversity.html/#the-growing
23 The National Association of Manufacturers. 2020. “NAM Manufacturers’ Outlook Survey: Fourth quarter 2020". Retrieved from https://www.nam.org/wp-content/uploads/2020/12/NAM-Q4-2020-Manufacturers-Outlook-Survey.pdf
24 Wellener, P.; Reyes, V.; Ashton, H.; & Moutray, C. (2021). Creating Pathways for Tomorrow’s Workforce Today: Beyond Reskilling in Manufacturing. Retrieved from https://www2.deloitte.com/us/en/insights/industry/manufacturing/manufacturing-
industry-diversity.html/#the-growing
25 The just-in-time (JIT) inventory system is a management strategy that aligns raw-material orders from suppliers directly with production schedules. Companies employ this inventory strategy to increase efficiency and decrease waste by receiving
goods only as they need them for the production process, which reduces inventory costs. This method requires producers to forecast demand accurately. Access more information: https://www.investopedia.com/terms/j/jit.asp
26 What Is Make to Order (MTO)? Make to order (MTO), or made to order, is a business production strategy that typically allows consumers to purchase products that are customized to their specifications. It is a manufacturing process in which the
production of an item begins only after a confirmed customer order is received. It is also known as mass customization. Access more information: https://www.investopedia.com/terms/m/make-to-order.asp
27 Lester, T. W.; Kaza, N.; & Kirk, S. (2014). Making Room for Manufacturing: Understanding Industrial Land Conversion in Cities. Journal of the American Planning Association, 79(4), 295-313. DOI: 10.1080/01944363.2014.915369.
28 Dempwolf, C. S.; Leigh, N.G.; Kraft, B. R.; & Hoelzel, N. Z. (2014). Sustainable Urban Industrial Development. American Planning Association, Volume 577 of Pas Report. ISBN 9781611901252.

                                                                                                                                                                                                                                                     10
emerged. The PDR definition reflects a broader scope of business types as defined under the following North American Industry
Classification System (NAICS) codes:
• Construction (23)
• Manufacturing (31-33)
• Wholesale Trade (42)
• Transportation and Warehousing (48-49)
• Repair and Maintenance (811)
For purposes of this report, the term “Industrial” reflects the PDR definition described above.
Real Estate
Industrial businesses, like all businesses, are subject both to local zoning regulations and the market forces that drive availability and
prices of real estate in the region. Industrial operators are in some ways more reliant on real estate than other types of businesses due
to the physical nature of their work and the need for storage and specialized equipment. However, our research shows that these
spaces have become increasingly difficult to find due to significant contraction of the Boston region's industrial real estate supply.
Nearly 10 million net square feet of built space (3.5% of total regional inventory) has been lost over the past 10 years. The City of
Boston itself has rezoned many industrial areas in favor of developers attracting businesses in the information and technology sector, or
housing developers providing market rate and affordable housing.29 Displaced industrial businesses in Boston might struggle to find new
space as other regional municipalities become similarly amenable to the rezoning of industrial areas. Opportunities for increased tax
revenues or accommodation of the region’s dire need for housing are an enticing replacement; the land value of housing can be
significantly higher than industrial uses.
As industrial displacement unfolded over the last decade, there has been a lack of research on how and where changes in the region's
industrial real estate have occurred. Nearly two decades have passed since the last concerted effort30 to quantify the landscape of
industrial land use, jobs, and businesses in the MAPC region.
This lack of research has left many advocates, elected officials, and regulating agencies without a clear picture of how this issue may
impact the regional economy and access to well-paying jobs among workers without access to higher education or English language
proficiency.
29 Logan, T. (2015). Soaring rents squeezing Boston-based industrial firms. Boston Globe. Retrieved from https://www.bostonglobe.com/business/2015/09/22/industrial-companies-feel-squeeze-hot-boston-real-estate-
market/5sIRyJleIGUfRJkxtlB9MP/story.html
30 City of Boston & Boston Redevelopment Authority (2002). Boston’s Industrial Spaces: Industrial Land and Building Spaces in Boston and its Neighborhoods. Retrieved from https://www.bostonplans.org/getattachment/b66a1c8d-739b-42bd-b99f-
039ec4e55f84
11Report Goals
As a regional planning agency, MAPC has a unique position to play in filling this gap and advancing strategies that will result in
deliberate discussions on industrial land use. As the Boston region struggles to supply enough housing at affordable levels to
accommodate a diversity of household sizes and incomes, we highlight the need for a parallel conversation regarding improvement of
regional job opportunities and wages – particularly among populations without access to higher education or English language
proficiency.
The following analysis of industrial land use trends within the MAPC region is the start of what we hope will become an ongoing effort
by state and local actors to integrate industrial land use policy and planning into economic development, housing, and transportation
initiatives. The goal of this report is to provide baseline information on industrial real estate and the industrial workforce as a resource
for municipal planners, planning and zoning board members, housing planners, transportation planners, real estate developers, and
business support organizations. The research presented and recommendations offered are not exhaustive, and there are many further
lines of inquiry that should be explored in subsequent studies.
The principal questions this report investigates are the following:
• What are the key trends of industrial land use in greater Boston?
• How do industrial occupations compare to occupations in sectors with comparable educational and English language
requirements?
• How has industrial land use changed in the Boston region over the past ten years?
Literature Review
Key Themes
A brief literature review provided us a baseline understanding of industrial land use and its connection to well-paying and accessible
jobs. The review sets parameters around business types, occupations, and land use types to include in subsequent analysis. Key themes
from the literature regarding best practices for industrial land management for regional and local economic development stakeholders
are identified below.
“Highest and best” may not be the best: A common rationale for the conversion of industrial land to non-industrial uses is that
land should reflect its “highest and best,” or highest value, land use.31 Therefore, an industrial district in a growing part of a city
31 Chapple, K. (2014). The Highest and Best Use? Urban Industrial Land and Job Creation. Economic Development Quarterly, 28(4), 300-313. doi: 10.1177/0891242413517134
12should be converted to non-industrial if developers are willing to outbid existing industrial users for the land. This argument is
generally supported on efficiency grounds, but it runs a high risk of devaluing the role of industrial use in greater urban and
regional economic development and wage equity. This issue is exacerbated in hot market areas where commercial and housing
land values outstrip industrial value.
Large logistics firms restrict options for other industrial businesses: High demand for industrial real estate, particularly in
urban centers, partially stems from growth in warehouse and distribution centers. Consumer demand for e-commerce has
resulted in an increase of large logistics firms and a resulting displacement of smaller logistics firms or other industrial users in
urban areas. A recent MAPC regional report32 on e-commerce trends shows that in the city of Boston alone, warehouse rents
increased 42% over the last two years. The pressure experienced by e-commerce companies to maintain dependable and fast
delivery times has resulted in small warehouse and distribution centers locating closer to consumers, a trend that shows no sign of
changing.33 This may accelerate the existing trend of land consolidation by global logistics firms that command the warehouse
market, pricing out smaller operators and other types of industrial businesses. This in turn may impact job quality, business
diversity, and supply chain development within the MAPC region and the broader Northeastern U.S.
Space requirements lead to supply & demand mismatch: A report34 from the Urban Manufacturing Alliance on spatial needs
of the manufacturing industry provides insight into the lack of affordable production space at the right size. Access to production
space is a challenge across the U.S. Baltimore, Cincinnati, Detroit, and Milwaukee are all home to ample vacant industrial space,
but small firms are unable to afford subdivision and rehabilitation costs. Portland and Philadelphia, on the other hand, see low
vacancy rates for production spaces, but high demand causes similar unaffordability for small firms. Proximity to workforce,
suppliers, transportation, and consumers all remain a challenge for industrial users as they are forced to locate further from the
inner core of American cities. The report recommends conducting a thorough market study to help cities and developers quantify
industrial needs and determine where to create small, move-in-ready spaces on spec.35
Good jobs are hard to find when industry leaves town: Manufacturing job losses associated with globalization have
significantly impacted the U.S. workforce and people of color in particular. The growing trade deficit with China has been a
major contributing factor; between 2001 and 2011, this trade deficit caused the U.S. to lose 958,800 jobs held by workers of
32 Felix, A. and Pollack, T. (2021). Hidden and in Plain Sight: Impacts of E-Commerce in Massachusetts. Metropolitan Area Planning Council MetroCommon 2050. Retrieved from https://www.mapc.org/wp-content/uploads/2021/02/Feb2021-
Ecommerce-Report.pdf
33 Matthews, W. & Dawson, S. (2014). The Shed of the Future: E-commerce: Its Impact on Warehouses. Deloitte Real Estate. Retrieved from https://www2.deloitte.com/content/dam/Deloitte/ch/Documents/consumer-business/ch-en-cb-deloitte-the-
shed-of-the-future.pdf
34 Foggin, M. (2019). The State of Urban Manufacturing National Report. Urban Manufacturing Alliance. Retrieved from https://www.urbanmfg.org/wp-content/uploads/2017/11/SUM-National-Report-Final.pdf
35 Different types of industrial businesses require different sizes of space. Ensuring a diversity of sizes in available real estate is an important element of business retention. As smaller businesses graduate out of startup spaces, their operations are
especially sensitive to the size and readiness of the industrial space they can afford. Additionally, space requirements vary based on the type of industrial activity and its operations. Further research is needed to understand the sizes of industrial
parcels in the region.
13color, about three quarters of which were in manufacturing.36 These job losses in manufacturing forced many workers and job
seekers to shift toward lower-wage jobs in the service sector that offer fewer benefits and fewer unionization opportunities.
A study on employment impacts of neighborhood gentrification on labor markets 37 suggests that gentrification - the "process of
neighborhood-based class changes that involve an influx of middle and upper class residents into urban areas that once housed
low-income or working class populations” - may significantly impact the type of available jobs in certain urban neighborhoods.
Neighborhood gentrification caused employment growth, but restaurant and retail jobs increased significantly while
manufacturing jobs decreased. Workers with low to moderate training either have to forgo relatively high-paying positions in
the manufacturing sector for lower paying ones such as restaurant jobs, or undertake retraining or additional education. Wage
gap analyses undertaken in various studies show that industrial employment provides higher pay for workers lacking advanced
degrees than other sectors. The region is currently experiencing a middle-skill jobs squeeze, as well as exploitatively low wages
for workers without a college degree; the higher quality and better paying jobs found in the industrial sector could provide a
path forward. Additionally, economic development and regional studies38 tie healthy manufacturing employment and
ecosystems to greater regional economic resilience and innovation.
A 2015 report from the Economics and Statistics Administration39 using data from 10 federal data sources found that
manufacturing jobs maintain a paid premium over four equivalent jobs in the rest of the private sector. When considering
weekly wages over the course of the year, the size of pay premium may be up to 32% depending on the definition of worker
and job type, but a premium persists across all combinations.
Another report40 found that 62% of workers without higher education degrees work within the non-industrial sectors of retail,
hospitality, and food service, or industrial sectors of repair, transportation and warehousing, wholesale trade, manufacturing,
and construction. We will compare these sectors throughout the report. For policymakers and researchers concerned about
income inequality and access to greater benefits, manufacturing sector jobs provide a unique opportunity for workers and the
regional economy.
Smaller industrial firms thrive in urban environments: A Brookings report41 on urban manufacturing highlights the benefits
that smaller manufacturing firms find by locating in dense urban spaces, including proximity to customers, suppliers, and the
36 Scott, R. E., Wilson, V., Jori, K., & Perez, D. (2022). Botched policy responses to globalization have decimated manufacturing employment with often overlooked costs for black, Brown, and other workers of color: Investing in infrastructure and
rebalancing trade can create good jobs for all. Economic Policy Institute. Retrieved from https://www.epi.org/publication/botched-policy-responses-to-globalization/
37 Lester, T. W. & Hartley, D. A. (2014). The Long Term Employment Impacts of Gentrification in the 1990s. Regional Science and Urban Economics 45, 80–89. doi:10.1016/j.regsciurbeco.2014.01.003
38 Doussard, M.; Schrock, G.; & Lester, T. W. (2016). Did US regions with manufacturing design generate more production jobs in the 2000s? New evidence on innovation and regional development. Urban Studies 54(13), 3119-3137.
doi:10.1177/0042098016663835
39 Nicholson, J. R. & Powers, R. (2015). The Pay Premium for Manufacturing Workers as Measured by Federal Statistics. Washington DC: US Department of Commerce, Economics and Statistics Administration.
40 Adult Workers with Low Measured Skills: A 2016 Update. (2016). U.S. Department of Education Office of Career, Technical and Adult Education.
41 Byron, J. & Mistry, N. (2011). The Federal Role in Supporting Urban Manufacturing. The Brookings Institution. Retrieved from https://www.brookings.edu/research/the-federal-role-in-supporting-urban-manufacturing/
14large skilled labor markets that metropolitan areas provide. Locating in an urban area provides a competitive advantage to
small businesses. Another study42 within the Greater London region similarly notes that the drop in industrial inventory is
disproportionately experienced by small industrial businesses, including repair and recycling. More research is needed to
understand the extent to which these trends affect the MAPC region.
Case Study – London’s Industrial Land Supply and Economy Study
Changes in industrial real estate are occurring in metropolitan areas across the U.S. and globally. While concerted efforts to manage
the supply of industrial real estate in hot markets like Boston are few and far between, some initiatives underway in other regions could
guide future efforts – one being that of London, United Kingdom.
The Office of the Mayor of London produced the “London Plan,”43 a strategic land-use guide for the greater London region as part of
the city’s master planning efforts. One element of the London Plan is an industrial land use strategy that includes benchmarks for
industrial land release (rezoning) within the region, guided by a thorough analysis of industrial land supply.44 The London Plan also
makes provisions to preserve a sufficient supply of quality sites for industrial use by protecting land from real estate pressures that
might otherwise deplete the needed industrial land supply over time.
The study distinguishes three categories of industrial land for regulatory purposes and proposes benchmarks and policies using these
categories to manage industrial land release:
▪ Strategic Industrial Locations (SIL) are the region’s main reservoirs of industrial land. There are two types of SILs -
preferred industrial locations and industrial business parks. Development proposals within or adjacent to SILs are reviewed
to ensure they don’t compromise the ability of these locations to accommodate industrial-type activities.
▪ Locally Significant Industrial Sites are sites that hold particular local importance for industrial and related functions. These
spaces undergo periodic review (similar to SILs) in order to manage supply and demand of industrial land.
▪ Non-designated industrial land encompasses sites that are industrially zoned but under-utilized or better suited to respond
to other land pressures such as housing developments.
While these site categories provide regulatory guidelines for industrial land management, the London Plan also outlines types of
responses to diminishing industrial land in the greater London region to support development decisions. The following trends are
recognized by periodically conducted land parcel analysis.
1. Intensification – This development response accommodates more activity on a given area of land. This could range from
firms installing mezzanines in an existing site to increasing floor to ceiling heights. Major industrial developers in the London
42 Bosetti, N.; Quarshie, N.; & Whitehead, B. (2002). Making Space: Accommodating London’s industrial future. Center for London. Retrieved from https://www.ealing.gov.uk/download/downloads/id/17383/industrial_land_report.pdf
43 Greater London Authority (2021). The London Plan: The Spatial Development Strategy for Greater London. Retrieved from https://www.london.gov.uk/sites/default/files/the_london_plan_2021.pdf
44 Brooke, R.; Openshaw, G.; Howells, J.; Deshpande, P.; Tindale, J.; & Baldwin, S. (2016). London Industrial Land Supply and Economy Study, 2015. Greater London Authority in association with AECOM. Retrieved from
https://www.london.gov.uk/sites/default/files/industria_land_supply_and_economy2015.pdf
15area are now even considering building multi-story warehouses. In North America, vertical industrial buildings are being
developed, with notable new projects in Vancouver, Seattle, San Francisco, and New York45 – areas facing some of the
highest levels of land pressure. Further research is needed to identify space needs of various industrial sub-sectors and the
flexibility of existing industrial inventory to accommodate those needs.
2. Substitution – This operational response appears when firms revise their business models in response to the change in cost
and supply of industrial land. Some firms that wish to continue to serve the London market but cannot afford the high cost of
real estate may choose to move outside of the City’s boundaries to more affordable areas. There is greater scope for
widespread adoption of spatial substitution among logistics operators, but this depends on available land.
3. Co-location – This planning response explores mixed industrial and residential development given that much of the pressure
on industrial land comes from residential development. Historically, the market has proven skeptical about such development,
but as land pressures intensify and industries become quieter and cleaner, innovative solutions are underway. A critical
aspect of these designs is separate vehicular access so that the residential uses do not come into conflict with commercial
traffic. As work and workstyles continue to evolve, there may be more opportunities to integrate work and living.
Previous studies in the Boston Region
The most recent industrial land use study in the Boston region is Boston’s 2002 “Back Streets” program,46 which exclusively studied the
City of Boston and its neighborhoods. The study aimed to preserve and promote the growth of eight established industrial areas by
assessing the comprehensive and strategic use of industrial land, job training, and financial resources in Boston. Conducted by the mayor
and the Boston Redevelopment Authority, the study found that industrial land accounted for 5% (1,565 acres) of Boston’s land area
with a vacancy rate of 2.7%, which totaled 46,000 jobs.
Since the release of Boston’s Back Streets report nearly two decades ago, there has been no concerted effort by any municipality,
regional entity, or state agency to comprehensively quantify the landscape of industrial land use, jobs, and businesses in Eastern
Massachusetts. This report serves as the starting point for what should become ongoing research and analysis, akin to London’s work, as
part of a regional economic development plan.
Key Takeaways
- Inventorying industrial land use is a critical first step to understanding market demand, potential land release and associated
management, and needed preservation.
45 Haag, M. (2022). Warehouses Transform N.Y.C. Neighborhoods as E-Commerce Booms. The New York Times. Retrieved from https://www.nytimes.com/2022/03/16/nyregion/ecommerce-warehouses-nyc.html
46 City of Boston & Boston Redevelopment Authority (2002). Boston’s Industrial Spaces: Industrial Land and Building Spaces in Boston and its Neighborhoods. Retrieved from https://www.bostonplans.org/getattachment/b66a1c8d-739b-42bd-b99f-
039ec4e55f84
16- Research literature suggests that public benefit can result from active planning for and monitoring of industrial land if properly
designed.
- Given the opportunity, the real estate industry will accommodate industrial demand, but it requires clear and consistent
messaging from regulatory entities at local, regional, and state levels.
- The Greater Boston Region has a critical lack of study in this topic area.
Industrial Business and Occupational Analysis
As described in the literature review, existing research acknowledges the wage advantages that the industrial industry offers for
workers with limited educational or English language capacity. Furthermore, research conducted by the Economic Policy Institute
demonstrates that within occupations that have a physical work product and are therefore easier to evaluate objectively, a smaller
wage gap exists between White workers and workers of color.47
The following analysis has been conducted to frame these key concepts within the Boston metro region from both an industry and
occupational perspective.
Methodology
Employment trends presented in this report are broadly divided into two categories – industrial trends and occupational trends. For this
analysis, we compared industrial sectors as defined earlier in this report against Retail Trade and Accommodation & Food Services
sectors. For industry-level employment trends and worker characteristics, we utilized 5-year 2015-19 American Community Survey
Public Use Microdata Sample (ACS PUMS)48 as well as Employment and Wage (ES-202)49 data.
ACS PUMS data were used to generate insights on wage levels in industry sectors, and cross-tabulated by various demographic
variables for the MAPC region. The 5-year data are collected through surveys conducted over 60 consecutive months; raw data are
weighted to represent values based on estimated population and inflation rates. Inflation-adjusted wage levels for workers in
Production, Distribution, & Repair (PDR) industries were cross-tabulated across three major demographic variables: educational
attainment, reported race and ethnicity, and English proficiency. Industry sectors corresponding to PDR were Construction, Repair,
Manufacturing, Wholesale Trade, and Transportation & Warehousing, and were compared to Retail Trade and Accommodation &
Food Services sectors. We primarily focused on cross-tabulations for median annual wages for workers with no or limited English
proficiency, and those with a High School Diploma or less as educational levels for this report.
47 Grodsky, E. & Pager, D. (2001). The Structure of Disadvantage: Individual and Occupational Determinants of the Black-White Wage Gap. American Sociological Review, 66(4), 542-567.
48 PUMS Documentation (2021). U.S. Census Bureau American Community Survey. Retrieved from https://www.census.gov/programs-surveys/acs/microdata/documentation.html
49 Employment and Wage49 (ES-202). Note: Data was extracted for specifically the MAPC region. Retrieved from https://lmi.dua.eol.mass.gov/lmi/CitiesAndTowns
17Similarly, ES-202 data were utilized to generate establishment and employment insights by industry in the MAPC region. ES-202 data
are derived from reports filed by all state and federal employers subject to unemployment compensation laws. Industries are defined
using NAICS codes. We utilized this dataset for longitudinal analysis spanning 2011 to 2019.
Industrial Business Composition
The U.S. Department of Education’s report50 on Adult Workers with Low Measured Skills from 2016 indicates that more than half of U.S.
workers without a college degree work in just six sectors: four industrial sectors and two service and retail sectors. These sectors are
Construction, Manufacturing, Wholesale Trade, or Transportation & Warehousing (all considered industrial) and Retail Trade and
Accommodation & Food Service (retail and service). These six sectors are compared in the charts below.
In line with national trends, the Boston region has exhibited growth in Transportation & Warehousing firms, driven by e-commerce and
global logistics firms like Amazon. In many ways, the rise of Transportation & Warehousing correlates with the simultaneous drop in
retail trade businesses as more shopping has moved online. Wholesale Trade and Manufacturing businesses have experienced
significant decline since 2011, while construction-related businesses grew sharply in the same period. Accommodation & Food Service
establishments increased steadily during this time as well.
50 Adult Workers with Low Measured Skills: A 2016 Update (2016). U.S. Department of Education Office of Career, Technical and Adult Education. Retrieved from
https://www2.ed.gov/about/offices/list/ovae/pi/AdultEd/factsh/adultworkerslowmeasuredskills.pdf
18You can also read