Marel Food Systems - Investor Presentation - November 2009 Theo Hoen, Erik Kaman & - Euroland
←
→
Page content transcription
If your browser does not render page correctly, please read the page content below

Marel Food Systems
  - Investor Presentation -

      November 2009
         Theo Hoen,
        Erik Kaman &
    Sigsteinn Grétarsson
Contents

1) Introduction

2) The Market

3) Marel Food Systems

4) Financials

5) About the Offering

6) Appendix

                        2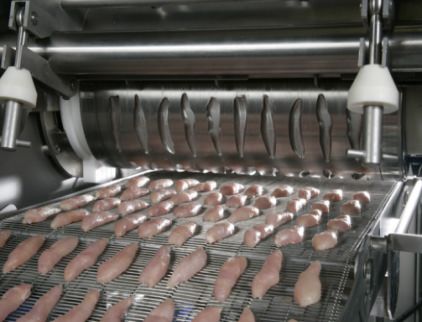
About the Offering

Overview
No. of shares offered:               92,400,000
                                     (the Board of Directors reserves the right to increase the no. of shares offered by up
                                     to 46,200,000 to a total of up to 138,600,000)
Share price range:                   ISK 63 – 65 per share
                                     The final offering price will be determined by the Board at the end of the offer period
Market value of offering:            ISK 6 billion (EUR 32.5 million)
                                     Option to increase the offer size by 50%, to a total value of up to ISK 9 billion (EUR
                                     48.7 million)
Shares offered to:                   Professional investors

Minimum subscription:                ISK 10,000,000

Subscription period:                 26-27 November 2009 (offer period ends at 16:00 on 27 November 2009)

Payment:                             Cash and/or bonds with ticker MARL 06 1 and/or MARL 09 1

Payment due:                         2 December 2009 (bonds to be available before 12:00 noon on 1 December 2009)

Shares admitted to trading:          Expected on 7 December 2009 but no later than 9 December 2009

Managers:                            Arion banki, Íslandsbanki and Landsbankinn

A prospectus issued in connection with the offering will be available on www.marel.com
* 1 EUR = 185 ISK

                                                                                                                               3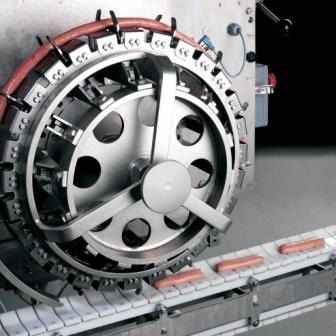
The Management Team

Erik Kaman, CFO                     Theo Hoen, CEO                 Sigsteinn Grétarsson, MD of Marel
• MSc. in Applied Physics           • MSc. in Mechanical           ehf.
• Joined Marel in May 2008            Engineering                  • MSc. in Mechanical Engineering

• Previous position held: Finance   • Joined Stork NV in 1986      • Joined Marel FS in 1997
   Director of Stork Aerospace      • Previous position held:      • Previous position held: Director of
   Industries                         Managing Director of Stork      Business Development Marel
                                      Food Systems since 2006         Food Systems

                                                                                                     4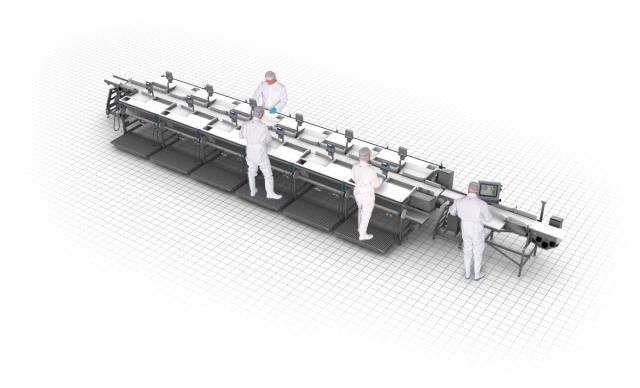
Purpose of the Offering and Use of Proceeds

• The purpose of the equity offering is to strengthen the capital structure of the Company with
  the main objectives being to:
   a) decrease net interest bearing debt
   b) reduce exposure to ISK denominated debt
   c) lower the overall cost of debt
• The equity offering is a key milestone in Marel’s long-term financing strategy
• In order to achieve these objectives the Board of Directors has decided to offer new shares
  to professional investors.
   • The new shares can be paid for with cash and/or Marel bonds with the tickers MARL 06
        1 and MARL 09 1
   • Net cash proceeds will be used to facilitate a decrease in ISK denominated debt
   • The exchange of bonds for equity will reduce the amount of ISK denominated bonds

                                                                                              5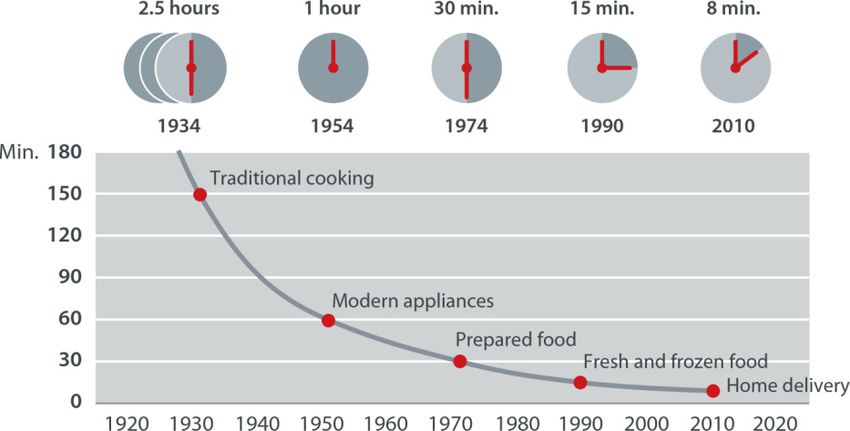
Contents

1) Introduction

2) The Market

3) Marel Food Systems

4) Financials

5) About the Offering

6) Appendix

                        6
Size & Growth of the Market

 •     The market for advanced equipment and                                      Sales of Food Processing Machinery*
                                                                                  EUR million
       systems for the food processing industry is                                 7,000
       highly fragmented                                                           6,000

 •     The estimated market size is EUR 4 billion*                                 5,000

       in annual sales                                                             4,000

                                                                                   3,000
 •     The leading players are:
                                                                                   2,000
       • Marel, CFS, Meyn, JBT FoodTech, Weber                                     1,000
           and Baader                                                                   0

 •     The market has been growing by 5-6%*                                                 1991   1994     1997       2000     2003     2006    2009e    2012e   2015e

       annually for the past two decades                                             Rest of World     Latin America     Asia-Pacific   Europe   Japan    USA & Canada

       • Developed markets are expected to                                        Global Sales to the Poultry, Fish & Meat Processing Industries
           continue to grow by 4%                                                 EUR million
                                                                                  600
       • Emerging markets are expected to grow
           by 6-7% in the years to come                                           500

                                                                                  400

                                                                                  300

                                                                                  200

                                                                                  100

                                                                                    0
                                                                                        Marel      CFS Meyn- JBT Food Weber Baader- Haars- Handt    MPS    SFK Gersten Vemag
                                                                                                     Systemate Tech          Linco   lev mann                   berg

                                                                                    Proforma turnover of Marel Food Systems’ core business in 2008. Turnover of other
*Source: “Food Processing Machinery and Equipment – A Global Strategic Business     companies based on estimates by Marel’s management.
Report”, published in May 2008 by GIA Inc.

                                                                                                                                                                          7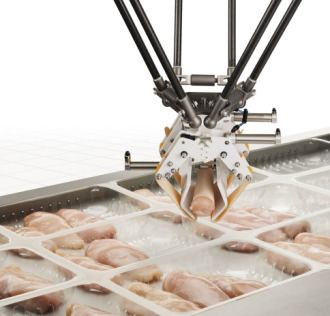
Market Trends & Key Drivers

 • Proteins play an increasingly larger role            Global Production of Beef, Fish, Pork & Poultry                         Change
                                                                                                                               1961-2007
                                                        Millions of tonnes
   in the global diet
                                                        450
                                                                                                                                x9.7
 • Global urbanisation is on the rise                   400
                                                        350                                                      Poultry
   • By 2030 it is estimated* that 2/3 of               300
                                                                                                                                x4.7

       the world population will reside in              250                                                      Pork

       urban areas – up from the current                200
                                                                                                                                x3.9
                                                        150                                                      Fish
       50%                                              100

 • The most efficient protein segments,                  50
                                                                                                                 Meat
                                                                                                                                x2.3
                                                          0
   i.e. chicken are experiencing the most                     1960          1970   1980          1990         2000             Source: FAO

   growth
                                                              Feed efficiency             Grains required per gram of
                                                                                          animal weight gain
                                                              Farmed fish                               1.5

                                                              Chicken                                   2.0
                                                              Pork                                      3.1
                                                              Beef                                      8.3
                                                                                                        Management estimates

*Source: United Nations

                                                                                                                                 8
Market Trends & Key Drivers

•   Changes in eating habits support increased
    investments in food processing equipment
•   Households are increasingly buying ready-made
    meals or eating at fast food outlets
•   Increased demand for hygiene, efficiency and
    traceability is shifting demand for food
    processing equipment towards the more
    sophisticated, high-tech products
•   Technology has revolutionised the poultry
    processing industry
    • 50 years ago, whole birds accounted for 83%
        of the value in the USA market                Poultry Processing Value in USA
    • Today, further processing accounts for 60% of
                                                      100%
        the value in the USA market                    90%
                                                       80%
                                                       70%
                                                       60%
                                                       50%
                                                       40%
                                                       30%
                                                       20%
                                                       10%
                                                       0%
                                                             1960         1970   1980           1990     2000          2010e
                                                             Further processed   Portions/fillets      Whole bird

                                                                                                                    Source: FAO

                                                                                                                                  9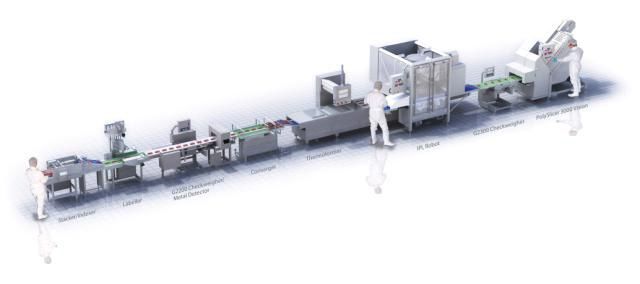
The Value Chain

   Food                                                                           Long-term market growth
processing                                                                        •     Developed markets 4%
equipment                                                                         •     Emerging markets 6-7%

                                                             Retailer
                                Processor                                               Consumer
                                                           Food Service

                           Processors                           Retailers & Consumers
 Suppliers of              • Profitability is determined        • Economic trends
raw material                 by a balance between               • Demographic trends
                             supply and demand,                     • Urbanisation
                             • Price of raw materials               • Convenience
                             • Productivity of the
                                food processing
                                equipment

                                                                                                        10
Contents
1) Introduction
2) The Market
3) Marel Food Systems
4) Financials
5) About the Offering
6) Appendix
11Strategy
• Marel Food Systems provides high-
tech processing equipment designed
€
to meet the current, emerging and
INNOVATION
projected needs of the rapidly OPERATIONAL EXCELLENCE
expanding protein segment of the
food processing industry
• We rely on a simple and proven
strategy
• Knowledge is the foundation of the
company with three key success
factors being:
• Global market presence This puts the spotlight on WHO we serve
• Innovation This puts the spotlight on WHAT we do
• Operational excellence This puts the spotlight on HOW we do it
12Global Market Presence
Worldwide Operations
• Marel has close to 3,600 employees
• We have over 30 sales and service offices
around the world
• Strong presence in all our key markets
• We have over 150 agents representing our
company
• We have over 700 service engineers serving
our customers
• We have around 500 sales representatives
visiting our customers
13Innovation
• Marel has shown that through innovation the company is
capable of improving the profitability of our customers
• Marel invests 5 - 6% of annual revenues in R&D
• Marel employs around 480 R&D specialists and maintains close
relations with leading universities and research institutions INNOVA software
• R&D work is protected by over 170 patents
• During the AMI exhibition in November 2009 Marel launched
17 innovations
Intelligent portioning
QX technology Robot Batching RevoPortioner ValueDrum
14Operational Excellence
Cost control measures
have already resulted in
EUR 25 million in savings
on an annual basis
The working capital
management program
has already generated
EUR 30 million
Economies of scale are
being achieved by using
our manufacturing
capabilities and leverage
in procurement
Internal benchmarking
will give us the
opportunity to improve
our operations
continuously
15Integration Efforts
We are developing
new products that
combine the
technologies that each
company has to offer
We are harvesting
from the economies of
scale by using our
manufacturing The global network of
capacity more subsidiaries and
efficiently offices is being
integrated in order to
present “one face” to
the customer
We are creating a
company that embodies
the values of the “new
Marel”
To emphasise the
integration efforts, our
name will change from
Marel Food Systems to
Marel as of 1 January
2010
16Contents
1) Introduction
2) The Market
3) Marel Food Systems
4) Financials
5) About the Offering
6) Appendix
17Revenues
• Generally, Marel has three revenue streams of
approximately equal size:
1. The sale of larger systems, often for new
factories
• Significant drop in Q4 2008 and Q1
2009
• Postponement rather than
cancellations in most cases
• Demand is therefore building up
2. The sale of standard equipment and smaller
solutions to existing factories
• Limited effect of the financial crisis
3. The sale of spare parts and service
• Not adversely affected by the financial
crisis
• Revenues can furthermore be divided into four
business segments:
• Meat, poultry, fish and further processing
18Core Business
• Year-on-year sales have decreased by around Revenues & Gross Profit Margin
EUR million
25% on a pro forma basis
160 50%
• To combat declining sales due to the global 140 45%
financial crisis Marel has taken measures to 120 40%
100 35%
reduce cost and gross working capital (GWC) 80 30%
• As a result: 60 25%
40 20%
• The cost base has been reduced by EUR 25 20 15%
million on an annual basis 0
Q1 Q2 Q3 Q4 Q1 Q2 Q3
10%
• GWC program has generated EUR 30 million 2008 2009
Revenues
in cash Gross profit margin
• Gross profit margin and EBIT have therefore
improved, despite the decline in sales Revenues & EBIT
EUR million
• Q3 gross profit 40.9% 160 15%
• Q3 EBIT EUR 13 million (11.7%) 140 12%
120 9%
100
6%
80
3%
60
40 0%
20 -3%
0 -6%
Q1 Q2 Q3 Q4 Q1 Q2 Q3
2008 2009
Revenues EBIT EBIT, excl. one-off costs
19Balance Sheet
• Acquisitions in recent years have affected the Consolidated Balance Sheet 9/30/2009 12/31/2008
overall balance sheet Goodwill 392,867 394,979
Other intangibles 87,843 85,459
• Goodwill subject to impairment testing on an Property, plant & equipment 127,178 145,420
Other non-current assets 11,862 8,636
annual basis Inventories & production contracts 108,372 140,109
• Good liquidity position Receivables 88,571 120,255
Other current assets 858 4,364
• Improvement in working capital and reduced Cash & cash equivalents 55,109 21,038
Total assets 872,660 920,259
net-debt compared to year-end 2008
Shareholders´ equity 303,749 288,279
Minority interest 0 0
Total equity 303,749 288,279
Non-current borrowings 366,815 265,807
Other non-current liabilities 31,062 54,467
Balance Sheet & Equity Ratio Payables 126,623 156,203
EUR million Current borrowings 36,253 134,636
Other current liabilities 8,158 20,867
1000 40%
Total liabilities 568,911 631,980
900 38%
800 36% Interest bearing debt 403,068 400,443
700 34%
Less: Cash (55,109) (21,038)
600 32%
500 30% Net interest bearing debt (NIBD) 347,959 379,406
400 28% Net operating working capital 70,320 104,161
300 26%
200 24%
Equity ratio 34.8% 31.3%
100 22% EUR 1,000
0 20%
Q2 Q3 Q4 Q1 Q2 Q3
2008 2009
Balance sheet Thereof net interest bearing debt Equity ratio
20Overview of Liabilities
• Net debt at the end of Q3 2009 was EUR 348 Maturity Profile
million EUR million
250
• Refinancing in 2009 has shifted the maturity
200
profile
150
• New club facility of amounting to EUR 106
million with the support of Arion banki, 100
Íslandsbanki and Landsbankinn 50
• All derivative contracts were closed and a 5- 0
Oct. 2009 - Oct. 2010 - Oct. 2011 - Oct. 2012 - Oct. 2013 - Later
year loan in the amount of EUR 34 million Oct. 2010 Oct. 2011 Oct. 2012 Oct. 2013 Oct. 2014
was negotiated with Glitnir F&D facility Bonds MARL 06 1 Bonds MARL 09 1 Long-term debt
• A new class of bonds with maturity in
November 2011 was issued in the amount of Breakdown of Interest Bearing Debt
3.6 billion ISK, now equivalent to EUR 18.5
million 8%
5%
• Extension of F&D facility until October 2011 Icelandic club loan
facility
34%
• After the refinancing and closing of derivative 11% European banks
contracts, the ISK exposure is equivalent to EUR F&D facility
5%
130 million Bonds MARL 06 1
• Consisting of listed bonds and approximately Bonds MARL 09 1
38%
2/3 of Icelandic club loan facility
21Financial Position After the Offering
Decreased net debt Reduced ISK exposure Lower cost of debt
• Overall strengthening of the • Marel has both operational and • Decreased exposure to high
capital structure balance sheet exposure to the ISK interest bearing ISK funding
• Business better positioned with • Operational exposure will • Reduction in interest cost
respect to refinancing remain unchanged (approx. proportionately higher than
1% of revenues in ISK and 6%
• Subsequent to the issuance of of costs) reduction in debt
new shares, net interest bearing • Balance sheet exposure will • Lower interest costs will improve
debt will be reduced to 4.3x decrease to approximately cash flow, which will lead to
EBITDA* EUR 100 million further reduction of net interest
• Net debt post offering • Marel is actively seeking to bearing debt
approximately EUR 315 reduce remaining ISK exposure on
million** club loan facility (approx. 2/3 of
Icelandic club loan facility)
*Pro forma core business EBITDA for 2008
** Assuming a 15% increase of share capital at midrange offer price
22Sum-up
An Industry Leader Progress on Integration
The merger with Stork Food Systems elevates Marel to the Focus on integration and portfolio realignment
number 1 spot in advanced equipment and systems for the food
processing industry Synergies to be captured through harmonisation of procurement,
production and sales & market activities
Broad customer base and continuous focus on innovation
Sale of non-core assets
Global network enables Marel to service multinationals that
increasingly tap into high-growth emerging markets Organic Growth Opportunities
Further operational improvements
Changes in Consumer Habits Fuel Growth
Socio-demographic trends and changes in values have an impact Emphasis on organic growth and integration
on eating habits Strenghtened presence in emerging markets
Consumer trends towards greater convenience and healthier
diets Tough Market Environment
Packaging becoming more convenience oriented: single-serve Reduced consumer buying power (recession, inflation risk)
packs and individually wrapped portions Economic downturns postponing orders for larger systems
Food processors increasingly focused on product innovations / Challenging capital and credit market conditions
marketing
Good Long-Term Prospects
Financial Performance and Position
Market activity is expected to remain at the current level or to
Despite lower sales, margins are maintained at a healthy level
slightly improve in coming months
Leverage is decreasing The year 2010 is expected to have a better start than 2009
Exposure to the ISK Operational results will improve in accordance with market
Strong cash-flow developments, supported by the continued focus on cost control
23Contents
1) Introduction
2) The Market
3) Marel Food Systems
4) Financials
5) About the Offering
6) Appendix
24About the Offering
Overview
No. of shares offered: 92,400,000
(the Board of Directors reserves the right to increase the no. of shares offered by up
to 46,200,000 to a total of up to 138,600,000)
Share price range: ISK 63 – 65 per share
The final offering price will be determined by the Board at the end of the offer period
Market value of offering: ISK 5.8 - 6.0 billion (EUR 31.5 - 32.5 million)
Option to increase offer size by up to 50%, to a total value of ISK 8.7 - 9.0 billion (EUR
47.2 - 48.7 million)
Shares offered to: Professional investors
Minimum subscription: ISK 10,000,000
Subscription period: 26 - 27 November 2009 (offer period ends at 16:00 on 27 November 2009)
Payment: Cash and/or bonds with ticker MARL 06 1 and/or MARL 09 1
The value of a bond includes principal, accrued interest and inflation indexation where
applicable at 27 November 2009 in accordance with its terms
MARL 06 1: Value of ISK 14,396,504 per ISK 10,000,000 nominal value
MARL 09 1: Value of ISK 1,008,993 per ISK 1,000,000 nominal value
Payment due: 2 December 2009
Bonds to be submitted to a VS-accounts in the name of the Subscriber at one of the
Arrangers before 12:00 noon on 1 December 2009
Shares admitted to trading: Expected on 7 December but no later than 9 December 2009
A prospectus, issued in connection with the offering, will be available on www.marel.com
* 1 EUR = 185 ISK
25About the Offering - Subscriptions & Allocation
Subscriptions: Can only be submitted on a completed Subscription form, provided by the
Arrangers. To the addresses below or as a scanned version via e-mail.
Landsbankinn Corporate Finance, Hafnarstræti 5, 155 Reykjavík,
fyrirtaekjaradgjof@landsbankinn.is
Arion banki Corporate Advisory, Borgartúni 19, 105 Reykjavík,
utbod@arionbanki.is
Islandsbanki Corporate Finance, Kirkjusandi, 105 Reykjavík,
marelutbod2009@islandsbanki.is
Subscriptons in the share offering are legally binding and cannot be withdrawn
by the subscriber. Multiple subscriptions are admitted in the share offering
Allocation: Marel Food System’s Board of Directors will decide the allocation following the
expiration of the offer period.
The Board of Directors reserves the right to increase the offering by 50%, to ISK
9 bn. The Board of Directors reserves the right to reject subscriptions in full or
in part without justification. When allocating shares to subscribers the Board
of Directors will take into account the policy of Marel Food Systems of
attracting international investors as well as encouraging distributed ownership
of its shares.
26About the Offering - Marel Shares
Share Price Developments in ISK & EUR
140 1,40
Share price, ISK
120 1,20
Share price, EUR
100 1,00
80 0,80
60 0,60
40 0,40
20 0,20
0 0,00
okt./00 júl./01 apr./02 jan./03 okt./03 júl./04 apr./05 jan./06 okt./06 júl./07 apr./08 jan./09 okt./09
Share Price Developments Marel vs. Peer Group
300
250
200
150
100
50
0
Jan/07 May/07 Sep/07 Jan/08 May/08 Sep/08 Jan/09 May/09 Sep/09
27Peer Group Comparison
Company Country Ticker Last Price changes Market est P/E est P/E EV/EBITDA est EV/EBITDA est EV/EBITDA EV/EBIT est EV/EBIT est EV/EBIT
Price** 1Y YTD Cap €m CurrYr NextYr T12M CurrYr NextYr T12M CurrYr NextYr
ABB Swi tzerl . ABBN VX 19.0 60% 24% 29,099 15.2 17.3 8.6 8.2 9.2 10.0 9.5 11.0
Al fa La va l Sweden ALFA SS 92 87% 39% 3,752 13.5 16.6 7.8 8.5 10.0 9.0 9.9 11.6
Bucher Indus tri esSwi tzerl . BUCN SW 109.4 25% 11% 764 41.9 15.5 5.6 9.3 8.0 7.6 43.9 13.8
GEA Group Germa ny G1A GR 14.5 52% 25% 2,670 16.5 15.1 6.7 7.6 7.0 8.7 10.3 9.1
Ind. Ma cch. Autom.Ita l y IMA IM 12.2 -1% 1% 415 10.7 10.4
Kl öckner Werke Germa ny KLK GR 14.3 -18% -17% 771 112.0
Krones AG Germa ny KRN GR 34.7 25% 13% 1,096 25.5 13.0 31.4 8.6 57.8 16.5
Key Technol ogy USA KTEC US 12.1 12% -35% 41 60.5 26.9 7.8 9.7 22.0
Wi npa k Ca nada WPK CN 8.0 21% 9% 327 11.9 12.9 5.1 5.1 5.4 7.1
Crown Hol di ngs USA CCK US 25.8 69% 34% 2,785 13.0 11.3 7.2 7.3 6.9 8.9 9.0 8.4
FMC Technol ogi esUSA FTI US 54.4 127% 133% 4,474 19.1 21.9 13.8 10.7 12.3 12.8 15.7
Mi ddl eby Corp USA MIDD US 46.2 63% 71% 577 13.9 12.4 9.0 8.6 8.0 10.1 9.4 8.3
Mettl er-Tol edo USA MTD US 99.3 49% 48% 2,255 18.3 16.3 11.3 11.0 10.4 12.9 12.6 11.6
Sea l ed Ai r USA SEE US 22.2 62% 52% 2,373 15.4 13.6 6.8 6.7 6.3 9.2 9.1 8.3
Andri tz Aus tri a ANDR AV 41.3 147% 131% 2,146 19.6 16.7 6.3 7.1 6.4 8.6 10.1 8.4
John Bea n Tech USA JBT US 17.0 125% 118% 316 15.3 13.9 7.4 7.8 7.4 10.2
Ma ni towoc USA MTW US 10.5 103% 28% 923 29.5 44.1 9.1 9.0 10.2 13.4 14.4 15.8
Ra ti ona l Germa ny RAA GR 113.7 58% 36% 1,293 20.8 19.5 13.6 12.8 15.5 15.0 14.1
Median 59% 31% 1,194 16.0 16.3 7.8 8.6 8.3 9.6 10.3 11.6
Marel* Iceland MARL IR 68.5 -17% -12% 229 18.2 14.7 11.9 11.6 7.8 26.4 21.9 11.2
Source: Bl oomberg, compi l ed by NBI hf.
*IFS es ti ma tes
**Cl os i ng pri ce 20 November 2009
Tra i l i ng 12 month fi gures for Ma rel a re a djus ted for one-off costs
28Peer Group Comparison
Estimated P/E 2010 1 Year Price Changes
MTW US 44.1
KTEC US 26.9 KLK GR -18%
KRN GR 25.5 Marel* -17%
FTI US IMA IM -1%
21.9
KTEC US 12%
RAA GR 19.5 WPK CN 21%
ABBN VX 17.3 BUCN SW 25%
ANDR AV 16.7 KRN GR 25%
ALFA SS 16.6 MTD US 49%
MTD US 16.3 G1A GR 52%
BUCN SW 15.5 RAA GR 58%
G1A GR 15.1 ABBN VX 60%
Marel* 14.7 SEE US 62%
JBT US MIDD US 63%
13.9
CCK US 69%
SEE US 13.6 ALFA SS 87%
WPK CN 12.9 MTW US 103%
MIDD US 12.4 JBT US 125%
CCK US 11.3 FTI US 127%
IMA IM 10.4 ANDR AV 147%
0 5 10 15 20 25 30 35 40 45 50 -40% -20% 0% 20% 40% 60% 80% 100% 120% 140% 160%
Estimated EV/EBITDA 2010
KLK GR
RAA GR 12.8
FTI US 12.3
MTD US 10.4
MTW US 10.2
ALFA SS 10.0
ABBN VX 9.2
KRN GR 8.6
MIDD US 8.0
BUCN SW 8.0
Marel* 7.8
JBT US 7.4
G1A GR 7.0
CCK US 6.9
ANDR AV 6.4
SEE US 6.3
WPK CN 5.4
0 2 4 6 8 10 12 14 16 18 20
*IFS Estimates
29Contents
1) Introduction
2) The Market
3) Marel Food Systems
4) Financials
5) About the Offering
6) Appendix
30Appendix - Peer Group Information
Company Ticker Description
ABB Limited ABBN VX ABB Ltd. provides power and automation technologies. The Company operates under segments that include power
products, power systems, automation products, process automation and robotics.
Alfa Laval AB ALFA SS Alfa Laval AB provides specialized products and engineering solutions. The Company's product line includes equipment
and systems for heating, cooling, separation, and transportation of products such as oil, water, chemicals, beverages,
starch, foodstuffs, and pharmaceuticals. Alfa Laval sells and markets worldwide.
Bucher Industries BUCN SW Bucher Industries AG manufactures food processing machinery, vehicles, and hydraulic components. The Company
AG produces fruit and vegetable juice processing machinery, fodder harvesters, plows, seed drills, feed mixers, plant
sprayers, spreaders, tractors, street sweepers, snow blowers, glass forming machines, and hydraulic pumps, motors,
control valves and presses.
GEA Group AG G1A GR GEA Group AG offers engineering services. The Company designs and constructs factories that refine metals, produce
hydrocarbon products and chemicals, and treat sewage. GEA designs production lines for food processors, beverage
bottlers, and chemical, pharmaceuticals and cosmetics manufacturers.
Industria Macchine IMA IM I.M.A. manufactures packaging machinery for the food, pharmaceuticals, and cosmetics industries. The Company also
Automatiche S.p.A markets machines that complement its product line that are manufactured by other companies.
Kloeckner-Werke KLK GR Kloeckner-Werke AG manufactures bottling and packaging machinery and equipment. The Company produces bottling
AG machinery for the beverage industry and packaging machinery for the food, confectionery, chemical and
pharmaceutical industries. Kloeckner also manufactures precision cutting machines and robotic systems.
Krones AG KRN GR Krones AG designs and manufactures production machinery and packaging robots for breweries, soft drink and water
bottlers, chemical manufacturers, and food processors. The Company produces cleaning, filling, labeling, sorting, and
packaging production systems for handling of plastic and glass containers. Krones operates worldwide.
Key Technology KTEC US Key Technology, Inc. designs, manufactures, sells, and services process automation systems for the food processing
industry and industries such as tobacco, plastics, and pharmaceuticals. The Company's systems integrate electro-optical
automated inspection and sorting systems, specialized conveying systems and product preparation systems.
Winpak Ltd. WPK CN Winpak Ltd. manufactures and distributes packaging materials and machines for the protection of perishable foods,
beverages, and dairy products. The Company also has clients in the non-food markets such as pharmaceutical and
complex industrial applications.
31Appendix - Peer Group Information
Company Ticker Description
Crown Holdings Inc. CCK US Crown Holdings, Inc. designs, manufactures, and sells packaging products for consumer goods through plants located in
countries around the world. The Company's primary products include steel and aluminum cans for food, beverage,
household, and other consumer products. Crown also provides a variety of metal caps, closures and dispensing systems.
FMC Technologies FTI US FMC Technologies, Inc. designs, manufactures, and services systems and products used in offshore, particularly
Inc. deepwater, exploration and production of crude oil and natural gas. The Company also provides advanced handling and
processing systems to industrial customers. FMC Technologies’ subsea products include drilling and production systems,
subsea tree systems, and fluid control systems.
Middleby Corp. MIDD US The Middleby Corporation designs, manufactures, markets, and services a broad line of equipment for use in cooking
and preparing food. The Company's products are used in commercial and institutional kitchens and restaurants
throughout the world. Middleby’s brand names include Marshall, Southbend and Toastmaster.
Mettler-Toledo Int. MTD US Mettler-Toledo International Inc. manufactures and markets weighing instruments for use in laboratory, industrial, and
food retailing applications. The Company also supplies several related analytical and measurement technologies.
Mettler-Toledo provides its services to customers worldwide.
Sealed Air Corp. SEE US Sealed Air Corporation manufactures a wide range of packaging and performance-based materials and equipment
systems. The Company's products serve an array of food, industrial, medical, and consumer applications.
Andritz AG ANDR AV Andritz AG manufactures and markets machines for the production and processing of pulp, fiberboard, and paper. The
Company also provides high-tech production systems, machinery, and services for the steel and other specialized
industries such as feed manufacturing and sewage sludge treatment. Andritz operates worldwide.
John Bean JBT US John Bean Technologies Corporation manufactures food processing machinery. The Company produces equipment for
Technologies Corp. freezing and chilling poultry, meat, fruits, vegetables and baked products; poultry, meat and seafood processing
equipment; sterilization equipment; and fruit processing equipment.
Manitowoc MTW US The Manitowoc Company, Inc. is a diversified industrial manufacturer of cranes and related products and foodservice
Company Inc. equipment. The Company's products include lattice-boom cranes, tower cranes, mobile telescopic cranes, and boom
trucks as well as ice making machines, refrigerators and freezers.
Rational AG RAA GR Rational AG manufactures and markets food preparation appliances/processors and kitchen accessories for caterers and
canteen kitchens. The Company's products cook and reheat food. Rational sells primarily to hotels, restaurants,
canteens and caterers in Europe, the United States and Asia.
32Appendix - Competitors
Company Ticker Description
CFS Unlisted CFS BV specialises in performance focused solutions for the food processing industry and the food packaging
industry, from a single machine or packaging material to a complete production line for the preparation, marinating,
processing, slicing and packaging of primarily meat, poultry, fish, seafood and cheese based products.
Meyn-Systemate Unlisted Meyn Food Processing Technology BV is involved in poultry processing. The Company is one of the leading
manufacturers of systems and equipment for the poultry and convenience food processing industry. Subsidiaries in
around 20 countries with customers spread over 90 countries.
JBT FoodTech JBT John Bean Technologies Corporation manufactures food processing machinery through the brand name JBT
FoodTech . The Company produces equipment for freezing and chilling poultry, meat, fruits, vegetables and baked
products; poultry, meat and seafood processing equipment; sterilization equipment; and fruit processing equipment.
Weber Unlisted Weber Inc. is a manufacturer of slicing machines for the meat and cheese industry. The company also offers skinner/
derinder machines that remove fats, rinds, skins and tendors from meat.
Baader - Linco Baader-Linco is a developer and supplier of advanced food processing machinery, i.e. meat, fish, poultry and fruit.
Haarslev Haarslev Industries manufactures processing equipment to customers in the meat, pet food, fish, oil, environmental
protection and biofuel industries world-wide.
Handtmann Handtmann is a worldwide supplier to the meat processing industry specialising in meat processing equipment
including vacuum fillers and deli product systems.
MPS MPS develops, produces and installs high-tech slaughtering systems. MPS also designs and installs systems for the
portioning, deboning and logistic processing of meat products, as well as effluent treatment systems.
SFK Unlisted SFK-Danfotech A/S, a subsidiary of SFK Automation group is a provider of solutions for the food industry through
three business divisions; Slaughtering, Packaging and Process. The Company also supplies accessories for the food
industry
Gerstenberg Unlisted Gerstenberg and Agger A/S is a manufacturer of advanced machinery and processing equipment for the edible oils
and fat industry.
Vemag Unlisted VEMAG Anlagenbau GmbH offers customer-specific system solutions to the thermal treatment of foodstuffs,
especially meat and fish products as well as sausages.
33Appendix - Consolidated Accounts
Income statement 2009 YTD 2008 YTD 2008 FY
• Stork Food Systems has been a part of the Revenues 395.995 389.648 540.149
consolidated accounts since 1 May 2008 Cost of sales (255.040) (253.601) (361.218)
• Q4 2008 and Q1 2009 were affected by one-offs Gross profit 140.955 136.047 178.931
• EBITDA 2008 on a pro forma basis was EUR 71 Other operating income 15.409 905 716
million Sales & marketing expenses (55.134) (51.251) (71.838)
Research & development expenses (22.622) (19.693) (27.337)
• Marel has two businesses that are classified as
Administrative expenses (51.003) (38.155) (60.038)
non-core:
Operating profit (EBIT) 27.605 27.853 20.434
1. Stork Food and Dairy Systems in the
Netherlands, which produces solutions for Net financial expenses (15.577) (9.807) (32.194)
liquid food products Share of result of associates 0 473 473
2. Part of the operations of Carnitech A/S, Profit before tax 12.028 18.519 (11.287)
involving service to industries outside the Tax (795) (3.194) 2.882
scope of core operations
Net profit 11.233 15.325 (8.405)
EBITDA 46.738 42.196 42.108
% of sales
Gross profit 35,6% 34,9% 33,1%
EBITDA 11,8% 10,8% 7,8%
EBIT 7,0% 7,1% 3,8%
Sales & marketing expenses 13,9% 13,2% 13,3%
Research & development expenses 5,7% 5,1% 5,1%
Administrative expenses 12,9% 9,8% 11,1%
34Appendix - Core Business
Core Business
Income statement Q3 2009 Q2 2009 Q1 2009 Q4 2008 Q3 2008 Q2 2008 Q1 2008 2009 YTD 2008 YTD 2008 FY
Revenues 111,922 107,208 103,174 121,405 140,658 145,482 140,532 322,304 426,672 548,077
Cost of sales -66,167 -64,585 -69,075 -84,801 -88,673 -87,983 -86,725 -199,827 -263,381 -348,182
Gross profit 45,754 42,624 34,099 36,604 51,985 57,499 53,807 122,477 163,291 199,895
Operating expenses -32,690 -36,130 -39,319 -42,328 -36,506 -42,446 -40,382 -108,139 -119,334 -161,662
Operating profit (EBIT) 13,064 6,494 -5,220 -5,724 15,479 15,053 13,425 14,338 43,957 38,233
Profit before tax 3,174 5,651 -8,012 -27,364 7,004 15,702 11,592 814 34,298 6,934
Net profit 2,241 4,171 -6,004 -23,293 5,633 13,967 10,361 408 29,961 6,668
EBITDA 18,587 12,192 391 745 20,989 20,109 18,173 31,170 59,271 60,016
EBITDA, excl. one-off costs 3,891 14,545 34,670 73,816
EBIT, excl. one-off costs -1,720 8,076 29,059 52,033
% of sales
Gross profit 40.9% 39.8% 33.0% 30.2% 37.0% 39.5% 38.3% 38.0% 38.3% 36.5%
EBITDA 16.6% 11.4% 0.4% 0.6% 14.9% 13.8% 12.9% 9.7% 13.9% 11.0%
EBIT 11.7% 6.1% -5.1% -4.7% 11.0% 10.3% 9.6% 4.4% 10.3% 7.0%
EBITDA, excl. one-off costs 3.8% 12.0% 10.8% 13.5%
EBIT, excl. one-off costs -1.7% 6.7% 9.0% 9.5%
Excluding Stork F&D, part of Carnitech operations and Scanvaegt Nordic
35Disclaimer
• This Presentation is being furnished for the sole purpose of assisting the recipient in deciding whether to proceed with further analysis of this
potential opportunity. This Presentation is for informational purposes only and shall not be construed as an offer or solicitation for the
subscription or purchase or sale of any securities, or as an invitation, inducement or intermediation for the sale, subscription or purchase of
securities.
• The information set out in this Presentation may be subject to updating, completion, revision and amendment and such information may
change materially. Even though Marel Food Systems hf. has given due care and attention in the preparation of this Presentation, no
representation or warranty, express or implied, is or will be made by Marel Food Systems hf. as to the accuracy, completeness or fairness of
the information or opinions contained in this Presentation and any reliance the recipient places on them will be at its own sole risk. Without
prejudice to the foregoing, Marel Food Systems hf. does not accept any liability whatsoever for any loss howsoever arising, directly or
indirectly, from use of this Presentation or its contents or otherwise arising in connection therewith. Any recipient of this Presentation is
recommended to seek its own financial advice.
• There is no representation, warranty or other assurance that any of the projections in the Presentation will be realised. The recipient should
conduct its own investigation and analysis of the business, data and property described herein. Any statement contained in this Presentation
that refers to estimated or anticipated future results or future activities are forward-looking statements which reflect current analysis of
existing trends, information and plans. Forward-looking statements are subject to a number of risks and uncertainties that could cause actual
results to differ materially and could adversely affect the outcome and financial effects of the plans and events described herein. As a result,
the recipient is cautioned not to place undue reliance on such forward-looking statements.
• Transactions with financial instruments by their very nature involve high risk. Historical price changes are not necessarily an indication of
future price trends. Any recipient of this Presentation are encouraged to acquire general information from expert advisors concerning
securities trading, investment issues, taxation, etc. in connection with securities transactions.
• This Presentation and its contents are confidential and may not be further distributed, published or reproduced, in whole or in part, by any
medium or in any form for any purpose, without the express written consent of Marel Food Systems hf. By accepting this Presentation the
recipient has agreed, upon request, to return promptly all material received from Marel Food Systems hf. (including this Presentation) without
retaining any copies. In furnishing this Presentation, Marel Food Systems hf. undertakes no obligation to provide the recipient with access to
any additional information or to update this Presentation or to correct any inaccuracies therein which may become apparent.
• The distribution of this Presentation, or any of the information contained in it, in other jurisdictions than the Republic of Iceland may be
restricted by law, and persons into whose possession this Presentation comes should inform themselves about, and observe, any such
restrictions. Any failure to comply with these restrictions may constitute a violation of the laws of any such other jurisdictions.
36You can also read