National Climate Change Action Plan 2018-2022 - MINISTRY OF ENVIRONMENT AND FORESTRY - NAP ...
←
→
Page content transcription
If your browser does not render page correctly, please read the page content below
MINISTRY OF
                    ENVIRONMENT
                    AND FORESTRY

REPUBLIC OF KENYA   Climate Change Directorate

           National Climate Change
            Action Plan 2018-2022
                    Second Implementation Status
                     Report for the FY 2019/2020

                             DECEMBER 2021
National Climate Change
        Action Plan 2018-2022
Second Implementation Status Report for the FY 2019/2020

                    December 2021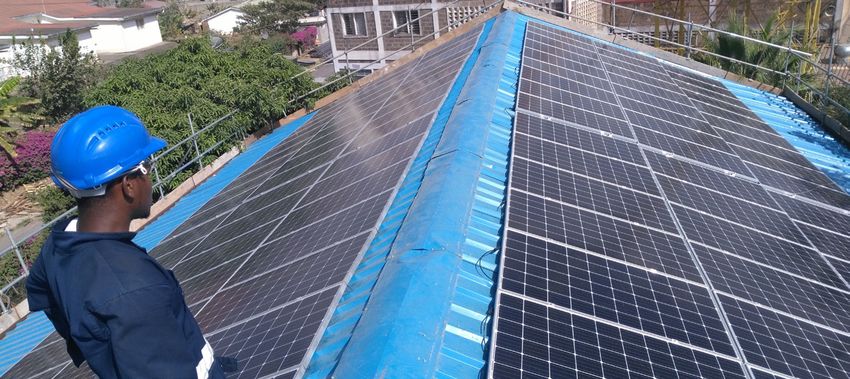
TABLE
OF CONTENT
List of Acronyms ii
Correct Citation:
List of Figures iv
Government of Kenya. (2021). National Climate Change Action Plan: Second Implementation Status
Report for the FY2019/2020. Ministry of Environment and Forestry, Nairobi, Kenya. List of Tables v
Copyright © 2021 Government of Kenya Executive Summary vii
Reproduction of this publication for educational or non-commercial purposes is authorised without
1
written permission from the copyright holder, provided that the source is fully acknowledged.
Reproduction of the publication for resale or other commercial purposes is however strictly INTRODUCTION 1
prohibited, except with prior written permission from the copyright holder.
1.1 Background To The Annual Reporting Process 2
Cover Design and Layout: Boniface Gor, @digimattsol, www.digimatt.co.ke 1.2 Task Objectives And Scope Of The Report 2
1.3 Overview Of Climate Change Impacts In Kenya In 2019-2020 3
Photo Credits: Climate Change Directorate, Ministry of Environment and Forestry
2
1.4 Responding To Climate Change In Kenya 4
For further information, please contact:
Principal Secretary
Ministry of Environment and Forestry
Email: psoffice@environment.go.ke
METHODS AND APPROACH 5
Website: www.environment.go.ke
3
Acknowledgements
The Ministry of Environment and Forestry expresses its gratitude to Coastal Oceans Research and RESULTS AND PROGRESS 9
Development Indian Ocean East Africa (CORDIO-EA), Kenya Breweries Limited, Kenya Electricity
Generating Company (KenGen), Kenya Forest Services, Kenya National Highways Authority, and 3.1 Disaster Risk Management 10
Safaricom for submitting the case studies that are included in this report. Thanks are extended 3.2 Food And Nutrition Security 12
to the experts from the national ministries, departments and agencies, County Governments
3.3 Water And The Blue Economy 15
and private sector that submitted information that informed this progress report. In addition,
thanks are extended to Mr. Victor Orindi for supporting the development of this report, and to Mr. 3.4 Forestry, Wildlife And Tourism 17
Lerenten Lelekoitien, Climate Change Directorate, for leading the work. 3.5 Health, Sanitation And Human Settlements 22
3.6 Manufacturing 25
The progress report was prepared with assistance from the NAP Global Network Secretariat and
3.7 Energy And Transport 27
the International Institute for Sustainable Development (IISD), via the generous financial support of
the Governments of Canada, Germany, the United Kingdom and the United States.
4 ENABLERS
4.1
4.2
4.3
4.4
Enabling Policy And Regulatory Frameworks
Technology And Innovation
Capacity Development And Knowledge Management
Climate Finance And Resource Mobilization
35
36
38
39
44
4.5 Transparency, Measurement, Reporting And Verification (Mrv+) 46
5 CHALLENGES AND LESSONS LEARNT
5.1
5.2
Challenges
Lessons Learnt
49
50
50
6 RECOMMENDATIONS 51
7 ANNEXES 53
Please consider the environment before printing this publication. If you have to print
it, please use recycled paper, and print on both sides of the paper.
Annex 1: List Of Respondents 54
Endnotes 55
NCCAP - Second Implementation Status Report for the FY 2019/2020 i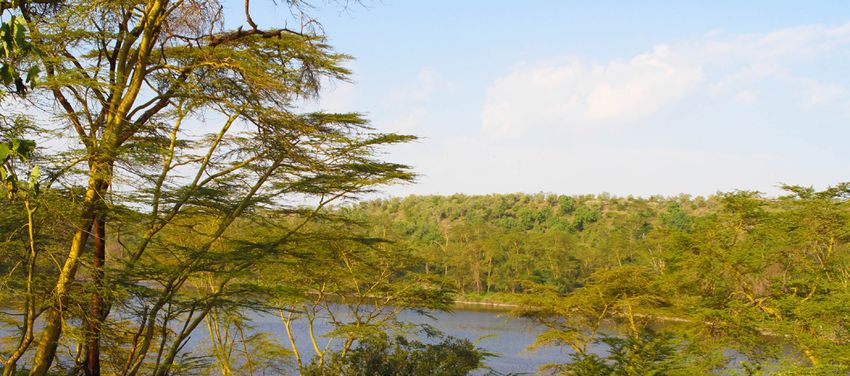
List of Acronyms
ASAL		              Arid and Semi-arid Lands                                           KFS 		     Kenya Forest Service
BRT 		              Bus Rapid Transport                                                KMD 		     Kenya Meteorological Department
CBIN 		             Climate Business Information Network                               KNEC 		    Kenya National Examination Council
CBNRM 		            Community Based Natural Resource Management                        KNEECS		   Kenya National Energy Efficiency and Conservation Strategy
CPEBR 		            Climate Public Expenditure and Budget Review                       KPCG 		    Kenya Platform for Climate Governance
CCD 		              Climate Change Directorate                                         KPLC 		    Kenya Power and Lighting Company
CCCF 		             County Climate Change Fund                                         KSG 		     Kenya School of Government
CCU		               Climate Change Unit                                                KWS 		     Kenya Wildlife Service
CEC 		              County Executive Committee ember                                   LPG 		     Liquefied Petroleum Gas
CFA 		              Community Forest Association                                       MDAs 		    Ministries, Departments and Agencies
CIS 		              Climate Information Services                                       MEF 		     Ministry of Environment and Forestry
CSA 		              Climate Smart Agriculture                                          MRV+ 		    Measurement, Reporting and Verification Plus
CSO 		              Civil Society Organisation                                         MSME 		    Micro, Small and Medium Enterprises
CORDIO EA           Coastal Oceans Research and Development Indian Ocean East Africa   MW 		      Megawatt
DRM 		              Disaster Risk Management                                           NAP 		     National Adaptation Plan
EPRA		              Energy and Petroleum Regulatory Authority                          NCCAP		    National Climate Change Action Plan
EWS 		              Early Warning System                                               NCCRS 		   National Climate Change Response Strategy
FAO		               Food and Agriculture Organisation                                  NDA 		     National Designated Authority
FLLoCA 		           Financing Locally Led Climate Action                               NDC 		     Nationally Determined Contribution
FRL 		              Forest Reference Level                                             NDMA 		    National Drought Management Authority
GCF 		              Green Climate Fund                                                 NDOC 		    National Disaster Operation Centre
GDC		               Geothermal Development Cooperation                                 NEMA 		    National Environment Management Authority
GHG 		              Greenhouse Gas                                                     NFMS 		    National Forest Monitoring System
GoK		               Government of Kenya                                                NSNP 		    National Safety Net Programme
GZD 		              Green Zones Development                                            PET 		     Polyethylene terephthalate
HA 		               Hectares                                                           REDD+ 		   Reducing Emissions from Deforestation and Degradation plus
HSNP 		             Hunger Safety Net Programme                                        SAGA 		    Semi Autonomous Government Agency
IISD 		             International Institute for Sustainable Development                SGR 		     Standard Gauge Railway
KAM 		              Kenya Association of Manufacturers                                 SLEEK 		   System for Land Based Emissions Estimation in Kenya
KBL 		              Kenya Breweries Limited                                            TLU 		     Tropical Livestock Unit
KCB 		              Kenya Commercial Bank                                              TVET 		    Technical and Vocational Education Training
KCCWG 		            Kenya Climate Change Working Group                                 UNDP		     United Nations Development Programme
KEFRI 		            Kenya Forestry Research Institute                                  UNFCCC     United Nations Framework Convention on Climate Change
KENGEN              Kenya Electricity Generating Company                               WIO 		     Western Indian Ocean
KeNHA 		            Kenya National Highways Authority                                  WMO 		     World Meteorological Organisation
KEPSA 		            Kenya Private Sector Alliance

 ii   NCCAP - Second Implementation Status Report for the FY 2019/2020                                                                      NCCAP - Second Implementation Status Report for the FY 2019/2020   iii

List of Figures                                                                                    List of Tables
Figure 1:          Summary of respondents                                                     18   Table 1:    Disaster Risk Management                                                                                        22
Figure 2:          Climate-related risks targeted by actions being implemented                19   Table 2:    Food and nutrition security                                                                                     24
Figure 3:          Western Indian Ocean coral reefs – red list of ecosystem assessment 2020   55   Table 3:    Water and the blue economy                                                                                      27
Figure 4:          Structure of Kenya’s integrated MRV System                                 60   Table 4:    Forestry, Wildlife and Tourism                                                                                  30
                                                                                                   Table 5:    Health, sanitation and human settlements                                                                        35
                                                                                                   Table 6:    Manufacturing                                                                                                   38
                                                                                                   Table 7:    Energy                                                                                                          39
                                                                                                   Table 8:    Transport                                                                                                       43
                                                                                                   Table 9:    Enabling policy and Regulatory frameworks                                                                       48
                                                                                                   Table 10:   Technology and Innovation                                                                                       50
                                                                                                   Table 11:   Capacity development and knowledge management                                                                   52
                                                                                                   Table 12:   Climate finance and resource mobilization                                                                       56
                                                                                                   Table 13:   Transparency, Measurement, Reporting and Verification (MRV+)                                                    59

 iv   NCCAP - Second Implementation Status Report for the FY 2019/2020                                                                                      NCCAP - Second Implementation Status Report for the FY 2019/2020   v
Executive Summary
The National Climate Change Action Plan (NCCAP) 2018-2022 sets out the path towards low carbon climate resilient
development in a manner that prioritises adaptation. It provides a framework for Kenya to deliver on its National Adaptation
Plan (NAP) 2015-2030 and its Nationally Determined Contribution (NDC) under the Paris Agreement of the United Nations
Framework Convention on Climate Change (UNFCCC). It encourages the mainstreaming of adaptation and mitigation actions
across sectors and levels of government; and engagement and participation of key stakeholders including the private sector,
development partners and the general public in climate change processes and interventions.

This second NCCAP implementation progress report covers the period July 2019 to June 2020 and is based on submissions
by national and county governments and informed by contributions from the private sector and Civil Society Organisations
(CSOs). It covers progress made in the seven priority areas in the NCCAP namely disaster risk management; food and
nutrition security; water and the blue economy; forestry, wildlife and tourism; health, sanitation and human settlements;
manufacturing; and energy and transport. Also included is progress made with the enablers, namely the policy and regulatory
framework; technology and innovation; capacity development and knowledge management; climate finance and resource
mobilization; and transparency, measurement, reporting and verification plus (MRV+). The enabling actions are meant to
enhance delivery of the adaptation and mitigation actions set out under the seven priority areas.

Data was collected using an online reporting tool that was sent to all ministries, state departments, agencies (MDAs), and
county governments. Private sector entities were approached through the Kenya Private Sector Alliance (KEPSA), while the
Kenya Climate Change Working Group (KCCWG) and the Kenya Platform for Climate Governance (KPCG) facilitated access to
CSOs. Potential respondents were requested to complete the form and submit online. The decision to use an online tool was
informed by the need to reach more people across the country quickly and easily, and online responses became even more
useful during the Covid-19 pandemic that restricted movement and face to face meetings.

A total of 90 institutions responded including 40 county governments, 34 MDAs, 11 research institutions and 5 private sector
entities. Sixty two respondents (62%) were reporting for the first time compared to thirty eight (38%) who were reporting for
the second time. A majority of the respondents focused their actions on addressing climate risks such as drought, floods,
changing rainfall patterns, and landslides which are consistent with priorities in NCCAP, NAP and NDC among others. Many
institutions saw opportunities in carbon sequestration, resilience building (e.g., through livelihood diversification and water
conservation), awareness creation, and capacity building (including early warning and preparedness).

Several challenges were reported that affected implementation of the action plan during the reporting period. These
included weak or non-existent climate change coordinating units in the reporting institutions, more so in the counties; poor
coordination among the different actors leading to duplication of efforts and risk of double counting; inadequate financial
resources to support implementation and reporting; and the locust invasion and Covid-19 pandemic that led to a diversion
of resources to deal with these emergent challenges.

To address these challenges, it is recommended that CCD carry out the following actions:
•   Sensitize and build capacity of all relevant units within ministries, departments, agencies, counties, private sector and CSOs
    that are responsible for coordinating climate change actions so that monitoring and reporting can be more streamlined;
•   Adopt a biennial reporting timeline to reduce the demand on those expected to report and cost adaptation actions, and
    on the CCD that carries out the exercise;
•   Invest in a data management system with higher functionality and capabilities since the open-source Kobo software that
    has been used in the last two years has limitations in terms of what users can do; and
•   Ring-fence climate finance so that implementation of activities is not disrupted. This also implies that government and
    other institutions plan for emergent challenges.

                                                                  NCCAP - Second Implementation Status Report for the FY 2019/2020   vii
Chapter One: Introduction

CHAPTER

ONE
 INTRODUCTION

       NCCAP - Second Implementation Status Report for the FY 2019/2020   1
Chapter One: Introduction Chapter One: Introduction
The National Climate Change Action Plan (NCCAP) 2018- Climate Change (UNFCCC). It is a five-year plan that provides 1.3 Overview of climate change impacts in Kenya in 2019-2020
2022 aims to further Kenya’s development goals by providing an overarching blueprint to guide the mainstreaming of
mechanisms and measures to achieve low carbon climate adaptation and mitigation actions across sectors and NCCAP 2018-2022 identified major climate hazards in people that died and 100,000 people that were displaced.10
resilient development in a manner that prioritises adaptation. levels of government. NCCAP 2018-2022 encourages the Kenya, including the increasing frequency and intensity of The heavy rains impacted coastal areas with beaches
The NCCAP is a requirement set out in the Climate Change engagement and participation of key stakeholders, including extreme climate events, heat waves, droughts, floods, and being flooded and fish landing sites negatively impacted.11
Act, 2016 and it provides a framework for Kenya to deliver Ministries and Agencies, County Governments, development landslides. 4 The situation in 2019-2020 demonstrates that Landslides were reported in the Rift Valley and the central
on its National Adaptation Plan (NAP) 2015-2030 and its partners, the private sector, civil society, and the general these climate hazards have real impacts at the household and coastal regions, according to the Government’s National
Nationally Determined Contribution (NDC) under the Paris public. and societal level in Kenya. Disaster Operations Centre (NDOC).12 The Masinga dam
Agreement of the United Nations Framework Convention on reached maximum water capacity for first time in its history.13
Kenya has been affected by severe drought since 2016 that The flooding situation in 2020 was exacerbated by the
1.1 Background to the annual reporting process has been interrupted by several very heavy rainy seasons, Covid-19 pandemic, which disproportionately affected those
including the short rains season (October-November- who lost their homes and livelihoods in the April and May
Section 13(7) of the Climate Change Act, 2016 requires that Efforts to address climate change in 2019/2020 encountered December) in 2019 and the long rains season (March-April- 2020 flooding.14 Coastal communities were particularly
the Climate Change Directorate (CCD) undertake a biennial several challenges. The coronavirus disease 2019 (Covid-19) May) in 2020. The State of the Africa Climate 2019 reported impacted by Covid-19 due to their high reliance on tourism
review of the implementation of the NCCAP and report to pandemic led to a slowing down of the economy, loss of that Kenya experienced two successive below-average and shipping, and on the fisheries trade that requires
the National Climate Change Council. The review is informed sources of livelihoods, and loss of human lives. An invasion by rainfall seasons in 2018-2019 resulting in significant rainfall transport from fishing zones to markets.
by the inputs of public entities that are required to report desert locusts affected 26 counties -15 being Arid and Semi- deficits, with totals for the 12 months ending June 2019
annually to the Council on the status and progress of arid Lands (ASALs)-and led to a loss of crops and pasture around 50% of average.5 The heavy rains in 2019 and 2020 created conditions
performance and implementation of all assigned climate thereby increasing the food insecurity situation. 3 Financial conducive to the severe desert locust outbreaks, the
change duties and functions. 1 Additionally, the review is and technical resources intended for climate change action A dramatic shift in conditions in late 2019 contributed worst in decades that affected Kenya and other countries
informed by County Government reports on the progress were diverted to deal with these emergent challenges. to above average rainfall in Kenya, of at least double in the East Africa region. These recent intense outbreaks
of the implementation of climate change actions, which are the average seasonal rainfall. The Kenya Meteorological of locusts can be linked to anthropogenic climate change
to be submitted annually to the County Assembly, with a On the positive side, the country updated and submitted her Department (KMD) reported that rainfall performance in and the increased frequency of extreme weather events.15
copy of the report provided to the CCD. The report is also NDC that included enhanced ambition to abate greenhouse the 2020 long rains season was far above normal in most Damage to the 2019 crops was minimal, but the insects
informed by contributions from the private sector and public gas (GHG) emissions, increasing Kenya’s intended contribution parts of the country, while the 2020 short rains season caused substantial crop losses in 2020.16 The desert locust
benefit organisations. to reduce GHG emissions to 32% by 2030 relative to the exhibited depressed rainfall over most of the country.6 outbreaks affected 26 counties (15 ASAL counties) and the
business-as-usual scenario of 143 million tonnes of carbon 2020 temperatures were higher than average, with the cold Food Security and Nutrition Working Group reported that
This second NCCAP implementation report covers the dioxide equivalent (up from a 2016 intended contribution of season (June-July-August) having the greatest deviation from approximately one-third of cropping households and half
period July 2019 to June 2020 and builds on the 2018/19 30%). The NDC commits Kenya to ensuring a climate resilient normal compared to other months. of livestock-rearing households in East Africa experienced
progress report. 2 The report highlights key achievements society by mainstreaming climate change into Medium- locust-related crop and pasture losses.17 A total of 609,999 Ha
made across the seven NCCAP strategic objectives; progress Term Plans and County Integrated Development Plans, and In 2019, the food security situation deteriorated in parts of (30,213 Ha of cropland and 579,786 Ha of pastureland) were
to implement the enabling actions in terms of policy implementing adaptation actions. This enhanced ambition is Kenya due to the cumulative impact of the below-average lost as a result of the locust invasion in the 16 most affected
and regulatory frameworks, technology and innovation, in line with the sustainable development agenda, national short rains in 2018 followed by the poor 2019 long rains counties.18 The locust invasion led to hunger in both humans
capacity development and knowledge management, climate circumstances, and aspirations to increase resilience to season. The number of people in Kenya affected by food and livestock; cases of diarrhoea and even death of livestock
finance and resource mobilization, and measurement, climate change by introducing programmes for adaptation insecurity increased between late 2018 and late 2019 from after ingestion of the locust droppings which also affected
reporting and verification; and challenges experienced with actions across sectors in support of livelihoods, poverty 0.7 to 3.1 million.7 The 2019 aggregate cereal production open water sources carried by runoff water which caused
implementation. Four case studies have been included eradication, and economic well-being of the Kenyan people declined by about 8% due to reduced first season harvests in stomach ailments in human beings; and displacement and
to exemplify some of the best practices in addressing while pursuing a low carbon development pathway. The Kenya on account of severe early season dryness.8 Droughts conflicts as communities sought alternative food and feed
adaptation in Kenya. updated NDC builds on the initial NDC, NAP 2015-2030 and typically impact the ASALs which receive low amounts of for their livestock in the affected areas.19
NCCAP 2018-2022 together with new policies and plans. rainfall and have high temperatures for most of the year.
ASALs account for 89% of Kenya’s land area, 38% of the The Western Indian Ocean (WIO) has warmed faster than
country’s population, 75% of livestock, and 90% of wildlife.9 the broader Indian Ocean and the global average, by about
1.2 Task objectives and scope of the report 1oC from 1900 to 2015. This is due to high warming rates
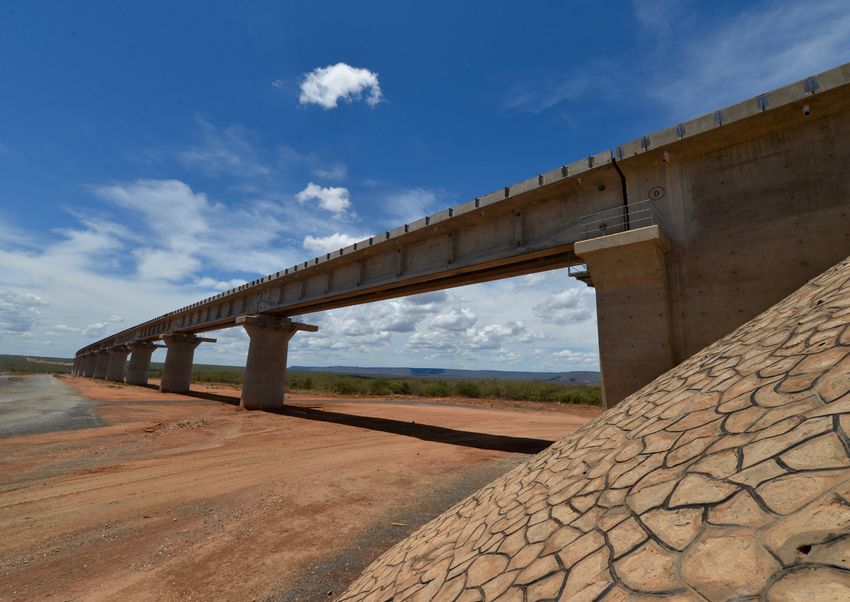
This second annual implementation report mainly covers Similar to the first report (2018-2019), this 2019-2020 report The heavy rains in the second half of 2019, and especially during El Niños, a lack of cooling during La Niña conditions,
the actions of the two levels of government, reviewing the aims to: during the October-November-December short rains and increasing frequency of El Niños.20 This high rate of
actions of 40 County Governments and 31 national Ministries, • Consolidate data on climate change related activities season, triggered widespread floods that resulted in loss of warming may explain why WIO coral reefs were among the
Departments and Agencies (MDAs) that submitted reports and investments by all stakeholders at national and life, mass displacement, damage to crops, loss of livestock, worst-impacted globally in 1998 in the first global bleaching
to the CCD on their implementation of the priority climate county levels. and destruction of infrastructure (such as roads, bridges, event. At present the impact on fisheries is hard to discern
change actions set out in NCCAP 2018-2022. Information • Highlight progress, challenges, opportunities, and and buildings) particularly in northern and eastern Kenya. due to already high levels of fishing impacts, and reef
submitted by 10 universities and 4 private sector entities lessons learnt. regions around the WIO are rated as “Vulnerable to collapse”
supplements the government reporting, with contributions • Enhance stakeholder awareness and involvement in Torrential rains were experienced in the long rains season based on fishing impacts (mainly the continental coast) or
from the private sector included as case studies in this report. climate change activities for improved action. in April and May 2020. Flooding adversely impacted more “Endangered to Critically Endangered” based on climate
The report also highlights key challenges and opportunities than 800,000 Kenyans in 29 counties; including about 300 warming (mainly the islands).21
experienced during the reporting period. The report is organised into the following sections: Chapter
one covers background and objectives; Chapter Two –
The preparation of the report was coordinated by the CCD Methodology and approach employed in the preparing the
of the Ministry of Environment and Forestry (MEF), with the report; Chapter Three – Summary of results by strategic
support of the NAP Global Network, International Institute objectives and enablers; Chapter Four – Challenges and
for Sustainable Development (IISD) lessons learnt; and Chapter Five: Recommendations and
way forward.
2 NCCAP - Second Implementation Status Report for the FY 2019/2020 NCCAP - Second Implementation Status Report for the FY 2019/2020 3
Chapter One: Introduction                                                                                                                                                          Chapter Two: Methods and Approach

1.4       Responding to climate change in Kenya
The National Climate Change Policy and the Climate Change                health coverage) and Vision 2030 whose objective is ‘to
Act put forward Kenya’s driving philosophy in responding                 transform Kenya into a newly industrializing, middle-income
to climate change as moving ‘towards a low carbon climate                country providing a high quality of life to all its citizens by
resilient development pathway.’ The NCCAP 2018-2022, NAP                 2030 in a clean and secure environment’.22
and NDC state that adaptation is the country’s priority and
set out the actions that will help the country achieve this              The country recognizes the important roles played by the
goal. These documents identify priority adaptation actions               national and county governments, private sector, civil society
that help households and communities manage climate risks                organizations (CSOs), research organizations, institutions of
while prospering economically and socially under a changing              higher learning, and media, among others. Each of them is
climate while keeping emissions low. The strategic objectives            expected to contribute to the successful implementation of
of the NCCAP 2018-2022 are aligned with the government’s                 NCCAP priority actions that help achieve Kenya’s contribution
Big Four Agenda (that prioritizes enhanced manufacturing;                towards the Paris Agreement as captured in its NDC and
food and nutrition security; affordable housing; and universal           NAP, the Big 4 agenda, and ultimately, Vision 2030.

                                                                                                                                            CHAPTER
                                                                                                                                            TWO
                                                                                                                                           METHODS AND APPROACH

 4    NCCAP - Second Implementation Status Report for the FY 2019/2020                                                                               NCCAP - Second Implementation Status Report for the FY 2019/2020   5
Chapter Two: Methods and Approach                                                                                                                                                                                                                        Chapter Two: Methods and Approach

The preparation of this report employed a combination of                    the online reporting tool, which were addressed before                                          Drought                                                                                                    39
methods and approaches to generate relevant data and                        it was rolled out.
information as summarized below:                                        •   Key informant interviews. Based on the training
•    Desk review of policy documents and literature on                      workshops and expert knowledge, a few stakeholders                                               Floods                                                                                  32
     climate change: Review of relevant policy documents                    were identified for interviews for the purposes of
     such as the Climate Change Act, 2016; NCCAP 2018-                      preparing case studies. Those selected as key informants
     2022 together with the Adaptation Technical Analysis                   are individuals that were doing something innovative or                       Changing rainfall patterns                                                                            30
     Report (ATAR) and Mitigation Technical Analysis Report                 transformative to address climate change that provided
     (MTAR) reports, NAP 2015-2030, updated NDC (2020),                     useful lessons and could be scaled out going forward.
     and climate change literature on Kenya was carried                 •   Primary data collection using an online reporting                                            Landslides                                        17

                                                                                                                                          Climate risks
     out to obtain a better understanding of the policy                     tool. The online reporting tool was sent to all ministries,
     environment and prevailing context. Annual reports                     state departments, agencies, and county governments.
                                                                                                                                                           Increased temperatures                                13
     of Semi-Autonomous Government Agencies (SAGAs,                         Private sector entities were approached through
     such as the National Drought Management Authority                      the Kenya Private Sector Alliance (KEPSA), and the
     [NDMA]) and sectors (such as Transport) together with                  Kenya Climate Change Working Group (KCCWG) and                                        Pest and diseases                         12
     current publications on climate change in Kenya were                   the Kenya Platform for Climate Governance (KPCG)
     reviewed to identify relevant information to inform this               facilitated access to CSOs. Potential respondents were
     report.                                                                requested to complete a form and submit online. The                             Human-wildlife conflict                5
•    Stakeholder mapping and engagement workshops.                          decision to use an online tool was informed by need
     A stakeholder mapping exercise was carried out to                      to reach more people quickly and easily across the
     identify key stakeholders working on climate change                    country, and became even more useful during the                                     Loss of biodiversity       1
     in Kenya. Key groups or categories identified included                 Covid-19 pandemic that restricted movement and
     national government MDAs; county governments;                          face to face meetings. Passwords for logging into the                                                      0       5       10             15          20            25         30             35          40          45
     private sector entities; CSOs; and development partners                online tool were provided to contact persons in the                                                                                                 Number of Respondents
     that include UN and other international agencies.                      various institutions to ensure integrity of data being
     Subsequently, a sensitization exercise on the NCCAP                    collected. The survey used the same tool as in year 1         Figure 2: Climate-related risks targeted by actions being implemented
     and training on the online data collection tool Kobo                   after reviewing the tool for completeness and relevance
                                                                                                                                          •                Data consolidation and analysis. Data collected from                   results presented in the form of high-level summaries.
     were organized for each of the groups in April and May                 based on feedback from stakeholders. Back up support
                                                                                                                                                           the online reporting tool as well as from reports and the              Where appropriate, infographics were prepared to
     2021. Additional training sessions were organized in                   was provided to stakeholders on a continuous basis as
                                                                                                                                                           literature was collated and analysed to track progress                 show performance at a glance.
     mid-May for those who missed the initial sessions for                  they filled information online.
                                                                                                                                                           over 2019-2020 in implementing the NCCAP. For each               •     National Validation of draft report. The draft
     their respective groups. 38 CSO representatives, 36                •   Ninety (90) institutions submitted information
                                                                                                                                                           of the strategic objectives, an assessment of progress                 progress report was presented to stakeholders at a
     private sector representatives, 55 officials from MDAs,                through the online reporting tool; which included 40
                                                                                                                                                           toward the expected results was undertaken where                       national validation workshop held on the 30th November
     and 56 county government officials were trained in the                 county governments, 34 MDAs, 11 research institutions
                                                                                                                                                           possible. For the enabling actions, a review of progress               2021. Over 138 stakeholders confirmed that the report
     first round. An additional 88 participants were trained                and 5 private sector entities as summarized in Figure 1
                                                                                                                                                           on the process indicators was completed. An Excel                      was an accurate representation of their submissions;
     during the make-up sessions bringing the total trained                 below. Sixty Two respondents (62%) were reporting for
                                                                                                                                                           spreadsheet was used to undertake the analysis, with                   and comments provided at the validation exercise were
     to 273 people. The trainings sensitized stakeholders                   the first time compared to thirty-eight (38%) who were
                                                                                                                                                                                                                                  incorporated in this final report.
     on the importance of NCCAP reporting, and identified                   reporting for the second time.
     concerns that stakeholders had on the process including

           44%                                  38%                              12%                               6%
            County                                                               Research                         Private
         Governments                               MDAs
                                                                               Institutions                       Sector

Figure 1: Summary of respondents

In terms of areas of focus, the majority of the respondents             hand, most of the institutions saw opportunities in carbon
focused their actions on addressing climate risks such as               sequestration, resilience building (e.g., through livelihood
drought, floods, changing rainfall patterns, and landslides             diversification and water conservation), awareness
which are consistent with the priorities in NCCAP, NAP                  creation, and capacity building (including early warning and
and NDC (figure 2). Curiously missing was sea-level rise                preparedness).
which affects large areas along the coastline. On the other

 6   NCCAP - Second Implementation Status Report for the FY 2019/2020                                                                                                                                                      NCCAP - Second Implementation Status Report for the FY 2019/2020   7
Chapter Three: Results and Progress
CHAPTER
THREE
RESULTS AND PROGRESS BY
STRATEGIC OBJECTIVES
NCCAP - Second Implementation Status Report for the FY 2019/2020 9Chapter Three: Results and Progress
This section provides highlights of progress made and key settlements; manufacturing; and energy and transport. The
activities implemented across the seven priority areas of tables in each section below set out the priority actions,
NCCAP namely disaster (drought and flood) risk management; expected results, and cumulative results achieved from July
Results Achieved as of June 2020
food and nutrition security; water and the blue economy; 2018 to June 2020. The results achieved in the 2019-2020 Actions Expected Results by 30th June 2023
forestry, wildlife and tourism; health, sanitation and human period are described in the written text. (Cumulative)
Water and flood control including dams, dykes,
3.1 Disaster Risk Management drainage systems, water storage (see expected
results under Climate Action 3 – Water and the Blue
The aim is to reduce risks that result from climate related disasters, such as droughts and floods, to
Economy).
communities and infrastructure. Pro-active management of these extreme events can ameliorate or reduce
impacts on the society and economy. Improve the coordination of disaster risk management
Table 1: Disaster Risk Management (including floods, droughts, disease outbreaks, landslides
and others) by enacting and implementing the Disaster 8 counties developed county disaster
Results Achieved as of June 2020
Actions Expected Results by 30th June 2023 Risk Management Act that includes the establishment of: management legislation, plans and
(Cumulative) coordinating units/committees.
National Disaster Risk Management Authority to
4. Improve coordination and coordinate disaster response 23 ASAL counties have drought
No. of beneficiaries of social protection mechanisms contingency plans.
delivery of disaster risk Engendered County Disaster Risk Management
and other safeguards (under the Hunger Safety Net 2,620 people trained on risk of forest
management Committee to coordinate disaster response at the
Programme [HSNP]) increased from 100,000 to fires, disaster preparedness, response
150,000 households for regular beneficiaries; and county level preparedness and environmental
from 90,000 to 130,000 for scalability beneficiaries. Disaster Risk Management Fund to provide funds safety.
No. of households better able to cope with climate for disaster preparedness, mitigation of disaster
change because of receiving benefit from County impacts, and disaster recovery measures,
Climate Change Funds from increased 300,000 HSNP reached 100,532 households. particularly for vulnerable groups.
households in 2018 to 800,000 households. Climate Conditional (drought shock responsive)
1. Increase number of
Change Funds address local adaptation priorities that cash transfers reached 8,732
households and entities The priority actions identified in NCCAP 2018-2022 included infrastructure to cope with drought and floods and; improving
are identified and monitored by community households.
benefiting from devolved
committees comprised of women and men. NSNP reached 1,263,000 households increasing the number of people benefiting from devolved coordination and delivery of disaster risk management.
adaptive services
No. of beneficiaries under the National Safety Net (4,925,700 individuals). adaptive services; improving ability of households and
Programme (NSNP) increased from 4,017,759
individual beneficiaries in 2017 to 4,280,000. Key achievements during the FY 2019-2020 reporting period out of which 60% of recipients were women in the four
Note: No. of beneficiaries increases because the of are described below: arid counties of Wajir, Mandera, Turkana, and Marsabit.
expanded scope of programmes meaning more Kenyans • Kenya Meteorological Department (KMD) reached an The entire cash transfer caseload was fully financed by
are eligible for support additional 1,011,583 users with climate information the government,24 which also disbursed drought shock
Note: Average household size in Kenya was 3.9 members services in the form of daily, weekly, monthly, and responsive cash transfers to 8,732 households as
according to the 2019 census. seasonal forecasts and advisories bringing the triggered by the drought severity index.25
cumulative total (FY 2018-19 and 2019-20) to 2,562,503 • Over 3,074 water tanks, pans, or earth dams were
2,562,503 people received climate people. Additionally, 3,468 flood early warnings that constructed or installed, which enhanced water
information services.
Drought early warning systems improved, including included advisories on extreme weather were issued, harvesting and storage for households and productive
46 consolidated monthly national and
the promotion of people-centred systems at the which improved the ability of communities to cope with uses across the country. Nyandarua County had 15 roof
552 county monthly drought early
national and county levels. warning bulletins produced.
floods. harvesting systems installed in institutions. Enhanced
No. of recipients of climate information services that 17 coral bleaching alerts issued in the • The National Drought Management Authority (NDMA) water harvesting and storage eased the burden of water
use the information in their risk management Kenyan seascape. produced and disseminated 23 monthly county drought collection, particularly for women who often travel long
2. Improve ability of people to decisions increased from 1,000,000 to 2,000,000. 3,283 water tanks, dams, boreholes, early warning bulletins totalling 276 for the year. A further distances and spend many hours fetching water for
cope with drought pans, or earth dams were constructed 12 consolidated monthly national drought early warning household use.
Water harvesting and storage (see expected results
under Climate Action 3 – Water and the Blue or installed. bulletins were also produced and disseminated.23 • County disaster management legislation, plans, and
Economy). Nyandarua County installed 15 roof CIS including early warnings contributes to better risk coordinating units/committees were established in six
harvesting systems in institutions. The management and sustainability of investments. counties; namely Bungoma, Isiolo, Kakamega, Makueni,
Operationalise the National Drought Emergency
Fund Asset Creation Programme constructed • NDMA disbursed KES 3.3 billion under the HSNP through Nandi and Nyamira. These are expected to improve
rainwater harvesting structures in six regular cash transfer cycles to 100,532 households, coordination and management of climate-related risks.
1,000 sites across 14 ASAL counties.
Draft National Drought Emergency
Fund regulations developed
Flood early warning systems improved, taking
advantage of widespread access to mobile
technology that provides an avenue for 3,493 flood early warnings issued.
disseminating information. Three counties (Taita Taveta, Kisumu
and Kajiado) have taken action to
Implement the existing 11 integrated flood
3. Improve ability of people to management plans; for example, water storage, reduce flooding, including drainage
cope with, and systems, storm water drains, and
drainage networks, reforestation and rehabilitation
infrastructure to withstand, of riparian areas, construction of dams, land use construction of dams.
floods 60 km of blocked drainage channels
restrictions.
opened in Nyando basin, Kisumu
Dam Safety Control System established including a County under Adaptation project by
needs assessment, development of safety manuals NEMA to reduce the risk of flooding
and codes of practice. and protect local communities.
Capacity development of 50 Water Resources Users
Associations, which are community-based
organizations that are rights-based groups with
10 NCCAP - Second Implementation Statusfemale
Reportand male
for the FY membership.
2019/2020 NCCAP - Second Implementation Status Report for the FY 2019/2020 11Chapter Three: Results and Progress
3.2 Food and nutrition security
Agriculture plays a key role in terms sector contributed 31.5% of GDP in 2017; provided around Results Achieved as of June 2020
of food and nutritional security, rural 75% of employment and supported over 80% of the rural Actions Expected Results by 30th June 2023
(Cumulative)
livelihoods, and poverty alleviation. The population. Agriculture remains largely rain-fed making it
Small-scale farmers, pastoralists and fisher Two conservation enterprises in the
NCCAP reported that the agriculture highly susceptible to climate vagaries such as temperature communities supported to transition to specialised marine sector conceptualised.
increase, changes in precipitation, and extreme events. and market-oriented output in 13 priority value Over 67,175 farmers, 90,000 pastoralists
Table 2: Food and nutrition security chains, including drought tolerant value chains. and 250 fishers supported to transition to
specialized and market-oriented outputs.
Results Achieved as of June 2020 15 counties have CIS plans (63% of the
Actions Expected Results by 30th June 2023 6. Enabling Action –
(Cumulative) No. of counties developing and implementing climate national target).
technology and information service (CIS) plans increased from 9 to 47. 3 counties (Kwale, Narok and Siaya)
No. of institutions /value chain actors and knowledge
households harvesting water for agricultural (Linked to Action 1 DRM) developed Integrated Climate Risk
management Management Plans.
use/production increased to 500,000.
Agricultural pre- and post-harvest losses reduced
from 40% to 15%. 196,391 actors harvested water. The focus under this priority area is to increase or maintain interventions in the crop, livestock and fisheries sub-sectors;
No. of beneficiaries accessing climate-oriented 8.12% reduction in pre- and post- food and nutrition security under a changing climate through increase crop productivity through improved irrigation; and
crop insurance increased from 280000 to 3500000 harvest losses. implementation of climate smart agriculture (CSA) strategies diversify livelihoods to adjust to a changing climate.
farmers. 382,929 farmers accessed climate-
No. of farmers accessing subsidies for appropriate oriented crop insurance.
agricultural inputs increased from 239,000 to 134,808 farmers accessed appropriate The key achievements during 2019-2020 included: Garissa, and Samburu.
1. Improve crop 311,300. agricultural inputs. Crops sub-sector • Over 10,086,752 head of cattle were vaccinated in
productivity through No. of households and acreage under sustainable
implementation of CSA 52,075 Ha of degraded lands reclaimed. • 40,929 farmers accessed climate-oriented crop 30 counties to ensure that the animals were healthy
land management increased for agricultural Area under soil nutrient management insurance (against an annual target of 644,000 farmers). and could withstand/survive diseases associated with
interventions production: increased by 10,286 acres • 134,808 farmers accessed appropriate agricultural seasonal changes.
o Support for the reclamation of 60,000 ha of Area under conservation. agriculture inputs such as certified seeds, fertilizers, and seedlings, • The improved management of manure through the
degraded land; increased by 20,050 acres. representing 186% of the national target of 72,300 adoption of biogas technology reached 227 households,
o Areas under integrated soil nutrient management
increased by 250,000 acres. farmers. This is expected to contribute to increased or less than 1% of the annual target of 16,000 households
o Farm area under conservation agriculture crop productivity that may reduce poverty levels and and 200 abattoirs.
increased to 250000 acres, incorporating food insecurity among farmers.
minimum/no tillage. • Approximately 129 institutions and 196,262 households Fisheries sub-sector:
o Total area under agroforestry at farm level developed or strengthened water harvesting structures • Over 451 (or about 10% of national target of 4,550)
increased by 200000 acres. such as water pans, dam liners, and gutters for fish farming cages were established along with 7,300
Acreage under irrigation increased from 202,000 agricultural use. These interventions were meant to fishponds representing 46% of the national target of
2. Increased crop Area under irrigation increased by 5,013
to 486,000 Ha. increase available water for agricultural use thereby 16,000 fishponds. Good progress was also noted in
productivity through Ha.
Production efficiency from irrigated fields increasing productivity and profitability of the sector. the number of farmers using low-carbon (recirculating)
improved irrigation increased from 50% to 90%. • There was an 8.12% reduction in pre- and post-harvest aquaculture systems which increased by 110 to reach
Improved productivity of pastoralists:
losses against an annual target of 5%. Interventions that 61% of the NCCAP target of 180.
1,969 Ha of rangelands re-seeded. contributed to the reduction in losses included the over • Over 41,496 fishers adopted Insurance products for the
10,000 Ha of rangelands reseeded in 23 ASAL Annual ASALs water harvesting and 10,000 hermitic bags distributed to farmers; and the sector.
counties; storage capacity improved by construction of a grain storage facility and 3 grain storage
Annual ASAL’s water harvesting and storage 1,130,000 M3 from the 38 water pans, warehouses in Trans Nzoia County. These are meant to Across the agriculture sector, the number of households
increased by 25%, from 16 to 20 Million M3 via 6 subsurface dams constructed and 73
help farmers graduate from recurrent food insecurity supported to adopt diversified adaptive enterprises for
small dams and water pans, and 700M3 through bore holes and shallow wells in 11
3. Improve productivity in
and move toward market-oriented commercial farming. sustained livelihoods and nutrition security increased
large multipurpose dams; and ASAL counties.
the livestock sector • The adoption of sustainable land management by 292,106 (or 56% of NCCAP target). Examples of such
Animal disease control and surveillance improved. Over 10,086,752 head of cattle were
through the practices demonstrated mixed results. The reclamation enterprises include indigenous poultry, dairy goats, dairy
Number of customers/beneficiaries/farmers accessing vaccinated in 30 counties in 2019/2020.
implementation of CSA of 52,075 Ha of degraded lands through soil and intensification, tissue culture in banana production, and
climate-oriented livestock insurance increased from 13 million doses of vaccines completed water conservation structures, establishment of pasture seeds, among others. Over 67,175 farmers, 90,000
interventions
18,000 to 105,750. in 2018-2019 demonstration farms, and use of modern conservation pastoralists, and 250 fishers were supported to transition to
Efficiency in dairy management improved for 267,000 18,012 farmer households insured
agriculture equipment was a success, representing specialized and market-oriented outputs in 13 priority value
households. 90,060 head of cattle.
87% of the national target. Other interventions had less chains, including drought-tolerant value chains.
1,297 households adopted improved
Manure management improved through the adoption management of manure. success. Only 10,286 Ha or 4% of the national target of
of biogas technology by 80,000 households and at 250,000 Ha were put under soil nutrient management; Enabling – capacity
least 200 abattoirs. areas under conservation agriculture stood at 20,050 Over 300 fish farmers from Siaya, Kisumu, Vihiga, and
Ha or 8% of the national target of 250,000 Ha; and areas Kakamega were trained on best management practices and
Insurance packages piloted and developed for the
under irrigation increased by a paltry 2,035 Ha, or 0.71% smart aquaculture strategies to increase production and
fisheries sub-sector. 41,496 fishers adopted Insurance
of the national target. productivity with minimal carbon footprints.
Aquaculture production increased: products for the sector.
4. Improve productivity in
the fisheries through No. of cages for fish farming increased from 3,450 793 fish farming cages established. Livestock sub-sector Enabling – policy
implementation of CSA to 8,000. 11,300 fishponds established.
• Over 369 Ha of rangelands were re-seeded in the 23 The National Agricultural (Crops, livestock and fisheries)
interventions No of farmers using low-carbon
No. of fishponds increased by 16,000. ASAL counties against an annual target of 2,000 Ha. Insurance Policy26 was developed. Implementation of
(recirculating) aquaculture systems
No. of farmers using low carbon (reticulating) increased by 140. • Approximately 18,012 households (greater than the the policy will enhance the growth and development of
aquaculture systems increased from 20 to 180. annual target of 17,552 households) were covered with agriculture insurance in the country including participation of
livestock insurance and 90,060 head of cattle (tropical the private sector. Agriculture insurance is one way to de-risk
5. Diversify livelihoods to At least 521,500 households supported to adopt livestock units - TLUs) were insured in the 8 arid counties the agriculture sector and reduce the vulnerability of farmers.
292,106 households supported to adopt
adjust to a changing diversified adaptive enterprises /value chains for of Turkana, Wajir, Marsabit, Tana River, Mandera, Isiolo,
diversified adaptive enterprises.
climate sustained livelihoods and nutrition security.
12 NCCAP - Second Implementation Status Report for the FY 2019/2020 NCCAP - Second Implementation Status Report for the FY 2019/2020 13Chapter Three: Results and Progress Chapter Three: Results and Progress
3.3 Water and the blue economy
Supporting adaptation among smallholder farmers Kenya is a water scarce country with per capita water availability of 647 M3 below the global benchmark of
CASE STUDY 1: through the promotion of sorghum-based beer
1,000 M3. Climate change is likely to contribute to a decline in access to quality water for both domestic and
productive uses.
Table 3: Water and the blue economy
Kenya Breweries Limited (KBL) developed a low-cost beer made from sorghum, a drought tolerant crop. The move to a sorghum-
based beverage created new market opportunities for KBL while providing a cash crop for smallholder farmers that helped to improve
Actions Expected Results by 30th June 2023 Results Achieved as of June 2020 (Cumulative)
livelihoods, enhance food security, and increase climate resilience.
Increased annual per capita water availability
optimum yields. KBL’s increased demand for sorghum (harvested, abstracted and stored) from 647 M3 to
89 hydro geological surveys done across 4
encouraged crop diversification and helped smallholder 1,000 M3achieved through:
counties.
farmers transition from subsistence farming to sustainable o Construction of 12 multipurpose dams (Thwake,
90 Water Resource Monitoring Stations
Thiba, Radat, Gogo, Thuci, Kaiti, Lowaat, rupingazi,
commercial farming. constructed.
Thambana, Maara, Kithino, Kamunu) accounting for
645 boreholes drilled.
1. Increase annual per capita water projected climate impacts (climate proofed
Benefits to the economy under a changing climate 3 medium sized dams constructed.
availability through the infrastructure);
In Kisii, 90 water springs protected; 90 water
The benefits of KBL’s sorghum programme include: development of water o Undertaking national hydrogeological survey to
tanks purchased and distributed, 9 water
• Enhanced household food security: The jilishe kisha infrastructure (mega dams, small identify major strategic aquifers;
schemes established; and 3 water schemes
dams, water pans, untapped o Identifying two locations and mapping for direct
uuze (feed yourself then sell) programme encourages artificial groundwater recharge to increase the
rehabilitated.
aquifers) Nyeri County increased the supply of clean
that sorghum first be used as a household food, with supply of ground water;
water to improve the livelihoods of more than
the remainder being sold to KBL. o Five ground water surveys to establish abstraction
300 households.
• Economic development: KBL paid farmer aggregators levels against recharge; and
62 sub-catchment management plans
about KSh 1.1billion in 2020 for sorghum. These stable o 56 sub-catchment management plans implemented
developed.
to assist local communities to protect wetlands,
income flows for smallholder farmers help to bolster lakes and other water catchment areas.
local economies and boost economic development in
The annual number of climate-proofed water
rural areas. harvesting, flood control, and water storage
• Job creation: The supply chain for Senator Keg – infrastructure increased from 700 to 2,000 through:
KBL introduced Senator Keg, a sorghum-based beer, into including farm operations, post-harvest processing o Integrated catchment approach and ecosystem–
2. Increase livelihoods system based adaptation, structural/mechanical design, such
the local market in 2004. Senator Keg was targeted at low- (threshing), transport, warehousing and other – employs climate proofing, water harvesting as structural catchment protection, especially in the
income consumers as a cheap and safe alternative to illicit over 100,000 people. and water storage infrastructure upper catchments; 3,493 flood early warnings issued.
alcohol consumption that caused health risks and deaths • Improved livelihoods for People living With Disability and improve flood control o Coastal sea walls; and 489 springs developed and protected.
to consumers. The move to a sorghum-based beverage (PWD): KBL is implementing a pilot programme to better o Development of flood early warning systems in areas
provided the opportunity for smallholder farmers that understand how to effectively engage farmers living susceptible to floods (Linked to Climate Action 1:
with disability. DRM)
struggled with unpredictable weather conditions to grow
a drought-tolerant cash crop. The KBL sorghum program Enhanced household access to water, and food
helps to achieve the goal of Kenya’s National Climate Change Adaptation benefits security through water harvesting, including:
Action Plan 2018-2022 to increase food and nutrition The development of a value chain for a sorghum-based beer 300, 000 farm ponds installed 230 earth dams/pans constructed; 23 water
security by diversifying livelihoods and increasing production has increased the climate resilience of local communities. 3. Increase gender –responsive Livelihood systems improved on 60,000 Ha of supply schemes completed/ rehabilitated; and
Sorghum is a drought-tolerant crop and production can affordable water harvesting- degraded land through the development of over 2,091 water tanks purchased and
of drought-tolerant crops.
based livelihood resilience water pans and ponds; and installed in institutions mostly schools for
In 2021, KBL worked with 47,000 smallholder sorghum be maintained in a changing climate. The improvements in rainwater harvesting and storage
programmes Water utility creditworthiness index developed,
farmers in mainly poor and marginalized localities in Busia, household food security, incomes, and jobs help reduce
and toolkits on commercial lending to the water
Homabay, Kakamega, Kisumu, Migori, and Siaya. KBL’s vulnerability to the impacts of climate change. and sanitation sector to attract Public-Private
contracts with smallholder farmers under the sorghum The sorghum program provides an example of private Partnerships designed
program include technical support and the requirement to sector engagement that delivers on the goal of Kenya’s NAP
Water wastage and non-revenue water reduced from Kisii County recorded a decline in non-revenue
use appropriate seed varieties. Capacity building of farmers to enhance the resilience of the agricultural value chain by
the current 43% to 20% through for example: water losses by 2%.
helped to ensure the production of sorghum that was suited promoting drought tolerant traditional high value crops. 4. Promote water efficiency Over 21,049 water meters installed in Kiambu,
This win-win adaptation solution provides KBL with a local (monitor, reduce, re-use, recycle Innovation in water tracking and the
to the local climatic zone while also being of a good quality for Taita Taveta, Marsabit, Kisumu and Nyandarua
and modelling) identification and reporting of leakages; and
Senator Keg beer. KBL helped farmers to source appropriate affordable raw material, while providing a reliable income for Counties.
Awareness programme for water efficiency.
seeds, and provided farmers with up-to-date information smallholder farmers.
about sorghum varieties and the inputs required to produce No. of people and entities accessing good quality water
for domestic, agricultural and industrial use increased
5. Improve access to good quality from 58 to 65% through Taita Taveta sunk 6 boreholes and constructed
water Large scale installation of water meters; and 125.608 km of pipeline
Regular inspection of water quality.
559 Ha of mangrove forests planted or
rehabilitated to protect coastline and sustain
ecosystem services.
2 acres of corals rehabilitated in Wasini.
Deep off-shore fishing fleet increases from 9 to 68 to
Assessments of no-take zones completed.
improve coastal fisheries by:
Survey of reefs and fisheries completed in 7
6. Improve resilience of coastal Addressing overcapacity of artisanal fishing vessels; communities.
communities Rehabilitating and restoring mangrove forests; and National Coral Reef Rehabilitation Protocol
Conserving at least 15% of coastal and marine published in English and Kiswahili.
areas, especially areas of importance for Community-based natural resource
biodiversity and ecosystem services. management includes marine area-based
protection and climate smart practices in
marine areas, such as no-take zones and gear
restrictions (mesh size).
14 NCCAP - Second Implementation Status Report for the FY 2019/2020 NCCAP - Second Implementation Status Report for the FY 2019/2020 15You can also read