Nevada's Mule Deer - Population Dynamics: Issues and Influences - Nevada Department of Wildlife
←
→
Page content transcription
If your browser does not render page correctly, please read the page content below
Nevada’s
Mule Deer

 Population Dynamics:
 Issues and Influences
      Nevada's Mule Deer
      Biological Bulletin No.14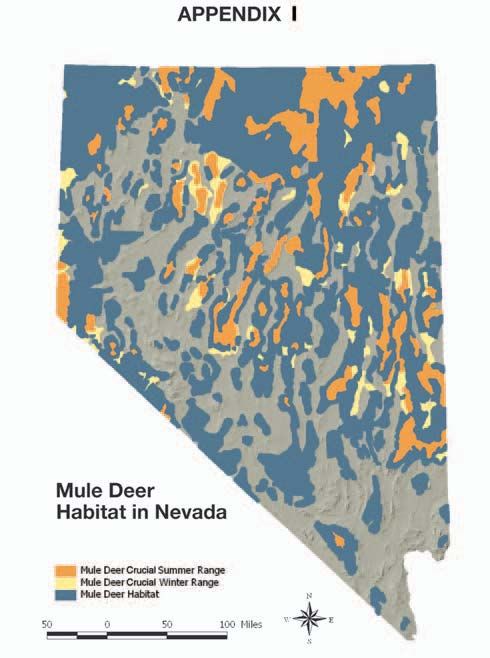
Mule Deer
Population Dynamics:
Issues and Influences
                       By
                  Tony Wasley
              NDOW Big Game Biologist

 This document is the result of studies undertaken with Federal Aid in Fish and Wildlife
                 Restoration funds under Pittman-Robertson Projects.
                                    August 2004

                            Nevada's Mule Deer
                            Biological Bulletin No.14
                                             I
State of Nevada
Kenny C. Guinn, Governor
Department of Wildlife
Terry R. Crawforth, Director
Game Bureau
Gregg Tanner, Chief
Board of Wildlife Commissioners
Tommy Ford, Chairman / Las Vegas
Chris MacKenzie,Vice Chairman / Carson City
Clint Bentley / Las Vegas
Bill Bradley / Reno
James Jeffress / Lovelock
Ron Lurie / Las Vegas
David McNinch / Reno
Eric J. Olsen / Fallon
Mike Riordan / Jiggs
_______________________________________________________________________________________________________________
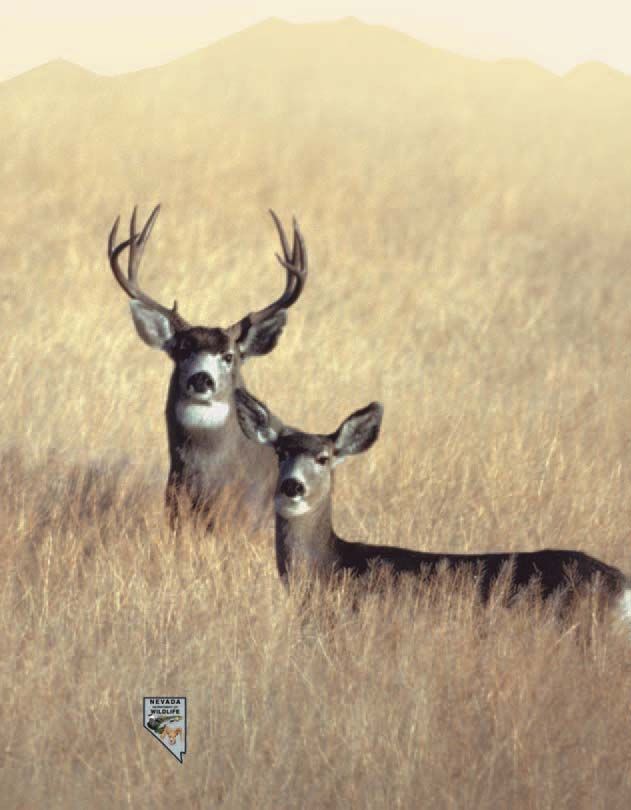
Cover Photo: Buck and doe mule deer standing on weed-infested winter range, a site once occupied by sagebrush and other
native vegetation.
The Nevada Department of Wildlife receives funds from Federal Aid in Fish and Wildlife Restoration Acts. Federal and State
law state that there shall be no difference in the treatment of individuals because of race, color, creed, religion, nation origin,
sex or disability. Anyone receiving alleged discriminatory treatment in any Department program, activity or facility should
report it to either:
Director U.S. Fish & Wildlife Service
Nevada Department of Wildlife Department of the Interior
1100 Valley Road 18th & C Streets
Reno, NV 89512 Washington D.C. 20240
Nevada's Mule Deer
Biological Bulletin No.14
II
Table of Contents
ACKNOWLEDGEMENTS . . . . . . . . . . . . . . . . . . . . . . . . . . . . . . . . . . . . . . . . . . . . . .                  1
INTRODUCTION . . . . . . . . . . . . . . . . . . . . . . . . . . . . . . . . . . . . . . . . . . . . . . . . . . .            2
EVOLUTION AND NATURAL HISTORY . . . . . . . . . . . . . . . . . . . . . . . . . . . . . . . . . .                             2
HISTORY OF NEVADA’S MULE DEER . . . . . . . . . . . . . . . . . . . . . . . . . . . . . . . . . . . .                         2
MULE DEER STATUS . . . . . . . . . . . . . . . . . . . . . . . . . . . . . . . . . . . . . . . . . . . . . . . . .            4
MULE DEER DECLINE . . . . . . . . . . . . . . . . . . . . . . . . . . . . . . . . . . . . . . . . . . . . . . .               5
POOR BODY CONDITION . . . . . . . . . . . . . . . . . . . . . . . . . . . . . . . . . . . . . . . . . . . .                   7
DIGESTIVE PHYSIOLOGY AND DIET . . . . . . . . . . . . . . . . . . . . . . . . . . . . . . . . . . .                           7

Habitat Factors
DEGRADED HABITAT . . . . . . . . . . . . . . . . . . . . . . . . . . . . . . . . . . . . . . . . . . . . . . . .               9
PLANT AGE AND SENESCENCE . . . . . . . . . . . . . . . . . . . . . . . . . . . . . . . . . . . . . . . .                      10
PINYON JUNIPER ENCROACHMENT . . . . . . . . . . . . . . . . . . . . . . . . . . . . . . . . . . . .                           11
OVERGRAZING BY LIVESTOCK . . . . . . . . . . . . . . . . . . . . . . . . . . . . . . . . . . . . . . . .                      12
WILDFIRE AND INVASIVE SPECIES . . . . . . . . . . . . . . . . . . . . . . . . . . . . . . . . . . . . .                       14
TYPE CONVERSIONS . . . . . . . . . . . . . . . . . . . . . . . . . . . . . . . . . . . . . . . . . . . . . . . .              15
INTERRELATED RANGE FACTORS . . . . . . . . . . . . . . . . . . . . . . . . . . . . . . . . . . . . . .                        16
CYCLIC PHENOMENA . . . . . . . . . . . . . . . . . . . . . . . . . . . . . . . . . . . . . . . . . . . . . . .                17
HUMAN POPULATION FACTORS . . . . . . . . . . . . . . . . . . . . . . . . . . . . . . . . . . . . . . .                        22

Factors Reducing Animal Condition and Survivorship
HUMAN INDUCED FACTORS . . . . . . . . . . . . . . . . . . . . . . . . . . . . . . . . . . . . . . . . . .                     23
CLIMATIC EXTREMES . . . . . . . . . . . . . . . . . . . . . . . . . . . . . . . . . . . . . . . . . . . . . . . .             25
DISEASE . . . . . . . . . . . . . . . . . . . . . . . . . . . . . . . . . . . . . . . . . . . . . . . . . . . . . . . . . .   25
PREDATION . . . . . . . . . . . . . . . . . . . . . . . . . . . . . . . . . . . . . . . . . . . . . . . . . . . . . . .       26

Other Issues
HARVEST AND ANTLER DEVELOPMENT . . . . . . . . . . . . . . . . . . . . . . . . . . . . . . . . . 29
COMPETITION . . . . . . . . . . . . . . . . . . . . . . . . . . . . . . . . . . . . . . . . . . . . . . . . . . . . . 32
SUMMARY - THE WHOLE STORY . . . . . . . . . . . . . . . . . . . . . . . . . . . . . . . . . . . . . . . 37
BIBLIOGRAPHY AND LITERATURE CITED . . . . . . . . . . . . . . . . . . . . . . . . . . . . . . . 39
APPENDICES . . . . . . . . . . . . . . . . . . . . . . . . . . . . . . . . . . . . . . . . . . . . . . . . . . . . . . . .AI

                                                 Nevada's Mule Deer
                                                  Biological Bulletin No.14
                                                                  III
List of Figures and Appendices
Figures
Figure 1           Approximation of Nevada’s Mule Deer Population Dynamics Late 1800s - 2003: . . . . . . . . . . . . . . . . .                                                3
Figure 2           Nevada Buck Harvest 1929 - 2003: . . . . . . . . . . . . . . . . . . . . . . . . . . . . . . . . . . . . . . . . . . . . . . . . . . . . .                  3
Figure 3           10 Year Average of Nevada Buck Harvest 1934 - 1998: . . . . . . . . . . . . . . . . . . . . . . . . . . . . . . . . . . . . . .                             4
Figure 4           Identification of Mule Deer Population Increase and Decrease Phases: . . . . . . . . . . . . . . . . . . . . . . . . .                                      4
Figure 5           Spring Fawn Ratios 1973 - 1988 and 1989 - 2004: . . . . . . . . . . . . . . . . . . . . . . . . . . . . . . . . . . . . . . . . .                           6
Figure 6           Three Year Average of Total Annual Precipitation Elko, NV 1890 - 2003: . . . . . . . . . . . . . . . . . . . . . . . . 17
Figure 7           Spring and Summer Precipitation at Elko, NV 1950 - 2002 : . . . . . . . . . . . . . . . . . . . . . . . . . . . . . . . . .                               18
Figure 8           Monthly Precipitation for Jiggs, NV 1981- 1986 and 1991 - 1996: . . . . . . . . . . . . . . . . . . . . . . . . . . . . . 18
Figure 9           Monthly Precipitation for Elko, NV 1981- 1986 and 1991 - 1996: . . . . . . . . . . . . . . . . . . . . . . . . . . . . . 19
Figure 10          Average Monthly Summer Precipitation for Elko, NV 1890 - 2003: . . . . . . . . . . . . . . . . . . . . . . . . . . . . 19
Figure 11          Average Monthly Summer Precipitation at Orovada, NV 1976 - 1985 and 1994 - 2003: . . . . . . . . . . . . 20
Figure 12          Average Monthly Summer Precipitation at Austin, NV 1976 - 1985 and 1994 - 2003: . . . . . . . . . . . . . . 20
Figure 13          Total Summer Precipitation (three year average) at Gibbs Ranch, NV 1958 - 2002: . . . . . . . . . . . . . . . 20
Figure 14          Differences in Photosynthetic Activity Between 1985 and 2000 for Area 7:                                           . . . . . . . . . . . . . . . . . . . . 21
Figure 15          Relationship Between Nevada’s Statewide Mule Deer Population Estimate and Summer
                   Precipitation: . . . . . . . . . . . . . . . . . . . . . . . . . . . . . . . . . . . . . . . . . . . . . . . . . . . . . . . . . . . . . . . . . . . . . . 21
Figure16           Regression of Mule Deer Population Estimate and Summer Precipitation: . . . . . . . . . . . . . . . . . . . . . . 21
Figure 17          Photo of Housing Development on Mule Deer Winter Range: . . . . . . . . . . . . . . . . . . . . . . . . . . . . . . . . 22
Figure 18          Photo of Deer Caught in Wire Fence: . . . . . . . . . . . . . . . . . . . . . . . . . . . . . . . . . . . . . . . . . . . . . . . . . . . 23
Figure 19          Photo of Winter Related Mortalities of Mule Deer: . . . . . . . . . . . . . . . . . . . . . . . . . . . . . . . . . . . . . . . . 25
Figure 20          Coyote Take and Mule Deer Buck Harvest 1969 - 2002: . . . . . . . . . . . . . . . . . . . . . . . . . . . . . . . . . . . . . 27
Figure 21          Coyote Take, Mule Deer Buck Harvest, and Summer Precipitation 1969 - 2002:                                              . . . . . . . . . . . . . . . . . 27
Figure 22          Coyote Harvest and Mule Deer Spring Fawn Ratios 1976 - 2002 :                                       . . . . . . . . . . . . . . . . . . . . . . . . . . . . 28
Figure 23          Buck and Doe Harvest 1951 - 2003: . . . . . . . . . . . . . . . . . . . . . . . . . . . . . . . . . . . . . . . . . . . . . . . . . . . . 30

Appendices
Appendix I         Statewide Map of Mule Deer Distribution and Associated Habitats: . . . . . . . . . . . . . . . . . . . . . . . . . . . A1
Appendix II        Flow Chart Depicting Issues and Influences Affecting Mule Deer Population Dynamics: . . . . . . . . . . A2
Appendix III Additional Mule Deer Readings: . . . . . . . . . . . . . . . . . . . . . . . . . . . . . . . . . . . . . . . . . . . . . . . . . . . . . . . .A3

                                                                  Nevada's Mule Deer
                                                                   Biological Bulletin No.14
                                                                                          IV
Acknowledgments
I am grateful for the knowledge, support, and advice that I’ve received from numerous individuals through-
out this process. The opportunity to develop this document was only possible through the direction and support of
Director Terry Crawforth and Deputy Director Gene Weller. Game Bureau Chief Gregg Tanner and Big Game Program
Coordinator Mike Cox assisted with data, records, and historical information. Special thanks go to the many NDOW
biologists and staff who shared experiences, philosophies, and wisdom and who also provided valuable comments to
improve the manuscript. Management assistants Dar Jan Kerr and Tabby Mays and volunteer Marcial Evertsen provid-
ed key support activities.
The Northern Nevada Chapter of the Safari Club International provided funding for acquisition and analysis
of satellite imagery. Bethany Bradley of Brown University’s Remote Sensing Lab performed the image analysis.
Retired biologists Joe Williams, Mike Hess, Bob McQuivey, Merlin McColm, Don King, and Duane Erickson
provided valuable advice and perspectives.
Photo credits go to a number of NDOW biologists including Ken Gray, Craig Mortimore, and John Elliott.
Funding for this project was derived from tag and license revenues and grant assistance provided by the
Pittman-Robertson Federal Aid in Wildlife Restoration program.
Nevada's Mule Deer
Biological Bulletin No.14
1Introduction
Mule deer are the primary big game species in had read about in the journals of a Canadian trader
Nevada. Mule deer are the most numerous, most wide- named Charles Le Raye. Le Raye had been held captive
spread (appendix 1), and most recognizable of Nevada’s by the Sioux for nearly 14 years. In his journals, Le Raye
wild ungulates. Mule deer populations in Nevada have referenced “mule deer”and provided a physical descrip-
fluctuated greatly over the past 150 years. After reaching tion. Based on the physical descriptions supplied by Le
what was arguably an all-time population high in the late Raye, Rafinesque derived the scientific name.
1980s, mule deer have spent the last 15 years struggling
History of Nevada s Mule Deer
to maintain numbers roughly half of what existed 15
years ago. The suspected causes and culprits contribut- Most people consider current mule deer popula-
ing to mule deer losses are abundant. This biological bul- tions as “low”or “down”. As with any population, the
letin endeavors to address not only the biological factors highs and lows are only high or low relative to some his-
surrounding the recent decline of mule deer in Nevada, torical reference point. In order to determine whether
but the biology of mule deer population dynamics in the current status of mule deer is “up”or “down,” it is nec-
Nevada by thoroughly examining, the evolution and natu- essary to evaluate the complete history of mule deer pop-
ral history of mule deer, the history of mule deer in ulation dynamics in Nevada.
Nevada, and the risks, threats, and issues facing mule deer. Accurate historical data on mule deer popula-
Additionally, the history and philosophies of harvest tions is sparse. Although trappers and pioneers traveled to
strategies will be explored. and through Nevada as early as 1824, true mule deer pop-
ulation census data have only been collected since the
Evolution and Natural History
early 1950s and intensively only since 1976. Despite the
The mule deer is a native of North America. The lack of early census efforts, there are still some useful indi-
species originated on this continent from a primitive deer cators of early mule deer numbers.
that came from Asia probably well over a million years Although there are numerous sources of mule deer
ago. Mule deer most likely evolved in the rugged moun- population data,there are only four main sources of data.
tains of the West where it developed numerous adapta- Each of the four sources covers four different time intervals.
tions to the frequently inhospitable environment. The Mule deer presence and absence data from roughly 1825 -
mule deer is an animal of broken forests and mountain 1850 were recorded quite well by the early pioneers. Many
brush zones, dependent on Mother Nature and other of the early trappers and pioneers kept detailed journals and
environmental forces to provide the disturbances that diaries of their daily activities,which included observations of
stimulate the production of favorable forage and wildlife and wildlife sign (i.e.tracks around water sources).
cover species. These diaries and journals have been evaluated thoroughly
The mule deer was first described by Lewis by multiple individuals and any and all references to wildlife
and Clark in 1804. They gave it the name “mule deer”on have been recorded and evaluated.
account of the length of its ears. The scientific name Mule deer data from approximately 1850 -
Odocoileus hemionus (Odocoileus means hollow tooth 1900 are recorded quite thoroughly in the numerous
and hemionus means half-mule) came several years later newspapers that began as a result of the mining
when Constantine Samuel Rafinesque (1783-1840) sup- booms. Due to widespread interest in wildlife as
plied the name based on descriptions of the animal he potential table fare, the early newspapers did an
Nevada's Mule Deer
Biological Bulletin No.14
2excellent job of documenting mule deer dynamics. NEVADA BUCK HARVEST 1929 - 2003
20000
These historical newspapers have also been evaluated 18000
16000
thoroughly by multiple individuals and all references
Buck Harvest
14000
to wildlife have been recorded and evaluated. 12000
10000
Deer data collection between 1900 and 1950,
8000
although still primarily derived from newspaper 6000
4000
accounts, was assisted by the development of the first 2000
natural resource agency in Nevada, the United States 0
19
19
19
19
19
19
19
19
19
19
19
19
19
19
19
19
19
19
20
29
33
37
41
45
49
53
57
61
65
69
73
77
81
85
89
93
97
01
Forest Reserves. Now known as the Forest Service, Year
the agency was formed in 1906. Annual reports from Figure 2. Total reported buck harvest for Nevada. Early data were based
on expanded 10% questionnaire data while data from 1975 is from
the various “forests” in Nevada provide some of the mandatory questionnaire. Data accuracy generally increases through
time and provides strong insight to population trends.
earliest mule deer population estimates recorded.
among experts that although widely distributed, mule
For most of the last 50 years, 1950 - present,
deer in Nevada existed only in very low densities.
the Nevada Department of Wildlife has conducted
Figure 1 displays an approximation of the
mule deer census activities in association with mule
complete history of mule deer population dynamics
deer management.
in Nevada from the early 1800s through 2003. It is
Despite the varied sources, the compilation
important to recognize that population levels for
and evaluation of these data create a historical perspec-
many of the early years in this figure are mere approx-
tive of mule deer population dynamics that generally
imations. However, the general trend that is depicted
correlates with similar evaluations in most of the west-
reflects expert opinion.
ern states. Although absolute numbers for historical
Perhaps an even more representative depic-
mule deer populations are impossible to create with
tion of the mule deer population fluctuations can be
any degree of certainty, there is general consensus
found in Figure 2. Figure 2 shows buck harvest over a
MULE DEER POPULATION DYNAM ICS OF NEVADA slightly shorter timeline(1929-2003). Although year-to-
1870 - 2003
250000
year variation in buck harvest can be attributed to a
POPULATION ESTIMATE
number of factors including weather, season length,
200000
and season timing, long-term dynamics of buck har-
150000 vest are probably the most accurate index of mule
deer population dynamics that exist for Nevada.
100000
In an effort to display the most representative
50000
long-term trend in mule deer populations in Nevada,
0
10-year averages of buck harvest were calculated and
1870
1875
1880
1885
1890
1995
1900
1905
1910
19 5
1920
1925
1930
1935
1940
1945
1950
1955
1960
1965
1970
1975
1980
1985
1990
20 5
00
are represented by the dark line in Figure 3.
1
9
18
YEAR
Averaging long-term buck harvest data creates a
Figure 1. An approximation of Nevada’s mule deer population
dynamics from the late 1800s to 2003. Although early data are smoother picture of mule deer population dynamics
sparse the United States Forest Reserves began reporting mule deer
estimates in the early 1900s. through time.
Nevada's Mule Deer
Biological Bulletin No.14
310 YEAR AVERAGE OF NEVADA The primary concerns over mule deer popu-
BUCK HARVEST 1934 - 1998
Average Buck Harvest Total Buck Harvest lation declines in Nevada can be attributed to what
20000
Buck Harvest (10 yr, ave.)
18000
Nevada residents have experienced largely over the
16000 last 25 years. Many of Nevada’s hunters have a fond
14000
12000
and vivid recollection of mule deer hunting experi-
10000 ences from the late 1970s through the late 1980s.
8000
6000 Mule deer populations were increasing rapidly during
4000
this time and by the late 1980s, tag quotas were at all
2000
0 time highs. Not only were hunters more likely to
19
19
19
19
19
19
19
19
19
19
19
19
19
19
19
19
19
34
38
42
46
50
54
58
62
66
70
74
78
82
86
90
94
98
draw a tag from the limited draw system implemented
Year
Figure 3. Ten year average of Nevada’s buck harvest from 1934 - 1998. in 1975, but hunters also had a great chance of har-
The 10 year average smoothes the line and portrays the long-term trend in
a more discernable manner. vesting a mature buck. As mule deer populations
began to decline in 1989, hunters hardly took notice.
Mule deer population dynamics are discussed However, mule deer populations continued to slide
throughout this document. For the purpose of dis- and were significantly impacted by the severe winter
cussing the “hows” and “whys” of mule deer popula- event that occurred in 1992 - 1993 at which point,
tion dynamics, it is helpful to break the data with con- sportsmen began to feel the effects of decreased quotas.
sistent trends into specific time blocks or phases. When mule deer populations failed to
The mule deer population increase phases have been respond positively even 4 and 5 years after the winter
classified as “initial increase” and “secondary of 1992 - 1993, many people began to question the
increase.”(figure 4). Similarly, the decrease phases then Division of Wildlife’s management of mule deer.
have been termed,“initial decrease” and “secondary In an effort to “save” mule deer and return to the
decrease.” As we continue to explore the specific “quality” hunts of the 1980s, conservative quotas were
causes of these increases and decreases, we will refer implemented, with post-hunt buck ratio objectives of
specifically to these phases of increase and decrease. 30 and higher. More than 6 years have passed since
the implementation of the first state-wide post-hunt
Mule Deer Status
10 YEAR AVERAGE OF NEVADA
Nevada has higher population levels of mule BUCK HARVEST 1934 - 1998
16000
deer today than during any time during the 125 years fol-
Buck Harvest (10 yr, ave.)
INITIAL DECREASE SECONDARY DECREASE
14000
lowing Nevada’s exploration by Peter Skene Ogden and
12000
Jedediah Smith in 1825 and 1826 respectively (figures 1- 10000
4). Despite having significantly more mule deer today 8000
SECONDARY INCREASE
than during Nevada’s early history, Nevada has been expe- 6000 INITIAL INCREASE
4000
riencing a mule deer population decline since 1988. As
2000
demand for trophy quality mule deer hunting opportunity
0
19
19
19
19
19
19
19
19
19
19
19
19
19
19
19
19
19
increases, the quantity of mule deer continue to decrease,
34
38
42
46
50
54
58
62
66
70
74
78
82
86
90
94
98
Year
heightening the concern for mule deer populations. Figure 4. Identification of the mule deer population increase and decrease phases.
Nevada's Mule Deer
Biological Bulletin No.14
4buck ratio objective of 30, and some hunters continue enough to become part of the population. If the age
to have concerns about the absence of large bucks, to sexual maturity, or breeding age, was delayed or if
leading one to conclude that this conservative strate- the age of sexual senescence (the age at which repro-
gy may not be providing the desired result. ductive potential decreases) was reduced, a decrease
In 2004, Nevada grapples with the notion that in fecundity would be the result. To demonstrate, con-
while current mule deer populations are considerably sider a scenario in which a normal healthy doe mule
higher than historical populations, they are still less deer could conceive at 2 years old and continue pro-
than 50% of what they were 15 years ago. And ducing fawns until she was 10 years old. If, due to
despite significantly curtailing hunting opportunities, poor body condition, a particular doe was unable to
conservative harvest strategies have not resulted in conceive until 3 years of age and could no longer con-
the expected or desired outcome of increased trophy ceive after 8 years of age, the population to which she
quality, and the supply of mule deer in Nevada is far belonged would be experiencing a decrease in fecun-
less than what’s required to meet current demands. dity. A decrease in the incidence of twinning is anoth-
Although it can be substantiated that Nevada has er example of decreased fecundity.
more mule deer now than it did historically, over the Knowing that decreased survivorship and
short term, mule deer have declined significantly. decreased fecundity are the causes of population
declines and what is meant by the two terms, it is
Mule Deer Decline
now possible to examine the data as it relates to each.
In 2004 Nevada has more mule deer than it Measures of reduced survivorship are virtually non-
did 100 years ago, but Nevada’s mule deer popula- existent, though we can sometimes index survival
tions are currently in the midst of a 15-year down- from fawn ratios and buck ratios. Mortality can dis-
turn. Mule deer declines are not unique to Nevada; in criminate by age class or gender or it can affect all
fact, mule deer populations are depressed throughout segments of a population. Vehicle collisions, and a
much of their range. whole host of other sources of mortality seldom tar-
Simply put, populations of animals decline get specific segments of the population. Predation
when mortality (death) exceeds natality (births). and starvation can differentially affect fawns but are
Therefore, we can conclude that either survivorship difficult to measure. Sport harvest targets specific
or fecundity (or both) of mule deer has somehow gender and age segments of the population, and con-
decreased. Decreased survivorship equates to sequently can be carefully monitored and regulated
increased mortality. In the case of mule deer, the by monitoring buck ratios.
increase in mortality could be caused by any number Contrary to what many people believe,
of factors, most of which will be discussed within this wildlife biologists do not count deer to derive popula-
document. Fecundity is a term that applies to the tion estimates. Wildlife biologists classify deer accord-
number of offspring an individual can contribute to a ing to gender and age. It is the gender and age data
population throughout their lifetime. Therefore, that are monitored for changes from year-to-year, to
decreased fecundity means fewer animals are being determine the status of the population. If a source of
conceived, carried to full term, and/or living long mortality was affecting all gender and age segments
Nevada's Mule Deer
Biological Bulletin No.14
5of the population proportionally, ratios in and of them- ure 5). Figure 5 illustrates a 16-year period of the “sec-
selves, would be insufficient to demonstrate reduced sur- ondary increase phase,” in which, for every 100 does
vivorship. However, at some point, if the mortality was in the state’s mule deer population there was an annu-
significant enough, survey sample size would reflect the al average of 47 fawns recruited into the population
population decrease. Further complicating the measures statewide. It also demonstrates that during a different
of decreased survivorship is the concept that different 16-year period, the “secondary decrease phase,” for
sources of mortality could be simultaneously affecting dif- every 100 does in the state’s mule deer population
ferent segments of the population in the same way, result- there was an annual average of 41 fawns recruited
ing in no measurable change in the proportion of animals into the population. Although a difference of 6 fawns
in the population, thus diminishing the biologist’s ability per 100 does may not sound like a large difference, it
to detect decreased survivorship. is important to realize that the magnitude of this dif-
Fortunately, decreased fecundity is some- ference can be significant when it occurs over a 16-
what easier to discern. Fawn ratio data is the most year period, as this has. As an example, if a population
direct measure of fecundity currently available for contained 100,000 does, a difference of 6,000 deer, or
Nevada. Fawn ratios are nothing more than the ratio roughly 3,000 females in the first year alone could
of the number of fawns expressed as a ratio to the result. As we carry that out over the 16-year period
number of does or total adults. If survey data are col- represented, all things being equal, we end up with
lected at a time of year when bucks still have antlers, conservatively 120,000 more fawns or over 60,000
allowing differentiation of bucks and does, fawn ratios potentially productive does. Although this oversimpli-
are typically expressed as fawns per 100 does; where- fication fails to recognize many factors, it accurately
as when survey data are collected during a time of illustrates a point that an annual difference of 6 fawns
year in which bucks have shed their antlers, fawn per 100 does can manifest itself as a huge difference
ratios are expressed as fawns per 100 adults. in a population even over a relatively short period of
The term fecundity really refers to much time if the habitat conditions are right.
more than a simple fawn ratio. Fecundity, as alluded
to above, pertains to an animal’s ability to conceive, Spring Fawn Ratios 1973 - 1988 and 1989 - 2004
carry full term, deliver, nurse and nurture its offspring. 50 47
Fawns/100 Does (Spring)
41
Fawn ratios are only a small metric of changes in 40
fecundity. However, Nevada possesses an extensive
30
data set with observed fall and spring fawn ratios for
20
over 40 years. These data strongly suggest that during
the current mule deer decline, Nevada’s mule deer 10
have experienced a decrease in their fecundity.
0
Observed spring fawn ratios varied greatly during two 1973 - 1988 1989 - 2004
distinct 16-year periods of mule deer history in Figure 5. Spring fawn ratios 1973 - 1988 and 1989 - 2004. Spring fawn
ratios are the number of fawns per 100 does or 100 adults. These values are
Nevada, the “secondary increase phase (1973 - 1988)” fawns per 100 does surveyed via helicopter during spring deer surveys over
two different 16 year periods. Although a seemingly small difference, mule
and the “secondary decrease phase (1989 - 2004)”(fig- deer populations can be hugely impacted by a difference as small as this.
Nevada's Mule Deer
Biological Bulletin No.14
6Poor Body Condition
What causes underlie the fawn ratio differ- bility to predation, and greater likelihood of starva-
ences? The primary culprit in both decreased sur- tion. The impacts of poor body condition are numer-
vivorship and decreased fecundity is poor body condi- ous and well documented. However, determining the
tion. Poor body condition principally refers to insuffi- causes of poor body condition is the first step to recti-
cient energy levels and fat stores to meet the basic fying Nevada’s reduced fawn production.
metabolic demands of life (i.e. thermoregulation, rut-
ting activity, predator avoidance, conception, gesta-
Mule Deer Digestive Physiology
tion, lactation, etc.). There are certainly instances of
and Diet
reduced survivorship that occur independent of poor Mule deer are ruminants. Ruminants are ani-
body condition. For example, mortality caused by mals that possess a four-chambered stomach. Their
vehicle collisions is typically independent of body stomach contains a complex digestive tract with a
condition. However, most instances of reduced sur- rumen that is used as a fermentation vat, which enables
vivorship and virtually all cases of reduced fecundity deer to digest highly fibrous roughage (plants). The
are somehow the result of poor body condition. rumen contains a compliment of digestion aiding bacte-
Research has consistently shown that deer on good ria and protozoa, otherwise called microbes. The
quality ranges have higher rates of ovulation, concep- microbes in the rumen are essential in the digestive
tion, and pregnancy than deer on poor ranges. process. Mule deer eat vegetation that contains cellu-
Research has shown that fawn losses are associated lose, which is virtually resistant to digestive enzymes
with the nutritional condition of the does: whereas and acids typically found in the stomachs of most omni-
(1) well-nourished does lost only about 5 % of their vores, like humans. The fibrous roughage, or vegetation,
fawns; (2) does fed deficient diets during the winter contains potentially available energy in the form of cel-
lost about 33 % ; and (3) does underfed throughout lulose and hemicellulose (long-chain molecules that
their pregnancy lost 90 % of their fawns (Verme exist in the cell walls of plants). However, in the
1962). Studies have also demonstrated that poor absence of the microbes to break down these complex
body condition in mule deer has led to: prolonged molecules and convert them into usable energy, mule
sexual maturity (Morton and Cheatum 1946), delayed deer would derive very little metabolic benefit from eat-
estrus (Severinghaus and Tanck 1964), decreased rates ing vegetation, their only dietary item. Therefore, mule
of ovulation and fetus’ per doe (Julander et al. 1961), deer are critically dependent on the microbes in their
increased rates of fetal absorption, increased rates of rumen to create the energy necessary for life from the
spontaneous abortion, increased incidence of still- digestion of the highly fibrous roughage they consume.
borns (Dasmann and Blaisdell 1954), reduced birth With respect to mule deer digestive physiolo-
weights, increased fawn abandonment (Verme 1962), gy, the digestibility, palatability, crude protein, and-
reduced lactation (Short 1981), and increased over- chemical contents of plants vary greatly. Therefore,
winter losses (Verme 1962). Although much more dif- not surprisingly, mule deer are selective foragers.
ficult to demonstrate empirically, it is likely that poor Mule deer exhibit a high degree of selectivity not only
body condition also predisposes the affected individu- for the plant species they choose to eat, but also for
als to a higher incidence of disease, a greater suscepti- the specific parts of the plant and the time of year
Nevada's Mule Deer
Biological Bulletin No.14
7that a particular plant may be eaten. When deer are local conditions.The plant species replace one anoth-
feeding on browse, they prefer the most tender parts, er in a definite sequence, leading to a shift in the
the new shoots and tips or “leaders.” Leaders are the dominant plant species of an area. In the absence of
most nutritious, most easily bitten off, most flavorful, the disturbance that facilitated the original shift in
and most easily digested part of the browse. plant species composition, a slow but gradual return
The selective foraging behavior of mule deer to successional climax plant species may occur.
translates to very specific habitat requirements. Habitats in Nevada have experienced numerous dis-
Mule deer are a secondary successional species, taking turbance events that have resulted in drastic changes
advantage of plant species that are often the result of in the vegetation. As will be discussed more com-
some type of disturbance. Succession is a natural pletely below, some of the vegetation changes in
change in the species composition of a community Nevada have been hugely beneficial to mule deer,
over time. Secondary succession is the replacement while other changes in vegetation may negatively
of species already in a given area by new species, usu- affect mule deer populations over time.
ally triggered by some change or disturbance in the
Nevada's Mule Deer
Biological Bulletin No.14
8Habitat Factors
Degraded Habitat
The term “degraded,” when referring to mule The 1849 gold rush in California resulted in
deer habitat, means a reduction in potential for the the creation of several trails, routes, and paths across
habitat to produce and support mule deer. Currently, Nevada. With established routes, Nevada became less
a number of factors are negatively affecting the ability intimidating and more navigable. The Comstock Lode
of Nevada’s mule deer habitat to produce and support was discovered in 1859. The Central Pacific Railroad
mule deer. They include range related factors such as was completed in 1869 and not only opened the door
plant senescence (loss of vigor resulting from age), even further for ambitious adventurers but also great-
pinyon juniper encroachment, overgrazing, exotic ly facilitated both the importation and exportation of
invasive species, fire, and type conversions; cyclic phe- livestock. More than 100,000 people had rushed to
nomenon such as drought; and human population Nevada’s mining camps by 1870 and over 35,000
factors such as housing, roads, mining and deer lived in Virginia City and surrounding areas. Livestock
migration impediments. grazing and mining were well under way and acting
Although mule deer habitat today may still be as the main, albeit unintended, catalysts in the cre-
more suitable and more productive than mule deer ation of mule deer habitat in Nevada.
habitats of 100 - 150 years ago, over the last 30 to 40 Mining processes required a great deal of tim-
years mule deer habitat has been on the decline with ber products. Timber was required to construct the
respect to its productive potential. To better under- supports through the hundreds of miles of below
stand the specifics of these assertions, we need to ground shafts. Timber was used to support rails with-
examine the history of Nevada’s mule deer habitats. in the mines and extensively required for the produc-
Some disagreement still exists as to the tion of charcoal to be used in the smelting process of
exact appearance of Nevada’s mule deer habitats the mineral ore. However, the greatest use of timber
prior to European man’s arrival and subsequent dis- was fuel wood. The populations associated with
turbance. Some people are inclined to believe that the mining camps were huge. With no such
Nevada was a huge expanse of grasslands while oth- thing as natural gas heaters, propane fired fur-
ers hold to the view of a sea of sagebrush 8 feet naces, and being too far from coal, fuel wood
high and taller. Some believe Nevada seldom expe- was essential in home heating and cooking.
rienced fires and this contributed to the expanses of Before 1900 alone, more than 16 million cords
decadent sagebrush, while others believe the fre- of wood and 3.5 billion board feet of lumber
quent fires started by Native Americans and lighten- were harvested for wood consumption, bullion
ing maintained Nevada’s grasslands. Although it is production, and ore processing (Hess 1990).
likely that each belief holds some validity, neither For perspective, that’s enough wood to build a
scenario portrays an abundance of habitat that wall 12 feet wide and 22 feet high around the
would be very beneficial for mule deer. Thus, it is entire state of Nevada (Hess 1990). Further evi-
assumed very few mule deer existed in Nevada his- dence of the extent of tree removal, exists in
torically. However, as European man began expand- the fact that in some areas of the state, up to
ing and exploring the Great Basin, habitat for mule 90% of the modern pinyon-juniper woodland is
deer was rapidly being created. less than 150 years old.
Nevada's Mule Deer
Biological Bulletin No.14
9The removal of trees and associated distur- plants, that are the current year’s growth. Deer prefer
bances, resulted in an immediate increase in sage- leaders to the other parts of the plant, as they are
brush habitat. “Sagebrush habitat” includes sagebrush much more tender and thus more easily digested. As
and other browse species such as bitterbrush, service- forage plants mature, their cell walls thicken. The
berry, snowbrush, and snowberry. It also includes a parts contained within the cell are up to 98%
host of grasses and forbs that exist in the interspaces digestible (Short and Reagor 1977). However, the cell
between the browse. Mule deer are browsers and wall contains such components as cellulose, hemicel-
benefit when shrub species are productive compo- lulose, lignin, cutin, pectin, and tannin.The rough feel
nents of their range (Dietz and Nagy 1976). The and appearance of leaves on deer browse is the result
habitats that resulted from tree removal were ideal of high amounts of cell wall materials. Some of the
for mule deer. cell wall constituents can be broken down by the
Simultaneous with the widespread vegetation microbes in the stomach, while others cannot. Lignin,
impacts from mining, large numbers of sheep and cat- a non-carbohydrate polymer that binds the cell togeth-
tle were trampling Nevada’s landscape at an unprece- er, is indigestible. The older a plant becomes, the
dented rate. Livestock populations irrupted during more cell wall material it contains, hence, the older a
the 1870s and 1880s reaching estimated levels of plant, typically, the less digestible.
700,000 cattle and 400,000 sheep. Domestic livestock Additionally, older age plants typically possess
operations were developed to serve the new markets greater amounts of secondary compounds. Secondary
the mines and mills provided. Livestock numbers compounds are chemical constituents in the plant
peaked between 1910 and 1930 with 3 to 4 million that make the plant taste bad or smell bad in order to
sheep grazing Nevada ranges immediately following protect the plant from herbivory (being eaten). As
World War I. sagebrush ages, it produces increasing amounts of
As a result of the early mining and grazing volatile oils as an anti-herbivory mechanism that
activities, wide-spread, landscape scale vegetation dis- decreases its palatability to animals that might feed on
turbance resulted in a seral plant community with a it. Sagebrush is a key browse species for deer. The
vastly expanded feeding niche for mule deer. Mule high levels of volatile oils don’t appear to deter mule
deer benefited from this increased feeding niche and deer from eating sagebrush. However, the volatile oils
peaked in the late 1950s. Since that peak, several dif- in sagebrush can have a bactericidal effect on the
ferent range related factors have resulted in degraded microbes in the rumen (Nagy et al. 1964).
mule deer habitats. Consequently, mule deer trying to meet metabolic
demands by eating old age sagebrush are quite possi-
Plant Age and Senescence
bly getting less nutrients and energy from their diet
Mule deer are a highly selective browser very due to the fact that they are killing the very microbes
dependent on rumen microbes to derive energy from they are dependent on for digestion.
plant matter. For browse species plants, mule deer Further complicating the issue of old age
consume primarily plant “leaders”. “Leaders” are the plants is the observation that many of the preferred
long thin twig like extensions from most browse browse species lose vigor with age. Bitterbrush, in
Nevada's Mule Deer
Biological Bulletin No.14
10many places the most important browse species for Every year, thousands of acres of mule deer
mule deer (Hormay 1943, Nord 1965), ceases its pro- habitat are impacted by PJ encroachment. Among the
duction of leaders and seeds as it ages. At 60 years most pronounced vegetation changes in the past 130
old, seed production and leader growth begin to years has been the increase in both distribution and
decline(McConnell and Smith 1977). In grazed areas density of juniper and pinyon (Miller and Tausch
seed production and leader growth of bitterbrush 2001). Prior to about 150 years ago PJ woodlands
may begin declining at a much younger age (Clements were more open. The most important factor con-
and Young 2001). Not only does the lack of leaders tributing to this openness appears to be a much high-
present obvious problems for foraging mule deer, but er fire frequency during this period (Gruell 1999,
the lack of seed production significantly reduces a Tausch 1999). The expansion of PJ has more than
plant’s ability to replace itself or recruit new plants. tripled the area dominated by PJ woodlands over the
Old age vegetation presents a number of last 150 years (Tausch 1999). PJ woodlands now
problems to mule deer. As a result of reduced leader cover nearly 18 million acres in the Great Basin
production, mule deer have less forage available to (Tueller et al. 1979), cover greater than it was before
them. The limited forage is less palatable, is less European settlement (Tausch et al. 1981). Both
digestible, and may kill microbes in the rumen that are species are extremely aggressive and, once estab-
so essential in digestion. Additionally, as a result of lished, reduce understory productivity (West 1984,
their old age, many browse species are experiencing Vaitkus and Eddleman1987), cover (Driscoll 1964),
reduced seed production and reduced ability to diversity (Burkhardt and Tisdale 1969), increase site
replace themselves or recruit new plants over time. aridity (Angell and Miller 1994), and accelerate soil
erosion (Buckhouse and Mattison 1980). Losses of the
Pinyon Juniper Encroachment
understory productivity and diversity are particulary
Pinyon pine and juniper, collectively referred detrimental to mule deer.
to as pinyon-juniper or more simply PJ, are an inte- The understory being lost to PJ encroach-
gral part of mule deer habitat. Studies examining ment contains grasses, forbs, and most importantly
winter mortality in Nevada mule deer have conclud- mule deer browse species such as sagebrush and bit-
ed that mule deer wintering on range that contains a terbrush. Nearly 25 years ago Tausch et al. (1981)
PJ component, experience less winter mortality than
similar areas without PJ(pers. Comm. Mike Hess,
Nevada Department of Wildlife Game Bioloists ret.).
During severe winter conditions, PJ offers mule deer
a more favorable microclimate in which to seek
shelter from the elements and thermoregulate. For
that reason, a term often applied to PJ extant in
mule deer habitat is “thermal cover”. However,
when it comes to PJ cover, there can be too much of
a good thing.
Nevada's Mule Deer
Biological Bulletin No.14
11reported that substantial reductions in the forage for fer. However, mule deer habitats appear to have been
both game and livestock had apparently occurred in negatively affected by both types of selective grazing.
the previous 50 to 70 years. This loss in forage is a Early season grazing by livestock tends to
direct effect of increased tree density and dominance focus grazing pressure on grasses and forbs. Early sea-
resulting in exclusion of the understory. The loss of son typically refers to spring and early summer.
understory has further reduced the fuel and conse- “Forbs” are herbaceous plants other than grasses.
quently fire frequency. Decreases in fire frequency Livestock prefer grasses and forbs in the spring
increase the rate of tree encroachment even more. because following normal levels of winter moisture,
Tausch et al. (1981) concluded that barring some grasses and forbs emerge in the spring, tender and
major environmental change, this forage reduction green, palatable, highly digestible, and provide a good
will probably continue until trees dominate most of source of nutrients. Mule deer benefit from the con-
the sites favorable to their survival. sumption of forbs throughout the year and are espe-
The rate of mule deer habitat loss is difficult cially assisted by consumption of grasses and forbs in
to observe. Without photo plots, the magnitude of the spring and summer (Austin and Urness 1985).
tree dominance might go understated. Fortunately, However, heavy livestock use can result in significant
during the middle stages of development when wood- reductions in species richness primarily by decreases
lands contain understories of native shrubs and forbs, in the amount of grasses and forbs in an area (Austin
they can be successfully treated, especially with fire. et al. 1986, Cottam and Evans 1945, Robertson and
However, once sites become tree dominated wood- Kennedy 1954). The reduction in plants is due to
lands, treatment options become more difficult and their removal via consumption by livestock and also
more expensive. by other more complicated means. Many grasses and
forbs are annuals that rely on seed production to per-
Overgrazing by Livestock
sist from year-to-year. As annual grasses and forbs dry
Although livestock grazing and the distur- out and die, they set seeds that lie dormant until the
bance associated with it, was instrumental in creating following spring. If grasses and forbs are consumed
and maintaining historical mule deer habitat in by livestock prior to seed development, reductions in
Nevada (Gruell 1986), the impacts from long-term seed production may result.
grazing have reduced the quality and capacity of mule Perennial grasses and forbs, although able to
deer habitats (Cottam and Evans 1945, Robertson and persist longer in the absence of annual seed produc-
Kennedy 1954). Selective feeding is one such way tion, also suffer from continued selection by livestock.
livestock grazing has impacted mule deer habitat As perennial grasses and forbs experience a high inci-
(Bowyer and Bliech 1984) . Most herbivores exhibit dence of grazing, their seed production may also be
preferences with respect to not only the species they limited. Although not as immediate as the result of
consume but also the parts of the plant they con- limited seed production in annuals, the long-term
sume. Livestock exhibit grazing preferences for both effects of limited seed production in perennials can
certain plant species and for particular plant parts. be equally detrimental to the persistence of these
Depending on the ecosystem and the time of year species. Not only can seed production be limited by
that the grazing occurs, the effects of grazing can dif- selective early season grazing, but direct mortality
Nevada's Mule Deer
Biological Bulletin No.14
12as a result of excessive utilization and/or complete been recognized as limited in quantity and quality
plant removal by consumption or hoof action can browse, livestock are reducing the already limited
also occur. Selective foraging by livestock on win- supply even further. The ramifications of reduced
ter allotments has resulted in the severe reduction forage availability are obvious. Heavy utilization of
of grasses and forbs on many of Nevada’s range- bitterbrush leader growth can be especially harm-
lands. Perennial bunchgrasses are particularly sus- ful to mule deer when it occurs on “transitional
ceptible to winter utilization by livestock, and range” (habitat used by mule deer when in route
their abundance is frequently diminished as a from summer range to winter range), or when it
result. occurs on winter range. Dasmann and Blaisdell
From a mule deer habitat perspective, one (1954) found steep declines in fawn survival when
of the more significant results of selective foraging bitterbrush utilization exceeded 34 % .
by livestock is the change in species composition The loss of fawn hiding cover due to over-
and proportional abundance of plant species grazing has also been documented (Bowyer and
inhabiting an area. Consequences of selective for- Bleich 1984). The strategy employed by mule deer,
aging by livestock that have been documented white-tailed deer, antelope, and elk to ensure the
include; decreased species richness, decrease in survival of their offspring is called “hiding.”
palatable species, increase in unpalatable species, However, the hiding strategy evolved in the
and a decrease in plant productivity (Cottam and absence of domestic grazers. The over-utilization of
Evans 1945, Pickford 1932, Reynolds and Trost some habitats (aspen stands or riparian areas) by
1980, Robertson and Kennedy 1954). Each of livestock may subject fawns to heightened levels of
these effects of livestock grazing can decrease the danger. The heightened danger may come in the
suitability of a habitat for mule deer. form of increased risk to predation or may simply
Late season or hot season livestock grazing be an increased metabolic cost of thermoregulation
presents another, perhaps more significant, prob- as the result of the loss of shade cover. In either
lem for mule deer. Mule deer also forage selective- event, losses of hiding cover can result in increased
ly. Mule deer prefer the leaders of browse species mortality whether direct, as in the case of preda-
such as; bitterbrush, serviceberry, snowberry, and tion, or indirect, as in the case of starvation.
sagebrush. As mentioned above with regard to
plant senescence, leader growth is more digestible,
more palatable, provides more nutrition, and has
fewer secondary (anti-herbivory) compounds than
other parts of the plant. Livestock also turn to
leader growth for food, for all the same reasons as
mule deer and coupled with the fact that by late
season, most grasses and forbs have “cured” and are
no longer suitable as high quality forage.
Consequently, in an environment which has already
Nevada's Mule Deer
Biological Bulletin No.14
13Wildfire and Invasive Species
Wildfire plays an important role in many and Rose 1999, Gruell 1999). The loss of fire as a dis-
ecosystems. However, the timing, intensity, and fre- turbance mechanism to reset succession and restore
quency of fire tend to vary greatly between ecosys- native grasses and forbs plus the continual removal of
tems. The vegetational composition in an ecosystem grasses and forbs by livestock, resulted in a shrub
can reveal significant information as to the specific dominated landscape. The absence of a native under-
role of fire in an area. For example, very productive story coupled with grazing related disturbances
sites with a high number of fire tolerant species sug- opened many of the sites to invasion by non-native
gests a relatively high frequency of fire. Conversely, cheatgrass. Cheatgrass is among the most invasive
unproductive sites with few fire tolerant species sug- introduced species in the Intermountain West.
gests a low fire frequency and likely a reduced role of Cheatgrass, named for its ability to “cheat “ other
fire in that system when compared with the former. plants of water and nutrients, increases fire frequency
While the historical role of fire in Nevada can be (Whisenant 1990) and out-competes native perennial
debated most would agree that fire frequencies in grasses (Reichenberger and Pyke 1990).
Nevada were largely determined by fuel loads. The Consequently, cheatgrass which thrives in the pres-
more productive sites burned perhaps once every 20 ence of fire, has affected the conversion of millions of
years or less and the least productive sites going per- acres of sage-brush steppe to annual communities.
haps as long as 300 years between fires. However, as Nevada’s long-term buildup of woody vegetation
new land-uses changed the vegetation, changes in the when combined with drought and fire-prone invasive
fire timing, intensity, and frequency also occurred. species, has resulted in significant changes to the veg-
Prior to European-American settlement, fire etative composition due to catastrophic wildfires. As
influenced vegetation by suppressing shrubs and a result of these fires, woody shrub species such as
trees, and promoting the production of forbs (Cooper sagebrush and bitterbrush are being completely lost
1961, Daubenmire 1968,Vogl 1979,Arno 1985). from sites as they become replaced by virtual mono-
However, as studies of fire history have shown, with cultures of fire prone weeds like cheatgrass and
the arrival European man, a pronounced reduction in tansy mustard.
the size and frequency of fires occurred. The primary
factor attributed with the reduction in size and fre-
quency of fires, was livestock grazing (Julander 1962,
Urness 1976, Gruell 1985). Livestock removed the
fine fuels that were instrumental in fire ignition and
travel. The development of man-made fuel breaks
such as roads and irrigated land, combined with the
advent of fire fighting agencies to reduce the role of
fire even further.
The reduction in fire coupled with continued
livestock grazing has resulted in major shifts in the
vegetational composition in much of Nevada (Miller
Nevada's Mule Deer
Biological Bulletin No.14
14Cheatgrass and other fire prone weeds out- reduced in size from 184,320 acres in the early 1960s
compete native species (Reichenberger and Pyke to a mere 22,400 acres in 2004. Commensurate with
1990) and dominate a site. Site domination by cheat- the habitat loss, mule deer numbers have declined.
grass not only spells trouble for native plants exclud- Although during the late 1980s most management
ed by the cheatgrass but it also negatively affects all areas in Nevada experienced all time population highs
the animal and insect species dependent on those in mule deer, Area 6 did not. The Area 6 mule deer
native plant species. As mentioned above, the pres- population was already realizing the effects of
ence of cheatgrass also greatly increases the fire igni- reduced carrying capacity that resulted from fire-
tion potential of a site. Cheatgrass, native to Asia, has caused habitat losses. Population estimates today sug-
an entirely different phenology than most native plant gest that Area 6 contains only about 1/3 of the mule
species. Phenology refers to the timing of growth, deer it once did and data suggests fire related habitat
reproduction, and curing of a plant species. loss is the main reason.
Cheatgrass has a much earlier phenology than native Type Conversions
grass species. Cheatgrass turns green earlier thus “Type conversion” is a term that applies to
“cheating” its competitors of resources, and conse- the conversion of a vegetation type in an area from
quently matures and cures earlier. The earlier curing one “type” to another. The most common type conver-
date is especially problematic with respect to fire. sion that Nevada has experienced is from mechanical
The cured cheatgrass is a prime ignition source and and herbicide (2,4,D) assisted conversion from a
excellent fuel source for wildfire. native upland type consisting of native browse, forbs,
Once a site with cheatgrass and tansy mus- and grasses, to a nonnative monotypic stand of crest-
tard has burned, virtually all native plant species are ed wheatgrass. Although seldom performed today,
excluded as a thick mat of highly flammable low during the 1960s millions of acres of mule deer transi-
value wildlife habitat dominates. Further complicat- tional range and winter range were sprayed with her-
ing the issue is the fact that once these sites burn, bicide and reseeded with crested wheatgrass.
they pose an even greater threat for future ignition Additionally, crested wheatgrass was often used as the
sources, they burn more readily, and the fires destroy primary seed component in post fire revegetation
even more native habitat by creating larger and larger efforts.Although the crested wheatgrass seedings pro-
fires. The cheatgrass fire cycle in Nevada presents an vided a needed forage base for livestock, the seedings
ever-increasing, self-perpetuating cycle of permanent resulted in the conversion, and degradation, of mil-
habitat loss, more fire, and more permanent habitat lions of acres of mule deer habitat. Many of the areas
loss. Portions of Area 6 of critical deer winter range sprayed with herbicide were formerly dominated by
in western Elko County that burned 40 years ago are sagebrush and bitterbrush; two key mule deer browse
still dominated by cheatgrass today. species. Although many of these “type converted”
Since the 1960s, Nevada has experienced rangelands have regained many of their previously
wildfires unprecedented in size and intensity. For existing native plant species, many crested wheatgrass
example,Area 6 has had over 660,000 acres burned seedings have yet to experience the return of more
between 1999 - 2001. The crucial winter ranges for preferable mule deer forage.
the deer in the southern portion of Area 6 has
Nevada's Mule Deer
Biological Bulletin No.14
15Interrelated Range Factors
Each of the six aforementioned range related ment by reducing fire frequencies and decreasing the
factors, independently present mule deer with signifi- competition from other plants.
cant challenges that reduce carrying capacity. Overgrazing also facilitates invasive species
However, many relationships exist between these fac- (Pickford 1932, Robertson and Kennedy 1954). In the
tors that make their collective influences even absence of disturbance native systems are very
greater. For example, the effect of pinyon juniper resilient to invasion by exotic weeds. However, when
encroachment exacerbates the effects of plant senes- native systems are disturbed, they become highly sus-
cence (old age). As pinyon and juniper invade or rein- ceptible to invasive species. Although seeds from
vade areas, they further inhibit mule deer browse invasive species are plentiful, in the absence of dis-
species from becoming established. Pinyon and turbance, establishment can be difficult. Livestock
juniper outcompete most plant species in the under- generated disturbances greatly enhance a site’s sus-
story by robbing them of sunlight, moisture, and nutri- ceptibility to invasion by unfavorable species. High
ents. As this continues, significant mortality of browse use areas like feeding and watering areas are com-
species occurs, the recruitment of new browse is monly inhabited by invasive plants. Not only does
restricted, establishment of forbs and grasses is limit- the disturbance generated by livestock increase the
ed, and the overall site diversity is radically decreased, opportunities for establishment of invasives, but live-
leaving less forage for mule deer. Furthermore, the stock themselves provide effective dispersal of seeds
mule deer forage that remains is not only reduced in from invasive species. Livestock disperse seeds from
quantity but also is of reduced quality. invasive species on their legs, underside, and tails.
Another interaction between factors is found There are the obvious negative impacts associated
between overgrazing and pinyon juniper encroach- with invasive species such as; loss of native habitats,
ment. Overgrazing is believed to facilitate pinyon loss of species diversity, and loss of the animal
juniper encroachment via several mechanisms. species associated with the native flora. However, in
Livestock commonly remove the grasses that exist in the case of cheatgrass, the potential for fire and fur-
the spaces between the trees. The grasses, when pres- ther habitat loss greatly exceeds the typical rate of
ent, act as a fine fuel source that carries fire from tree habitat losses that result from invasive species alone.
to tree. In the absence of the fine fuel source that The effect of livestock grazing on vegetation
grasses provide, fire cannot occur as frequently in the succession and senescence is probably the strongest
pinyon juniper cover type (Campbell 1954, Ellison and most detrimental of the interrelated factors. As
1960, Burkhardt and Tisdale 1976) and when fire does livestock continually remove the more palatable
occur, in the absence of fine fuels, it doesn’t travel species from a site, they are effectively increasing the
well. Additionally, with livestock removing the grasses abundance and proportion of the unpalatable species
and forbs that exist in these interspaces, the pinyon (Cottam and Evans 1945, Robertson and Kennedy
and juniper realize a competitive advantage (Cottam 1954). Within a given grazing season, the effects of
and Stewart 1940, Madany and West 1983). Therefore, selective herbivory can be relatively minor. However,
the reduction of plant materials by livestock between after years (100+) of selective foraging in a given area,
pinyon and juniper facilitates further tree encroach- many of the highly nutritious and highly palatable
Nevada's Mule Deer
Biological Bulletin No.14
16You can also read