Non tax revenue trends, 2000 2018 - OECD iLibrary
←
→
Page content transcription
If your browser does not render page correctly, please read the page content below
Revenue Statistics in Africa 1990-2018/Statistiques des recettes
publiques en Afrique 1990-2018
© OECD/ATAF/AUC 2020/© OCDE/ATAF/CUA 2020

                                                        Chapter 2

       Non‑tax revenue trends, 2000‑2018

                                                                    87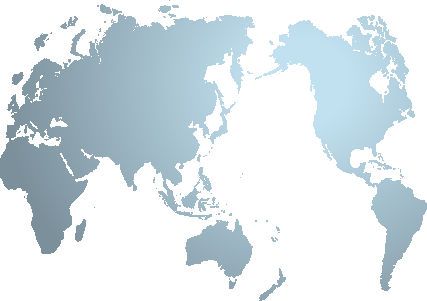
2. NON-TAX REVENUE TRENDS, 2000-2018/TENDANCES DES RECETTES NON FISCALES, 2000-2018

Introduction
             A complete picture of public finances requires statistics that go beyond taxation,
        especially in the case of many African countries that obtain substantial revenues in the form
        of grants or royalties from oil and minerals. Revenue Statistics in Africa collects statistics on
        both tax and non‑tax revenues, non‑tax revenues being government revenues that do not
        meet the OECD definition of taxation. Although data on non‑tax revenues might not come
        from the same sources or have the same reliability as tax statistics (see Box 2.1), they need to
        be included in any accounting of a country’s total financial resources. This chapter provides
        cross‑country comparisons of non‑tax revenues for the countries in this publication.1
           The main categories of non‑tax revenues2 reported as part of this project are (see also
        Annex B):
        ●●   grants from foreign governments or international organisations (budget aid, food aid, capital
             transfers, current transfers, project grants, programme grants, international debt relief, etc.)
        ●● rents   and royalties (such as oil or mining royalties)
        ●● other property income (interest, dividends and other returns on government investment)
        ●● sales   of goods and services (which include some administrative fees)
        ●● fines   and penalties (including fines and penalties due to tax violations)
        ●● miscellaneous    and unidentified revenues (non‑tax revenues that cannot be classified
             according to the other categories).

                                Box 2.1. Non‑tax revenues and data reliability

    Data on non‑tax revenues are often less detailed than tax revenue data. Some countries might have
  aggregate figures for total non‑tax revenues in some years but do not break this information down beyond
  grants and other non‑tax revenue categories. This may be because data on non‑tax revenues often comes
  from several different sources. Revenue Statistics in Africa indicates cases where total non‑tax revenues are
  reported but may be incomplete.
    Non‑tax revenue data are not necessarily subject to the same level of scrutiny as tax revenues. Many types
  of non‑tax revenue are not part of the main budget process, nor are they defined by legislation so they are
  not subject to the same oversight mechanisms as tax revenues. Non‑tax revenues that are not accompanied
  by legal compulsions do not always require the same documentation.
    Non‑tax revenues are often under the responsibility of different authorities than tax revenues, so there is
  not necessarily a separation made between revenues and expenses. Some revenues, such as administrative
  fees, might be used as cost‑recovery mechanisms and subtracted from cost figures rather than reported as
  revenues. This could be the case for local governments or other public institutions for which data only exists
  on net transfers of funds to the central government.
    Grants, legal settlements and mining and oil contracts also often involve large payments by external
  entities such as multinational corporations and foreign governments that do not necessarily have incentives
  to maintain transparency. There could also be incentives to collude with local authorities to conceal costs. In
  addition, some countries may negotiate large payments from resource extraction payments as a lump sum that
  bundles together many categories of both tax and non‑tax revenue, making detailed breakdowns less feasible.

                                                                       Revenue Statistics in Africa 1990-2018 © OECD/ATAF/AUC 2020
88                                                  STATISTIQUES DES RECETTES PUBLIQUES EN AFRIQUE 1990-2018 © OCDE/ATAF/CUA 2020
2. NON-TAX REVENUE TRENDS, 2000-2018/TENDANCES DES RECETTES NON FISCALES, 2000-2018
Non‑tax revenues as a percentage of GDP
In 2018, non‑tax revenues as a percentage of GDP varied significantly among
the 30 countries included in this publication. They ranged from 25.2% of GDP in Lesotho
to 0.6% of GDP in South Africa. In every country except Lesotho, the Republic of the Congo,
Botswana, and Equatorial Guinea, non‑tax revenues were lower than tax revenues (Figure 2.1).
On average, the amount of non‑tax revenue collected in each country was 49.9% of the
amount collected in tax revenues.
Figure 2.1. Total tax and non‑tax revenue by country, 2018
Percentage of GDP
Total non-tax revenue Total tax revenue
% of GDP
35
30
25
20
15
10
5
0
Note: Non‑tax revenue includes sub‑national non‑tax government revenues for Eswatini, Kenya, Mauritius and Morocco, the only
countries for which such revenues are reported. In 2018, these represented, respectively, 1%, 16%, 3% and 45% of all non‑tax revenue
collected for each country. Mauritania, Nigeria and South Africa reported some local and regional taxes, but no local and regional non‑tax
revenues.
1. Non‑tax revenues for Botswana, Eswatini, Lesotho and Namibia include funds from excises and customs duties collected by South Africa
and then transferred to them through the Southern African Customs Union (SACU) revenue‑sharing agreement.
2. Figures for grant revenues and oil revenues for the Republic of the Congo are those reported by the IMF in its April 2020 World Economic
Outlook.
The tax‑to‑GDP ratios and non‑tax‑to‑GDP ratios need to be interpreted with caution for some countries due to incomplete data. See the
country tables in Chapters 5 and 6 for further information.
Source: Table 4.1 in Chapter 4 and Table 6.1 in Chapter 6.
12 https://doi.org/10.1787/888934181660
Different clusters of countries appear when looking at the relationship between
tax revenues and non‑tax revenues as a percentage of GDP (Figure 2.2). Countries with
exceptionally high oil revenues, such as Chad, the Republic of the Congo and Equatorial
Guinea, are among those with the lowest tax‑to‑GDP ratios. Countries that are net recipients
of revenues through the Southern African Customs Union (SACU) also have high non‑tax
revenues (see further explanation in the section on SACU revenues). Upper middle‑income
countries that are not major oil producers tend to have less of both grant revenues and
resource revenues, which may increase the need to mobilise domestic resources via taxation.
Revenue Statistics in Africa 1990-2018 © OECD/ATAF/AUC 2020
STATISTIQUES DES RECETTES PUBLIQUES EN AFRIQUE 1990-2018 © OCDE/ATAF/CUA 2020 892. NON-TAX REVENUE TRENDS, 2000-2018/TENDANCES DES RECETTES NON FISCALES, 2000-2018
Figure 2.2. Total tax and non‑tax revenue by country, 2018
Percentage of GDP
High oil production Higher GNI per capita SACU net recipients Other African countries
Non-tax revenue as % of GDP
30
Net recipients of transfers from SACU Common Revenue Pool
LSO
25
Oil production above 15% of GDP
COG
20
BWA
15
GNQ
SWZ NAM
10 GNI per capita above USD 3 000
RWA
NER MRT TGO
TCD
CPV SYC
EGY
5 BFA MUS MAR
NGA COD GHACMR SEN TUN
MDG
KENMWI
CIV
UGA ZAF
MLI
0
0 5 10 15 20 25 30 35
Tax-to-GDP ratios as % of GDP
Note: See footnotes to Figure 2.1 and country tables in Chapters 5 and 6 for further information.
Source: Authors’ calculations based on data from (OECD/ATAF/AUC, 2020[1]), “Revenue Statistics in Africa: Comparative tables”, OECD Tax
Statistics (database), https://doi.org/10.1787/be755711-en.
12 https://doi.org/10.1787/888934181679
While the Africa (30) average tax‑to‑GDP ratio rose between 2010 and 2018, average
non‑tax revenues have gone down substantially (Figure 2.3). After peaking in 2012 at 9.2%
of GDP, average non‑tax revenues dropped to 6.0% in 2016 before reaching 6.5% in 2018. This
decline was driven by declines in rents and royalties and in grant revenues as a percentage
of GDP. In 2018, grant revenues were at 1.3% of GDP, their lowest point since 2010. Rents and
royalties were at 1.9% of GDP, 1.1 percentage points lower than in 2012, having rebounded
only slightly from their 2016 low point. These declines have been enough to cause total
revenues to go down over this period, leading to increased deficits and indebtedness (Box 2.2).
Different sources of non‑tax revenues are associated with different types of risk, such as
susceptibility to sudden changes, or vulnerability to economic shocks and political changes.
Figure 2.5 shows the contribution of each sub‑category to total non‑tax revenues for each
country. Four distinct groups are apparent in these data:
●● Twelve countries received a majority of their non‑tax revenue in the form of grants in 2018
(in descending order, Rwanda, Togo, Niger, Chad, Burkina Faso, Senegal, the Democratic
Republic of the Congo, Madagascar, Malawi, Mali, Côte d’Ivoire and Uganda).
Revenue Statistics in Africa 1990-2018 © OECD/ATAF/AUC 2020
90 STATISTIQUES DES RECETTES PUBLIQUES EN AFRIQUE 1990-2018 © OCDE/ATAF/CUA 20202. NON-TAX REVENUE TRENDS, 2000-2018/TENDANCES DES RECETTES NON FISCALES, 2000-2018
Figure 2.3. Africa (30) average non‑tax revenues, 2010‑18
Percentage of GDP
Grants Rents, royalties Other revenues
Other property income Tax revenues Total non-tax revenues
% of GDP
18
16
14
12
10
8
6
4
2
0
2010 2011 2012 2013 2014 2015 2016 2017 2018
Source: Authors’ calculations based on data from (OECD/ATAF/AUC, 2020[1])), “Revenue Statistics in Africa: Comparative tables”, OECD Tax
Statistics (database), https://doi.org/10.1787/be755711-en.
12 https://doi.org/10.1787/888934181698
Box 2.2. Revenues and debt
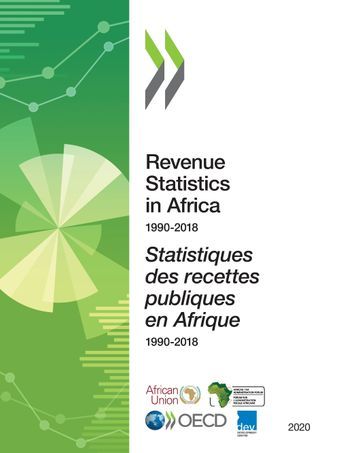
Since 2010, the public debt levels of the 30 countries in this report have risen substantially after a period
of decline resulting from the Heavily Indebted Poor Countries (HIPC) debt‑relief programme. The average
general government debt for these countries rose from 34.6% of GDP in 2010 to 53.1% in 2018 (Figure 2.4). Of
even greater concern, debt in foreign currency rose from 19.7% of GDP to 29.9% over the same period.3 Before
the onset of the COVID‑19 pandemic, the International Monetary Fund (IMF) projected that the average debt
level for these countries would rise to 61.5% of GDP. By the beginning of October 2020, the IMF projected that
between the end of 2019 and 2021, average debt‑to‑GDP ratios around the world would rise 20% in advanced
economies, 10% in emerging market economies and 7% in low‑income countries (Georgieva, Pazarbasioglu
and Weeks‑Brown, 2020[2]).
Until 2014, revenue and expenditure in the 30 African countries were both rising, but average non‑tax
revenues declined by over 3 percentage points of GDP between 2012 and 2016 as resource revenues dropped
due to falling commodity prices and as financial inflows slowed. Average expenditures as a percentage of
GDP also declined, but with a lag: they peaked at 28.0% in 2015, before declining to a low of 25.2% of GDP
in 2018. As a result, during this period of adjustments, deficits doubled.
Rising debt levels in countries with more difficult access to financing carry the risk that they will avail
themselves of sources of financing around which there is less transparency, or for which long‑term risks
could be hidden. These risks are even more complicated in the cases of Burkina Faso, Côte d’Ivoire, Mali, Niger,
Senegal and Togo who use the West African CFA franc, and Chad, the Republic of the Congo, Cameroon and
Equatorial Guinea who use the Central African CFA franc, and therefore do not have the option of borrowing
in their own currency.
Revenue Statistics in Africa 1990-2018 © OECD/ATAF/AUC 2020
STATISTIQUES DES RECETTES PUBLIQUES EN AFRIQUE 1990-2018 © OCDE/ATAF/CUA 2020 912. NON-TAX REVENUE TRENDS, 2000-2018/TENDANCES DES RECETTES NON FISCALES, 2000-2018
Box 2.2. Revenues and debt (cont.)
Figure 2.4. Africa (30) average general government gross debt, 2005‑2020
Percentage of GDP
General government gross debt General government gross debt, foreign currency
% of GDP
70
60
50
40
30
20
10
0
2005 2006 2007 2008 2009 2010 2011 2012 2013 2014 2015 2016 2017 2018 2019 2020
Notes: Averages are unweighted. 2020 figures are projections based upon calculations conducted when the COVID‑19 was still in
its early stages.
Source: Author’s calculations based on figures from April 2020 World Economic Outlook (IMF, 2020[3]).
12 https://doi.org/10.1787/888934181717
With the onset of the COVID‑19 pandemic in 2020, there is now an urgent need for African countries to
restructure their debts and reform their finances. The COVID‑19 pandemic has created a shock to African
economies and public finances at a time when they were already trying to adjust to the commodity price
shocks of 2014 (see Chapter 3 for more details). According to the IMF’s Debt Sustainability Framework (IMF,
2020[4]), the Republic of the Congo is in debt distress and six other African countries in this publication
(Cameroon, Cabo Verde, Chad, Ghana, Kenya and Mauritania) are at high risk of debt distress. Although
there was an unprecedented series of measures in early 2020 to avoid a debt repayment crisis during the
crisis, countries now need to find medium‑ and long‑term solutions to ensure they can continue to finance
their development needs.
The African Development Dynamics report of 2020 highlights steps African countries can take to improve
their fiscal outlooks while maintaining their access to capital (AUC/OECD, n.d.[5]):
●● African countries can make use of the exceptional circumstances of a global pandemic to negotiate debt
restructurings. Creditors, who normally fear setting unfavourable precedents around debt repayment,
may be amenable to accepting more debt relief measures when they are understood to apply only to the
present crisis.
●● African countries can work to adopt common negotiating positions on debt relief measures in order to
increase their leverage in the face of the rising number of their private and non‑concessional creditors.
Consolidation has already begun on the other side of the negotiating table. In April 2020, the Institute for
international Finance (IIF) put forth a list of conditions for private sector involvement in debt restructurings
on behalf of 450 leading financial institutions.
●● African countries can also make technical improvements to their borrowing strategies and the use of
financial instruments to improve their borrowing terms. Improvements to collective action clauses in
bond issuances, for example, can reduce risks to borrowers and uncertainty for investors. Developing
local currency bond markets could also allow African countries to borrow in their own currency and avoid
exchange rate and inflation risks.
Revenue Statistics in Africa 1990-2018 © OECD/ATAF/AUC 2020
92 STATISTIQUES DES RECETTES PUBLIQUES EN AFRIQUE 1990-2018 © OCDE/ATAF/CUA 20202. NON-TAX REVENUE TRENDS, 2000-2018/TENDANCES DES RECETTES NON FISCALES, 2000-2018
●● Sixcountries received more revenues from rents and royalties than other sources of
non‑tax revenues (in descending order, the Republic of the Congo, Equatorial Guinea,
Mauritania, Cameroon, Tunisia and Nigeria). For all these countries except Tunisia, oil
royalties provided the majority of non‑tax revenues.
●● Botswana, Lesotho, Namibia and Eswatini, the four neighbours of South Africa that belong
to SACU, received substantial non‑tax revenues in terms of transfers from the SACU
Common Revenue Pool (Box 2.4).
●● Forthe remaining eight countries, most non‑tax revenues were not grants, rents and
royalties or SACU revenues. The main alternative sources of non‑tax revenues for these
countries included: interest and dividends for Kenya, Seychelles and South Africa; fees
for goods and services for Cabo Verde, Ghana and Morocco; and miscellaneous and
unallocated revenues for Egypt and Mauritius.
Figure 2.5. Structure of non‑tax revenues by country, 2018
Percentage of GDP
Grants Rents, royalties Other property income⁴ Other revenues⁵
% of GDP
30
25
20
15
10
5
0
Note: Data include sub‑national government non‑tax revenues for Eswatini, Kenya, Mauritius and Morocco.
1. For Rwanda, non‑tax revenues aside from grants were not disaggregated in the data and are therefore classified as miscellaneous and
unidentified revenues.
2. Figures reported here represent mainly grant revenue and oil revenue obtained from the IMF’s April 2020 World Economic Outlook
classified as rents and royalties.
3. For Botswana, Eswatini, Lesotho and Namibia, “Other revenues” include funds from excises and customs duties collected by South Africa
and then transferred to these countries through the Southern African Customs Union (SACU) revenue‑sharing agreement.
4. Interest, dividends, etc.
5. Sales, fines, SACU revenues, etc.
See the footnotes to Figure 2.1 and country tables in Chapters 5 and 6 for further information.
Source: Table 6.2 in Chapter 6.
12 https://doi.org/10.1787/888934181736
Different sources of non‑tax revenues behave differently over time (Figure 2.6). Many
African countries experienced substantial variation in non‑tax revenues, regardless of
whether they obtained most of their revenues from grants (Rwanda and Malawi), resource
rents (Republic of the Congo and Equatorial Guinea), SACU transfers (Lesotho and Botswana)
or other non‑tax revenues (Egypt and Seychelles).
Revenue Statistics in Africa 1990-2018 © OECD/ATAF/AUC 2020
STATISTIQUES DES RECETTES PUBLIQUES EN AFRIQUE 1990-2018 © OCDE/ATAF/CUA 2020 932. NON-TAX REVENUE TRENDS, 2000-2018/TENDANCES DES RECETTES NON FISCALES, 2000-2018
Figure 2.6. Change in the structure of non‑tax revenues for selected countries, 2000‑18
Percentage of GDP
Grants Rents and royalties Other NTR
Rwanda Malawi
% of GDP % of GDP
14 14
12 12
10 10
8 8
6 6
4 4
2 2
0 0
Republic of the Congo Equatorial Guinea
% of GDP % of GDP
50 35
45 30
40
35 25
30 20
25
20 15
15 10
10
5 5
0 0
Lesotho Botswana
% of GDP % of GDP
50 35
30
40
25
30 20
20 15
10
10
5
0 0
Egypt Seychelles
% of GDP % of GDP
14 12
12 10
10
8
8
6
6
4
4
2 2
0 0
Note: See footnotes to Figure 2.1 and country tables in Chapters 5 and 6 for further information. Charts for all countries in the publication
can be found online at the Statlink below.
Source: Authors’ calculations based on data from (OECD/ATAF/AUC, 2020[1]), “Revenue Statistics in Africa: Comparative tables”, OECD Tax
Statistics (database), https://doi.org/10.1787/be755711-en.
12 https://doi.org/10.1787/888934181755
Revenue Statistics in Africa 1990-2018 © OECD/ATAF/AUC 2020
94 STATISTIQUES DES RECETTES PUBLIQUES EN AFRIQUE 1990-2018 © OCDE/ATAF/CUA 20202. NON-TAX REVENUE TRENDS, 2000-2018/TENDANCES DES RECETTES NON FISCALES, 2000-2018
Although there are long‑term trends in non‑tax revenues, these revenues tend to vary
more from year to year than do tax revenues. Over the past decade, 17 of the 30 countries
in this publication showed at least one year‑on‑year increase in non‑tax revenue equivalent
to at least 2% of GDP, while 16 countries registered at least one year‑on‑year decrease of a
similar magnitude. Such fluctuations are often driven by resource rents (caused by swings
in commodity prices or production) or by grant revenues (reflecting the shorter duration and
lower predictability of grant flows in comparison to tax revenues). Other sources of non‑tax
revenue, such as Eswatini’s SACU revenues, have also proven highly variable.
●● In the Republic of the Congo, oil royalties jumped from 36.0% of GDP in 2007 to 46.5%
of GDP in 2008 before declining by 25.3 percentage points the following year as both oil
prices and oil production declined. Between 2014 and 2015, after another fall in oil prices,
these revenues dropped from 35.4% of GDP to 14.0% of GDP. In 2015, Congo changed its
hydrocarbons code in order to strengthen the national share in oil profits (EIU, 2015[6]).
●● Between2011 and 2012, Mali experienced a sudden drop in grant revenues, from 4.5% of
GDP down to 0.1% during a year of multiple political crises.
●● Eswatini’s non‑tax revenues fell from 18.2% of GDP to 8.1% between 2009 and 2010, when
its SACU revenues fell by 80% following the collapse in customs and excise taxes in the
two years following the global financial crisis.
Grants
This publication contains countries that receive substantial grant revenues alongside
some for which grants are negligible. In 2018, 13 countries received grant revenues amounting
to less than 0.5% of GDP and 11 received grant revenues which were less than 2% of total tax
revenues (Figure 2.7). All of these countries were middle‑income countries, according to the
World Bank’s classification based on gross national incomes (World Bank, 2020[7]). On the
other hand, of the ten low‑income countries covered by this report, only Uganda received
grants amounting to less than 1% of GDP. For five of these countries, grant revenues were
equivalent to more than 15% of tax revenues.
Figure 2.7. Grants by country, 2018
Percentage of GDP
Grants as % of GDP (left axis) Grants as % of total tax revenues (right axis)
% of GDP % of total tax revenues
10 60
9
50
8
7 40
6
5 30
4
3 20
2 10
1
0 0
Source: Tables 6.2 and 6.3 in Chapter 6.
12 https://doi.org/10.1787/888934181774
Revenue Statistics in Africa 1990-2018 © OECD/ATAF/AUC 2020
STATISTIQUES DES RECETTES PUBLIQUES EN AFRIQUE 1990-2018 © OCDE/ATAF/CUA 2020 952. NON-TAX REVENUE TRENDS, 2000-2018/TENDANCES DES RECETTES NON FISCALES, 2000-2018
Figure 2.8 presents grants as a percentage of GDP received by countries in this
publication and their gross national income (GNI) per capita. The figure has an empty upper
right‑hand quadrant as higher income African countries receive proportionately lower grant
revenues. However, many countries occupy the bottom left quadrant of the graph, as there
are countries with relatively low levels of grant income despite having lower incomes. For
example, Burkina Faso, Rwanda and Uganda had GNI per capita in 2018 between USD 750
and USD 780, but they reported grants as a percentage of GDP in that year ranging from
0.7% (Uganda) and 2.4% (Burkina Faso) to 4.9% (Rwanda). The Seychelles is another outlier,
receiving grants equivalent to 1.3% of GDP, the 12th highest out of the 30 countries, despite
being the only country in the publication to be classified as high‑income.
Figure 2.8. Grants as a percentage of GDP and GNI per capita by country, 2018
GNI per capita in USD
(Atlas method)
19 200
High income threshold (USD 12 375)
SYC
MUS
9 600
BWA
ZAF
Upper middle-income threshold (USD 3 995)
4 800 NAM
SWZ
TUN CPV
MAR
EGY
2 400
GHA CIV
NGA
COG
MRT KEN
CMR SEN
LSO Lower middle-income threshold (USD 1 025)
1 200
MLI
UGA BFA RWA
TCD TGO
600
MDG NER
COD
MWI
300
0.0 1.0 2.0 3.0 4.0 5.0 6.0 7.0
Grant revenues as a % of GDP
Note: GNI figures are converted to USD using the World Bank Atlas Method.
Source: Table 6.2 in Chapter 6, and World Bank World Development Indicators (database).
12 https://doi.org/10.1787/888934181793
Grant revenues and foreign aid are similar concepts, although in practice it is difficult
to align aid statistics, as reported by donor countries, with the aid revenues reported by
recipient countries, due to data, methodological, and conceptual issues.
Grant revenues have some overlap with official development assistance (ODA), as defined
by the OECD Development Assistance Committee (DAC).4 Grants covered by this publication
focus on revenues received by countries from foreign governments and international
organisations, whereas ODA is a measure of donor countries’ efforts to support development
in low‑ and middle‑income countries. ODA not only covers flows captured under “grants”
in this publication (budget aid, food aid, capital transfers, current transfers, project grants,
programme grants, international debt relief, etc.), but also encompasses concessional
loans, in‑kind technical assistance, in‑donor administrative costs, in‑donor refugee costs
and scholarships, as well as other activities that do not generate a (net) revenue flow to the
Revenue Statistics in Africa 1990-2018 © OECD/ATAF/AUC 2020
96 STATISTIQUES DES RECETTES PUBLIQUES EN AFRIQUE 1990-2018 © OCDE/ATAF/CUA 20202. NON-TAX REVENUE TRENDS, 2000-2018/TENDANCES DES RECETTES NON FISCALES, 2000-2018
country. The volume of ODA received by a given country will thus be different from – and
usually higher than – the volume of grants reported in Revenue Statistics.
Statistics collected by the DAC on ODA flows to African countries include public flows
from all members of the DAC and some countries outside the DAC, as well as multilateral
organisations such as the World Bank, the IMF and the UN. Statistics on development
co‑operation provided by some large non‑OECD economies, such as Brazil, China and India,
are not included (OECD, 2020[8]).
Figure 2.9. Grants and net official development assistance (ODA) received, 2018
Percentage of GDP
Grants Net ODA as % of GDP
% of GDP
20
18
16
14
12
10
8
6
4
2
0
Note: Figures for net ODA include donations from the 30 member countries of the OECD Development Assistance Committee (DAC), the
20 non‑DAC countries, as well as multilateral institutions, and private donations. Some major donor countries, such as China are not yet
accounted for in these data.
Source: Table 6.2 in Chapter 6 and OECD Development Assistance Committee (DAC) 2020 for the ODA data.
12 https://doi.org/10.1787/888934181812
Comparing grant revenues to net ODA (Figure 2.9) shows that the assistance received
by African countries is far greater than the amounts that end up going in to their national
budgets. Although the countries receiving the most net ODA tend to receive the most grant
revenues, the relationship is not linear and there are notable outliers, such as Malawi, whose
net ODA as a percentage of GDP of 18.5% far outstrips all other African countries, but whose
grant revenues as a percentage of GDP trail behind 9 other African countries.
African countries relying on grant revenues often face sudden drops in grants from
one year to the next. Five of the eight countries receiving grants in excess of 5% of GDP
in at least one year had at least one single‑year drop in grants over this period of at least
2 percentage points of GDP. Malawi received grants amounting to over 10% of GDP in 2013,
but they dropped by 65% the following year, the year of the CashGate Scandal (VOANews,
2013[9]). In total, 14 countries among the 30 participating in this publication registered a
one‑year drop in grant revenues equivalent to at least 1.0% of GDP over the decade.
Revenue Statistics in Africa 1990-2018 © OECD/ATAF/AUC 2020
STATISTIQUES DES RECETTES PUBLIQUES EN AFRIQUE 1990-2018 © OCDE/ATAF/CUA 2020 972. NON-TAX REVENUE TRENDS, 2000-2018/TENDANCES DES RECETTES NON FISCALES, 2000-2018
Average grant revenues as a percentage of GDP for the countries in this publication
declined to 1.3% in 2018 from 2.2% in 2010. Between 2010 and 2018, the only years in which
average grants as a percentage of GDP for the countries in this publication increased were
2013 and 2017, with 2014 the year in which average grants decreased the most. Changes in
grant revenues often depend on circumstances unique to the country. Egypt, for example,
saw a spike in grant revenues in 2014 following the normalisation of international relations
after its internal political crisis, while Mali saw its grant revenues disappear in 2012 with
the outbreak of the Mali War before resuming the following year.
The COVID‑19 crisis could be another exogenous event that dramatically impacts aid
flows to African countries. Based upon the historic behaviour of ODA over the past several
decades, the OECD Development Assessment Committee proposed three possible scenarios
for how international aid in 2020 will change as a result of COVID‑19, ranging from a possible
increase in ODA volumes to a possible decline in ODA flows by up to USD 14 billion in 2020
(OECD, 2020[10]). There is not yet enough data to determine which scenario will play out but
some early indicators show a decrease in aid commitments from some bilateral donors
and an increase in aid commitments from some multilateral donors (Breed and Sternberg,
2020[11]).
Resource revenues and other property income
One of the most important sources of non‑tax revenues for governments originates from
their status as property owner, especially as land owner. Such revenues are reported as property
income in Revenue Statistics in Africa and encompass various forms of income (Figure 2.10).
Figure 2.10. Rents and royalties by country, 2018
Percentage of GDP
Rents and royalties Other property income Property income as % of total revenues (right axis)
% of GDP % of total revenues
22 100
20 90
18 80
16
70
14
60
12
50
10
40
8
30
6
4 20
2 10
0 0
Note: Rwanda is excluded as data are not available.
1. Cabo Verde property income is not disaggregated.
Source: Authors’ calculations based on Tables 6.5‑6.34 and Table 4.17.
12 https://doi.org/10.1787/888934181831
Revenue Statistics in Africa 1990-2018 © OECD/ATAF/AUC 2020
98 STATISTIQUES DES RECETTES PUBLIQUES EN AFRIQUE 1990-2018 © OCDE/ATAF/CUA 20202. NON-TAX REVENUE TRENDS, 2000-2018/TENDANCES DES RECETTES NON FISCALES, 2000-2018
Rents and royalties are revenues generated from property the government owns,
usually by prospecting and extracting non‑renewable resources from government land
or from harvesting government‑owned farms and forests. Interest and dividends are
returns on government‑owned investments in corporations. In general, royalties from oil
and minerals are kept distinct from other forms of investment income, but the issue can
become complicated. Many African governments create public corporations that manage
oil revenues or maintain revenue‑sharing agreements with private corporations that exploit
these natural resources. The classification of such funds is not always clear. For example,
in Botswana, a significant proportion of property income comes from companies investing
in diamond extraction (Box 2.3).
Box 2.3. Natural resources and public finances5
There are various mechanisms by which natural resources can generate revenues or
savings for government:
●● Rents and royalties are the most direct means of deriving revenue from natural resource
wealth. The government charges fees to companies and individuals in exchange for the
right to access government lands. It does this in its capacity as landowner and these fees
are generally decided through negotiation. These are recorded under property income.
●● Payment for services provided by the government is another source of non‑tax revenue
paid for by businesses in the primary sector. This can include, for example, payments
for environmental inspections or for the construction of infrastructure, or, in the case of
Mauritius, payment for weather data and maps. These are recorded under sales of goods
and services.
●● Public ownership (full or partial) of a corporation that exploits natural resources on the
government’s behalf results in government revenues in the form of profits and dividends.
These are recorded under property income. The government of Botswana, for example,
collects most of its resource‑related revenues from dividends it receives from its 50%
stake in Debswana, the company that operates the main diamond mines in Botswana
(MiningTechnology, 2020[13]).
●● Taxes targeting the activity of natural resource exploitation could be introduced, such as an
excise tax on the sale of materials extracted from public lands or a tax on mining that targets
the activity, rather than the individual or company exploiting natural resources. These, too, will
be recorded as taxes. Such taxes on mining activity exist in Niger and Senegal, who impose
taxes on mining activities which are classified under other taxes on goods and services.
●● Companies and individuals exploiting natural resources are generally subject to the
same taxes (such as income taxes and value‑added taxes) as the rest of the population.
Revenues from these general taxes will be included in government financial statements,
but not necessarily attributed to sectors exploiting natural resources.
●● Companies and individuals may use some of the wealth they obtain from natural
resource extraction to build infrastructure or provide services. Where this satisfies
demand for public investment or services, it could result in savings on government
expenditure, but it would not be recorded as revenue. In some cases, as a condition for
access to publicly‑owned natural resources, governments may demand that companies
and individuals provide certain services, for example paying for at least part of the
cost of constructing and maintaining roads to mines. An example of this was mining
companies participating in a proposed 3 000 km rail link between Benin, Burkina Faso,
Niger, Côte d’Ivoire, Ghana, Nigeria and Togo (CNN, 2015[14]).
Revenue Statistics in Africa 1990-2018 © OECD/ATAF/AUC 2020
STATISTIQUES DES RECETTES PUBLIQUES EN AFRIQUE 1990-2018 © OCDE/ATAF/CUA 2020 992. NON-TAX REVENUE TRENDS, 2000-2018/TENDANCES DES RECETTES NON FISCALES, 2000-2018
Revenues from natural resources
Rents and royalties among the 30 countries participating in this publication consist
mostly of oil revenues. In 2018, over 77.2% of total rents and royalties in USD were specifically
reported as oil revenues (royalties and revenues from revenue‑sharing agreements with
oil companies), which accounted for a majority of rents and royalties for Cameroon, Chad,
the Republic of the Congo, Egypt, Ghana, Equatorial Guinea and Nigeria. Meanwhile, minerals
were the source of most rents and royalties for Botswana, Burkina Faso, the Democratic
Republic of the Congo, Togo, South Africa and Uganda. Fishing accounted for all revenue
recorded as rents and royalties in Seychelles and for 54.2% in Mauritania. In Mauritania,
fishing rents were USD 210 million, or 3.0% of GDP. Over 92.5% of total rents and royalties
for the 30 countries were resource‑related; the remainder included revenues from the
construction and operation of airports in Kenya and Togo, for example. Tunisia is only a
minor producer of natural gas, but it collects over TND 500 million (Tunisian dinars) each
year in rents from the Trans‑Mediterranean gas pipeline, which carries Algerian natural gas
to Europe (AfricanManager, 2019[12]).
Natural resource revenues tend to be a highly volatile source of financing. Six countries
(Chad, Republic of the Congo, Equatorial Guinea, Lesotho, Mauritania and Nigeria) generated
rents and royalties equivalent to more than 5% of GDP in at least one of the most recent ten
years and they all registered year‑over‑year decreases in rents and royalties as a percentage of
GDP of 25% or more. Chad and Equatorial Guinea both saw at least one year with a decrease
of over 60%.
As oil royalties are the dominant form of rents and royalties in Africa, these revenues
are highly dependent on actual oil prices (Figure 2.11). With or without Nigerian rents and
royalties, which, since 2010, have amounted to between 45% and 70% of total rents and
royalties collected by African governments, the evolution of African rents and royalties
tracks the international crude oil price.
Figure 2.11. Total rents and royalties in USD and crude oil price in USD, 2010‑18
Percentage of 2010‑18 average
Crude oil, average Total rents and royalties in USD, Africa (30) Total rents and royalties (excluding Nigeria)
% of 2010-18 average
200
180
160
140
120
100
80
60
40
20
0
2010 2011 2012 2013 2014 2015 2016 2017 2018
Source: World Bank Commodity Price Data (The Pink Sheet) and authors’ calculations based on data from (OECD/ATAF/AUC, 2020[1]),
“Revenue Statistics in Africa: Comparative tables”, OECD Tax Statistics (database), https://doi.org/10.1787/be755711-en.
12 https://doi.org/10.1787/888934181850
Revenue Statistics in Africa 1990-2018 © OECD/ATAF/AUC 2020
100 STATISTIQUES DES RECETTES PUBLIQUES EN AFRIQUE 1990-2018 © OCDE/ATAF/CUA 20202. NON-TAX REVENUE TRENDS, 2000-2018/TENDANCES DES RECETTES NON FISCALES, 2000-2018
Although resource revenues in African countries are dominated by oil revenues, the
countries in this publication have considerable natural resource wealth outside oil, even if,
with the exception of Botswana, this generally does not translate into large revenues.
There is a great deal of variation in the size and type of natural resource endowments
in African countries. The contribution of this natural wealth to countries’ GDP also varies,
as does its impact on government budgets. For example, according to World Bank estimates
of the contribution of natural resources to economic output (Figure 2.12), Chad, the Republic
of the Congo and Equatorial Guinea (mostly oil), the Democratic Republic of the Congo
and Mauritania (mostly minerals), and Ghana were the five countries for which natural
resources contributed an estimated equivalent of 15% of GDP to economic output in 2018
(World Bank, 2020[15]).6
Figure 2.12. Estimated natural resource extraction, 2018
Percentage of GDP
Oil and gas Minerals and coal Forest
% of GDP
60
50
40
30
20
10
0
Source: World Bank World Development Indicators (database) for estimates of the total value of natural resource production in each country.
12 https://doi.org/10.1787/888934181869
The impact of countries’ natural resource endowment on public finances also varies
greatly. Countries such as Chad, the Republic of the Congo, Mauritania and Equatorial Guinea
generate significant public revenues from their natural wealth, while Togo, for example,
reported public revenues from natural resource rents equivalent to no more than 0.1% of
GDP despite its natural resource wealth production exceeding 10% of GDP.
In three countries (the Democratic Republic of the Congo, Malawi and Uganda), wealth
generated by forests exceeded 5% of GDP but did not contribute much to national revenues.
Although countries such as Cameroon and Niger did collect some royalties on logging, forest
revenues were a small part of the non‑tax revenues for the countries in question. Due to
the fragility of its Sahel and Saharan ecology, and the importance of wood as an energy
source to local communities, Niger has been working with villages on forest management,
to establish sustainable forest harvesting practices (Rives, Peltier and Montagne, 2010[16]).
Revenue Statistics in Africa 1990-2018 © OECD/ATAF/AUC 2020
STATISTIQUES DES RECETTES PUBLIQUES EN AFRIQUE 1990-2018 © OCDE/ATAF/CUA 2020 1012. NON-TAX REVENUE TRENDS, 2000-2018/TENDANCES DES RECETTES NON FISCALES, 2000-2018
Other non‑tax revenues
Certain countries generate substantial non‑tax revenues from the normal operations
of government. These revenues can be divided into sales of goods and services, fines and
penalties, and miscellaneous and unidentified non‑tax revenues. The challenges in compiling
non‑tax revenues outlined in Box 2.3 are often encountered in these kinds of revenues,
since they are typically not collected by tax administrations and are often not defined by
legislation. They might not even be captured by government budgets.
For all these categories of revenues, there can be arguments about the degree to which
they are unrequited or compulsory, and therefore whether they are more properly classified
as taxes. The question of which administrative fees are taxes and which are not is discussed
in Annexes A and B. However, this is not always clear for the question of fines and penalties.
Institutions and governments that have less authority, and thus less tax collection power,
may rely more on these kinds of non‑tax revenues. This means that the lack of information
in this publication on local government finances might under‑estimate the non‑tax revenues
collected by these institutions.
Sales of goods and services and administrative fees
Governments produce goods and services both as a market‑ and as a non‑market
participant. As a market participant, governments sometimes provide goods and services
that can also be obtained from private companies (such as selling food or providing
transportation). At the same time, they also provide services in the course of administering
programmes and executing laws that are unique to the function of government. Fees charged
for these non‑market services are generally classified as administrative fees.
Administrative fees are often difficult to classify since they occupy a grey area between
payments for services (which are non‑tax revenues) and compulsory unrequited payments
collected during government operations (which are taxes).7 Court fees and fees for driver’s
licences, passports, patent registrations and marriage certificates tend to be classified
as non‑tax revenues. When administrative fees are classified as taxes, they are typically
assigned to one of the following categories:
●● 4400 Taxes on financial and capital transactions (for example, taxes on sales of land)
●● 5200 Taxes on use of goods and performing activities (for example hunting licences,
vehicle registrations)
●● 6000 Other taxes (for example, sales of fiscal stamps, where stamps are used to pay for
taxes and administrative fees).
Six countries generated revenues from sales of goods and services and administrative
fees equivalent to at least 1% of GDP in 2018 (Figure 2.13): Cabo Verde (3.4% of GDP), Ghana
(1.2% of GDP), Morocco (3.1% of GDP), Seychelles (3.0% of GDP), Mauritius (2.6% of GDP) and
Togo (2.4% of GDP). In the cases of Cabo Verde, these revenues were equivalent to 16.0% of
total tax revenues, and for Togo, 12.2%.
The composition of these revenues varied by country. In Cabo Verde, 96% of revenues
listed under “sales of goods and services” were fees. In Ghana, most revenues listed as
sales of goods and services were collected by Municipalities, Departments and Agencies
or by Metropolitan, Municipal and District Assemblies. In Morocco, 58% of revenue from
government sales of goods and services were collected at the local level.
Revenue Statistics in Africa 1990-2018 © OECD/ATAF/AUC 2020
102 STATISTIQUES DES RECETTES PUBLIQUES EN AFRIQUE 1990-2018 © OCDE/ATAF/CUA 20202. NON-TAX REVENUE TRENDS, 2000-2018/TENDANCES DES RECETTES NON FISCALES, 2000-2018
Figure 2.13. Sales of goods and services and administrative fees and other revenues
related to administration, 2018
Percentage of GDP
Sales of goods & services (non-tax) Taxes on fin. transactions Taxes on use of goods & permissions Unidentified taxes
% of GDP
5.0
4.0
3.0
2.0
1.0
0.0
-1.0
Note: Figures reported here include sub‑national tax revenues for Mauritius, Morocco, and South Africa and sub‑national non‑tax
revenues for Eswatini, Kenya, Mauritius, and Morocco, the only countries for which such revenues were reported for 2018. Nigeria,
Rwanda, and Senegal are excluded as data are not available.
Source: Authors’ calculations based on data from (OECD/ATAF/AUC, 2020[1]), “Revenue Statistics in Africa: Comparative tables”, OECD Tax
Statistics (database), https://doi.org/10.1787/be755711-en.
12 https://doi.org/10.1787/888934181888
Miscellaneous or unidentified revenue
Some notable categories of non‑tax revenue do not fit within any of the categories listed
above. These include:
●● capital transfers not included elsewhere;
●● voluntary donations to government agencies from individuals or private corporations
(not including donations from international organisations, which are classified as grants);
●● private payments to government made as a result of major court settlements or insurance
claims (such as the EUR 100 million payment Arcelor Mittal agreed to pay to the government
of Senegal after a court case following the cancelation of an iron mine (RFI, 2014[17]);
●● payments covering different categories in the classification list where a breakdown is
not available;
●● payments whose proper classification is unknown due to a lack of data. Rwanda did not
disaggregate non‑tax revenue outside of grants, so these were included in this category;
●● SACU revenues to Botswana, Eswatini, Lesotho and Namibia (see Box 2.4).
Miscellaneous and unidentified revenues can be a significant component of non‑tax
revenues in certain countries. These include exceptional voluntary contributions to
government in Tunisia, capital transfers from special statutory funds in Mauritius and, in
Morocco, payments made to government in exchange for the right to compete with state
institutions in the provision of services.
Revenue Statistics in Africa 1990-2018 © OECD/ATAF/AUC 2020
STATISTIQUES DES RECETTES PUBLIQUES EN AFRIQUE 1990-2018 © OCDE/ATAF/CUA 2020 1032. NON-TAX REVENUE TRENDS, 2000-2018/TENDANCES DES RECETTES NON FISCALES, 2000-2018
Box 2.4. SACU revenue
The Southern African Customs Union (SACU) incorporates Botswana, Eswatini, Lesotho, Namibia and
South Africa. It is headquartered in Windhoek, Namibia. Its vision is “an economic community with equitable
and sustainable development, dedicated to the welfare of its people for a common future”.
SACU is the oldest customs union in the world, having been founded in 1899 between the British colony
of Cape of Good Hope and the Orange Free State Boer Republic. Subsequent agreements in 1910 and 1969
included Botswana, Eswatini and Lesotho. Following Namibia’s independence in 1990 and the end of
apartheid in South Africa in 1994, new negotiations led to the current SACU agreement, which was signed
in 2002.
The SACU agreement provides for free movement of SACU manufactured products within the union,
without application of tariffs or duties. It also provides for common external tariffs and for the payment
of customs and excise duties into a common pool to be shared between the SACU countries under the
revenue‑sharing formula set out in the Annex to the agreement.
The revenue‑sharing agreement includes three components:
●● A customs component, which divides the gross amount of customs duties according to the value of goods
each country imports from other SACU countries in a given year (as a percentage of intra‑SACU imports).
●● An excise component, which divides the gross amount of excise duties according to each country’s GDP
as a percentage of SACU’s combined GDP.
●● A development component, which is funded from 15% of the excise component and is weighted toward
less developed SACU countries using a formula based on GDP per capita.
In this publication, revenue from excises, tariffs and customs duties are included as tax revenues in the
SACU country that collected the revenue. They are included under headings 5121 (Excises) and 5123 (Customs
and import duties) in the tax revenue tables. Revenues received from the SACU Common Revenue Pool are
included as miscellaneous revenue in the non‑tax revenue tables, as seen in Table 6.13 for Eswatini. In the
case of South Africa, where payments exceed the revenue share received from the Pool, the payments net
of the share received are recorded as a memorandum item in the non‑tax revenue table (Table 6.22).
Sources: (SACU, 2017[19]), (SACU, 2014[20]).
The volatility of miscellaneous and unidentified revenues may be due to large capital
transfers, revenue streams that are short‑lived or funds that are reclassified as unidentified
due to lack of information. The higher values for this category could reflect uncertainty as
to the true amount of revenue within other non‑tax revenue classifications.
Southern African Customs Union revenues
For the first time, all five members of SACU are participating in the Revenue Statistics in
Africa initiative. This permits a full accounting of all revenues going into the SACU Common
Revenue Pool and the amount allocated to member countries (Figure 2.14).
All five members of SACU collect customs and excise taxes under a unified tax regime
and then transfer those funds to the SACU Common Revenue Pool. The SACU Revenue Pool
in turn redistributes the moneys collected under a complex revenue sharing formula. In
practice, however, South Africa possesses the main ports of entry into Southern Africa and
ends up collecting almost all the customs duties and excises allocated to the SACU Common
Revenue Pool. South Africa therefore ends up making net payments into the SACU Revenue
Pool, while the other SACU countries are net recipients of funds from the Pool.
Revenue Statistics in Africa 1990-2018 © OECD/ATAF/AUC 2020
104 STATISTIQUES DES RECETTES PUBLIQUES EN AFRIQUE 1990-2018 © OCDE/ATAF/CUA 20202. NON-TAX REVENUE TRENDS, 2000-2018/TENDANCES DES RECETTES NON FISCALES, 2000-2018
Figure 2.14. Total SACU and other non‑tax revenues by country
Botswana Eswatini
Percentage of GDP Percentage of GDP
SACU Grants Rents Other SACU Grants Rents Other
% of GDP % of GDP
50 50
45 45
40 40
35 35
30 30
25 25
20 20
15 15
10 10
5 5
0 0
2006 2007 2008 2009 2010 2011 2012 2013 2014 2015 2016 2017 2018 2006 2007 2008 2009 2010 2011 2012 2013 2014 2015 2016 2017 2018
Lesotho Namibia
Percentage of GDP Percentage of GDP
SACU Grants Rents Other SACU Grants Rents Other
% of GDP % of GDP
50 50
45 45
40 40
35 35
30 30
25 25
20 20
15 15
10 10
5 5
0 0
2006 2007 2008 2009 2010 2011 2012 2013 2014 2015 2016 2017 2018 2006 2007 2008 2009 2010 2011 2012 2013 2014 2015 2016 2017 2018
South Africa Total SACU Common Revenue Pool annual
Percentage of GDP disbursements by country
Millions of USD
Other SACU Rents Grants BWA SWZ LSO NAM ZAF
% of GDP Million USD
50 14 000
45
12 000
40
35 10 000
30 8 000
25
20 6 000
15 4 000
10
2 000
5
0 0
2006 2007 2008 2009 2010 2011 2012 2013 2014 2015 2016 2017 2018 2006 2007 2008 2009 2010 2011 2012 2013 2014 2015 2016 2017 2018
Note: SACU revenues reported here are classified as non‑tax revenues for all countries presented here except for South Africa. For
South Africa, SACU revenues received by the government of South Africa are classified under customs duties and excise taxes, and not
non‑tax revenues.
Source: Authors’ calculations based on data from (OECD/ATAF/AUC, 2020[1]), “Revenue Statistics in Africa: Comparative tables”, OECD Tax
Statistics (database), https://doi.org/10.1787/be755711-en.
12 https://doi.org/10.1787/888934181907
Revenue Statistics in Africa 1990-2018 © OECD/ATAF/AUC 2020
STATISTIQUES DES RECETTES PUBLIQUES EN AFRIQUE 1990-2018 © OCDE/ATAF/CUA 2020 1052. NON-TAX REVENUE TRENDS, 2000-2018/TENDANCES DES RECETTES NON FISCALES, 2000-2018
SACU revenues to South Africa are negligible but they have a strong impact on the
finances of the other members of the customs union. In 2018, these revenues boosted the
revenues of Botswana, Eswatini, Lesotho and Namibia by 7.7%, 9.2%, 16.0% and 9.8% of GDP,
respectively. Besides exogenous economic shocks, member countries also saw their SACU
revenues rise and fall due to changes in the parameters used in the SACU revenue‑sharing
formula. The economic shock of the global financial crisis rendered many economic forecasts
of the time inaccurate; because SACU payments were calculated based on these forecasts,
major adjustments to SACU payments were required in 2010 and 2011 to compensate for
years of overpayments into the SACU pool (Mongardini et al., 2011[18]). A similar situation
occurred in 2014, when a slowdown in South Africa’s economy again caused forecasts to be
revised downward; Eswatini, Lesotho and Namibia’s SACU revenues declined as a percentage
of GDP in 2015 and 2016, although this trend was reversed in 2017.
Notes
1 There is no comparison with the averages of the 25 Latin American and Caribbean (LAC) countries
(see OECD et al., 2018[22]) and the 36 OECD countries (see OECD, 2017[21]), as these publications do
not cover non‑tax revenues.
2 Please see the Interpretative Guide to non‑tax revenue in Annex B of this report for the definitions
of these revenue categories.
3 Not counting Burkina Faso, the Democratic Republic of the Congo, Egypt, Madagascar, Malawi and
Nigeria for which data is not available.
4 The official definition of ODA is: “flows to countries and territories on the Development Assistance
Committee List of ODA Recipients and to multilateral institutions which are provided by official
agencies, including state and local governments, or by their executive agencies. In addition, each
transaction must be administered with the promotion of the economic development and welfare
of developing countries as its main objective; and be concessional in character and conveys a grant
element of at least 25% (calculated at a rate of discount of 10%)”. Further information is available
at: www.oecd.org/dac/financing-sustainable-development/index-terms.htm#ODA.
5 (Mansour and Rota‑Graziosi, 2013[23]) note that taxes on oil extraction can include corporate income
tax, excise taxes on energy products, un‑refunded sales taxes such as VATs and non‑tax revenue can
include royalties, profit sharing, dividends received from state enterprises, and other investment
income received from government direct participation in extractive enterprises.
6 The World Bank refers to “natural resource rents”. This is calculated as the difference between
the value of natural resource production in the countries according to commodity prices and the
estimated cost of resource extraction. It is not to be confused with the definition of resource rent used
by the OECD, for which it is defined as a form of government revenue. Please see the documentation
of resource rents in the World Bank World Development Indicators dataset (see https://databank.
worldbank.org/metadataglossary/adjusted-net-savings/series/NY.GDP.TOTL.RT.ZS) and the Interpretative
Guide for more details.
7 See paragraphs 9‑13 of the OECD Interpretative Guide in Annex A for an explanation of how
administrative fees are classified in this publication.
References
AfricanManager (2019), Gazoduc‑ENI: Des royalties de 500 millions de dinars par an pour la Tunisie,
https://africanmanager.com/la-tunisie-tirera-500-millions-de-dinars-par-an-du-gazoduc-avec-litalie/. [12]
AUC/OECD (n.d.), Africa’s Development Dynamics 2020: Digital Transformation for Quality Jobs, OECD
Publishing, Paris/African Union Commission, Addis Ababa. [5]
Breed, D. and L. Sternberg (2020), Tracking aid flows to the Covid‑19 response, Development Initiatives
Poverty Research Ltd, https://devinit.org/data/tracking‑aid‑flows‑in‑light‑of‑the‑covid‑19‑crisis/#down-
loads (accessed on 2 October 2020). [11]
CNN (2015), Mammoth rail network to put West African economies on the right track, https://edition.cnn.
com/2015/03/05/africa/west‑africa‑minerals‑railway/index.html (accessed on 21 September 2020).[14]
Revenue Statistics in Africa 1990-2018 © OECD/ATAF/AUC 2020
106 STATISTIQUES DES RECETTES PUBLIQUES EN AFRIQUE 1990-2018 © OCDE/ATAF/CUA 20202. NON-TAX REVENUE TRENDS, 2000-2018/TENDANCES DES RECETTES NON FISCALES, 2000-2018
EIU (2015), Government approves new hydrocarbons code, https://country.eiu.com/article.aspx?articleid=13030
35314&Country=Congo%20(Brazzaville)&topic=Eco_9. [6]
Georgieva, K., C. Pazarbasioglu and R. Weeks‑Brown (2020), Reform of the International Debt Architecture is
Urgently Needed, https://blogs.imf.org/2020/10/01/reform‑of‑the‑international‑debt‑architecture‑is‑urgently‑
needed/?utm_medium=email&utm_source=govdelivery. [2]
IMF (2020), List of LIC DSAs for PRGT‑Eligible Countries, www.imf.org/external/Pubs/ft/dsa/DSAlist.pdf. [4]
IMF (2020), World Economic Outlook Database April 2020, www.imf.org/external/pubs/ft/weo/2020/01/weodata/
index.aspx (accessed on 8 September 2020). [3]
Mansour, M. and G. Rota‑Graziosi (2013), “Tax Coordination, Tax Competition, and Revenue Mobilization
in the West African Economic and Monetary Union”, IMF Working Paper, Vol. 13/163, www.imf.org/
en/Publications/WP/Issues/2016/12/31/Tax‑Coordination‑Tax‑Competition‑and‑Revenue‑Mobilization‑
in‑the‑West‑African‑Economic‑and‑40756. [23]
MiningTechnology (2020), Debswana diamond mines, www.mining-technology.com/projects/debswana/
(accessed on 20 September 2020). [13]
Mongardini, J. et al. (2011), In the wake of the global economic crisis : adjusting to lower revenue of the
Southern African Customs, International Monetary Fund, www.imf.org/external/pubs/ft/dp/2011/
afr1101.pdf. [18]
OECD (2020), DAC Data Submitters, www.oecd.org/dac/financing‑sustainable‑development/
development‑finance‑standards/dacdatasubmitters.htm (accessed on 18 September 2020). [8]
OECD (2020), Six decades of ODA: insights and outlook in the COVID‑19 crisis, OECD,
https://doi.org/10.1787/2dcf1367‑en. [10]
OECD (2018), Global Outlook on Financing for Development, OECD Publishing, www.oecd.org/dac/
global‑outlook‑on‑financing‑for‑sustainable‑development‑2019‑9789264307995‑en.htm. [24]
OECD (2017), Revenue Statistics 2017, OECD Publishing, Paris, https://dx.doi.org/10.1787/9789264283183‑en.[21]
OECD/ATAF/AUC (2020), Revenue Statistics in Africa: Comparative tables, OECD Publishing, Paris,
http://dx.doi.org/10.1787/be755711-en. [1]
OECD et al. (2018), Revenue Statistics in Latin America and the Caribbean 2018, OECD Publishing, Paris,
https://dx.doi.org/10.1787/rev_lat_car‑2018‑en‑fr. [22]
RFI (2014), Le gros chèque d’Arcelor Mittal au Sénégal, www.rfi.fr/economie/20140605‑le‑gros‑cheque‑
arcelor‑mittal‑senegal. [17]
Rives, F., R. Peltier and P. Montagne (2010), Fifteen years of forest community management in Niger: from a
technician’s dream to social reality, CIRAD, https://agritrop.cirad.fr/555467/1/document_555467.pdf. [16]
SACU (2017), Southern African Customs Union Agreement 2002 (As amended on 12 April 2013),
www.sacu.int/list.php?type=Agreements. [19]
SACU (2014), Implementing a Common Agenda Towards Regional Integration: 2014 Annual Report,
www.sacu.int/docs/reports_annual/2014/annual_report.pdf. [20]
VOANews (2013), Malawi: Donors Withhold Aid Over Cashgate Scandal, www.voanews.com/africa/
malawi‑donors‑withhold‑aid‑over‑cashgate‑scandal (accessed on 21 September 2020). [9]
World Bank (2020), World Bank Country and Lending Groups, https://datahelpdesk.worldbank.org/knowledgebase/
articles/906519 (accessed on June 2020). [7]
World Bank (2020), World Development Indicators, https://data.worldbank.org/ (accessed on 8 September
2020). [15]
Revenue Statistics in Africa 1990-2018 © OECD/ATAF/AUC 2020
STATISTIQUES DES RECETTES PUBLIQUES EN AFRIQUE 1990-2018 © OCDE/ATAF/CUA 2020 107You can also read