POPE of LNMS M18 J1 Signals - Highways Agency December 2014
←
→
Page content transcription
If your browser does not render page correctly, please read the page content below

POPE of LNMS
M18 J1 Signals
Highways Agency
December 2014
Notice
This document and its contents have been prepared and are intended solely for Highways Agency’s
information and use in relation to POPE of LNMS.

Atkins Limited assumes no responsibility to any other party in respect of or arising out of or in connection
with this document and/or its contents.

This document has 54 pages including the cover.

Document history
 Job number: 5107696                     Document ref: N9054 M18 J1 LNMS Evaluation Report.docx
 Revision Purpose description            Originated      Checked         Reviewed       Authorised Date
 Rev 1.0     Draft                       JB              LS              RF             EH            26/08/14
 Rev 2.0     Draft                       JB              LS              RF             EH            06/10/14
 Rev 3.0     Final                       JB              LS              RF             EH            18/12/14

Client signoff
 Client               Highways Agency

 Project              POPE of LNMS

 Document title       POPE of LNMS Evaluation Report

 Job no.              5107696

Atkins POPE of LNMS | M18 J1 Traffic Signals | December 2014 | 5107696                                         2
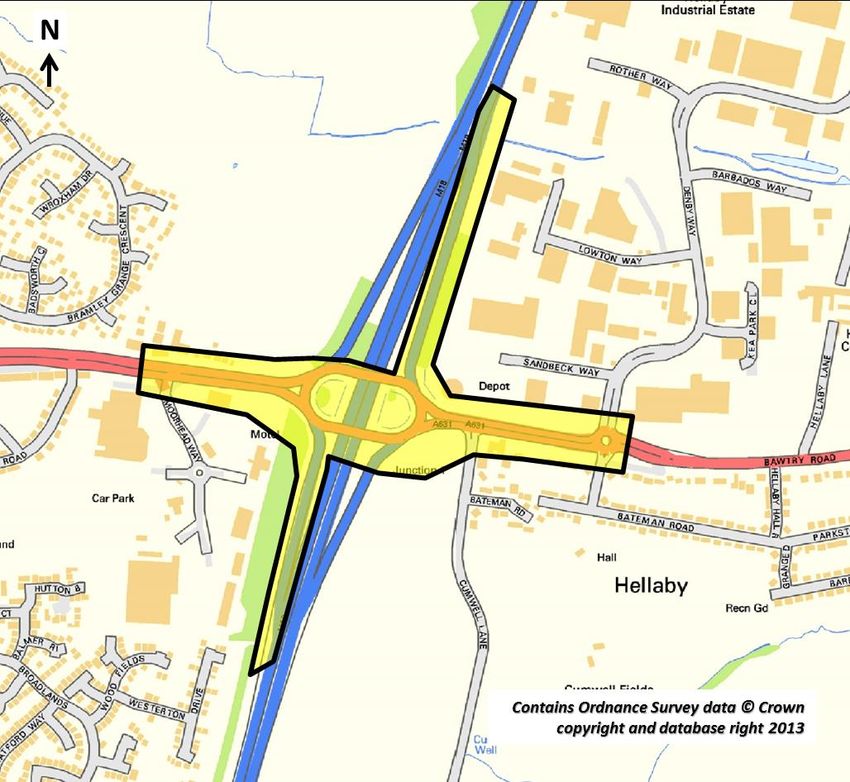
Table of contents
Chapter                                                                  Pages
Glossary                                                                   5
1.     Introduction                                                        7
Background                                                                 7
Purpose of this report                                                     8
2.      Scheme Detail                                                      9
Introduction                                                               9
Background                                                                 9
Location                                                                   9
Pre Scheme Junction Layout                                                10
Post Scheme Junction Layout                                               13
Post Scheme Site Observations                                             14
Stakeholder Feedback                                                      18
3.       Traffic Volumes                                                  20
Introduction                                                              20
Data Source                                                               20
Traffic Volume                                                            20
Daily Traffic Patterns                                                    23
Traffic Turning Movements                                                 25
Summary                                                                   27
4.      Journey Time Analysis                                             28
Introduction                                                              28
Data Source                                                               28
Journey Time Comparison                                                   29
Journey Time Reliability                                                  30
Calculation of annual vehicle hour benefits                               31
Summary                                                                   33
5.      Safety Impacts                                                    34
Introduction                                                              34
Data Source                                                               34
Post-Scheme                                                               36
Accident Rate Change                                                      36
Accident Causation                                                        37
Summary                                                                   38
6.      Economy                                                           39
Introduction                                                              39
PAR and Outturn Comparison                                                39
Summary                                                                   40
7.     Other Impacts                                                      42
Journey Quality                                                           42
Landscape                                                                 42
Physical Activity                                                         42
Severance                                                                 43
Noise                                                                     43
Air Quality                                                               43
Greenhouse Gases                                                          43
Heritage of Historic Resources                                            43
Biodiversity                                                              43

Atkins POPE of LNMS | M18 J1 Traffic Signals | December 2014 | 5107696         3
Water Environment                                                                                                                                   43
Security                                                                                                                                            44
8.    Conclusions and Recommendations                                                                                                               45
Scheme Specific Objectives                                                                                                                          45
Lessons Learned                                                                                                                                     46
Appendices                                                                                                                                          47
Appendix A.              Before Scheme Journey Times                                                                                                48
Appendix B.              After Scheme Journey Times                                                                                                 49
Appendix C.              Journey Time Reliability Comparison Graphs                                                                                 50
Appendix D.              Arm-to-Arm Annual Vehicle Hour Changes                                                                                     52
Appendix E.              Appraisal Summary Table (AST)                                                                                              53
Appendix F.              Evaluation Summary Table (EST)                                                                                             54

Tables
Table 2.1 – Summary of M18 J1 Signals LNMS ............................................................................................... 9
Table 2.2 – Pre-Scheme Junction Turning Flows ........................................................................................... 12
Table 3.1 – Changes in Average Annual Traffic on Motorways since 2010 Q3 .............................................. 21
Table 3.2 – Pre & Post-Scheme Change in Average Daily Traffic on M18 J1 Slips ....................................... 22
Table 4.1 – Journey Time Analysis: Time Period Splits .................................................................................. 28
Table 4.2 – Difference in Before and After Journey Times (seconds per vehicle) .......................................... 29
Table 4.3 – Total Weekly Arm-to-Arm Vehicle Flow Matrices by Period ......................................................... 32
Table 4.4 – Annual Vehicle Hour Savings, by Approach Arm ......................................................................... 32
Table 5.1 – 5 Year Pre Scheme Accident Rates ............................................................................................. 35
Table 5.2 – Post-Scheme Accident Summary ................................................................................................. 36
Table 5.3 – Impact of Scheme on Accident Rates .......................................................................................... 36
Table 5.4 – Impact on Vehicle Movements leading to Accidents per Annum ................................................. 37
Table 5.5 – Impact on Contributory Factors to Accidents per Annum ............................................................. 37
Table 6.1 – PAR and Outturn Economy Comparison ...................................................................................... 40
Table 8.1 – Scheme Specific Objectives ......................................................................................................... 46

Figures
Figure 1.1      Location Plan ............................................................................................................................. 7
Figure 2.1      Junction Location Context Plan ............................................................................................... 10
Figure 2.2      Pre-Scheme Junction Layout................................................................................................... 11
Figure 2.3      Post-Scheme Junction Layout ................................................................................................. 13
Figure 2.4       AM Peak A631 East Queuing (facing west from Denby Way) at 0810 .................................. 15
Figure 2.5      AM Peak A631 East Queuing (facing east from Denby Way) at 0810 .................................... 15
Figure 2.6      AM Peak Traffic on Denby Way at 0810 ................................................................................. 16
Figure 2.7      Traffic on A631 East Approach Arm at 8.20am ....................................................................... 17
Figure 2.8      AM Peak Circulatory Carriageway Queuing ............................................................................ 18
Figure 3.1      Monthly AWT on the M18 (Mainline and Slip Road Exits) ....................................................... 20
Figure 3.2      Daily Traffic Flow on the A631 Either Side of the Junction ..................................................... 22
Figure 3.3      Average Weekday Hourly Traffic Flow into the Junction (June 2014)..................................... 23
Figure 3.4      Average Saturday Hourly Traffic Flow into the Junction (June 2014) ..................................... 24
Figure 3.5      Average Sunday Hourly Traffic Flow into the Junction (June 2014) ....................................... 25
Figure 3.6 All Vehicle Turning Flows (March 2008) ........................................................................................ 26
Figure 5.1      Accident Analysis Area ............................................................................................................ 35

Atkins POPE of LNMS | M18 J1 Traffic Signals | December 2014 | 5107696                                                                                     4
Glossary
 Term                       a.k.a.       Definition
 Accessibility              -            Accessibility can be defined as ‘ease of reaching’. The
                                         accessibility objective is concerned with increasing the
                                         ability with which people in different locations, and with
                                         differing availability of transport, can reach different
                                         types of facility.
 Annual Average             AADT         The 24 hour total traffic flow for the average day of the
 Daily Traffic                           year
 Appraisal Summary          AST          This records the impacts of the scheme according to
 Table                                   the Government’s five key objects for transport, as
                                         defined in DfT guidance contained on its Transport
                                         Analysis Guidance web pages, WebTAG
 Automatic Traffic          ATC          An automated method of recording the volume (and
 Count                                   sometimes classification) of vehicles passing a
                                         particular point on a road.
 Average Daily              ADT          The 24 hour total traffic flow on an average day over a
 Traffic                                 certain time period (Monday – Sunday)
 Average Weekday            AWT          The 24 hour total traffic flow on an average weekday
 Traffic                                 over a certain time period (Monday – Friday)
 Benefit Cost Ratio         BCR          Benefit Cost Ratio is a ratio identifying the relationship
                                         between cost and benefits of a proposed project
 Capitalisation             -            The process by which benefits for a scheme are
                                         factored to give an estimate for the appropriate
                                         appraisal period
 Department for             DfT          A Government department whose objective is to
 Transport                               oversee the delivery of a reliable, safe and secure
                                         transport system that responds efficiently to the needs
                                         of individuals and business whilst safeguarding our
                                         environment. The HA is an executive of the DfT
 Discounting                -            A technique used to compare costs and benefits that
                                         occur in different time periods and is the process of
                                         adjusting future cash flows to their present values to
                                         reflect the time value of money, e.g. £1 worth of
                                         benefits now is worth more than £1 in the future. A
                                         standard base year needs to be used which is 2002 for
                                         the appraisal used in this report
 Dis-benefit                -            A negative benefit or something that detracts from the
                                         performance.
 Evaluation                 EST          In POPE studies, this is a summary of the evaluations
 Summary Table                           of the TAG objectives using a similar format to the
                                         forecasts in the AST

Atkins POPE of LNMS | M18 J1 Traffic Signals | December 2014 | 5107696                                5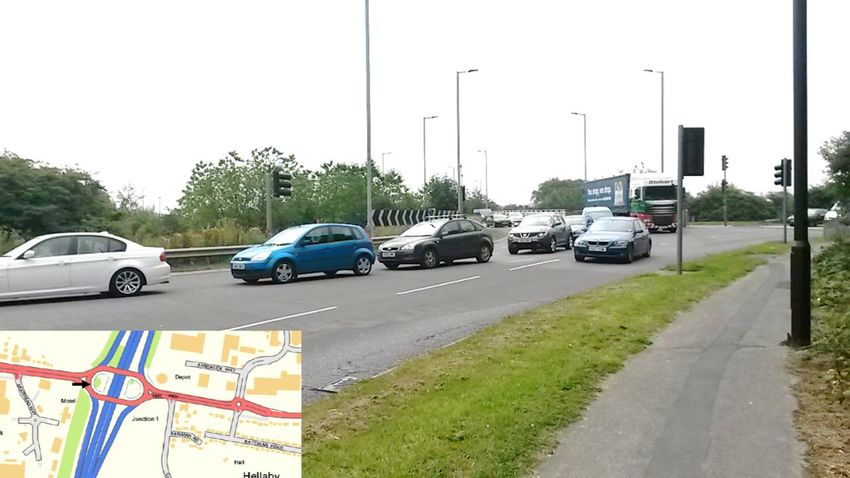
First Year Rate of         FYRR         First Year Rate of Return is the ratio of money gained
 Return                                  on an investment relative to the amount of money
                                         invested.
 Highways Agency            HA           An Executive Agency of the DfT, responsible for
                                         operating, maintaining and improving the strategic road
                                         network in England
 Killed or Seriously        KSI          A term used to describe the number of people killed or
 Injured                                 seriously injured as a result of PICs.
 Local Network              LNMS         LNMS are improvement schemes where total overall
 Management                              estimated cost (including design, land, works,
 Scheme                                  supervision, risk and VAT) is less than £10 million.
                                         They are categorised by the Government under Safety,
                                         Economy, Accessibility, Integration and Environment
 Managing Agent             MAC          Responsible for the operation, maintenance, and
 Contractor                              improvement of the motorway and trunk road network
                                         of a HA area
 New Approach to            NATA         Used for transport scheme appraisal since 1998
 Appraisal
 Optimism Bias              -            Is a demonstrated systematic, tendency for project
                                         appraisers to be overly optimistic, and in effect, results
                                         in an underestimation of scheme costs. The base cost
                                         estimate is adjusted to account for optimism bias in
                                         order to obtain more accurate cost estimates.
 Project Appraisal          PAR          A key document summarising the need for a project,
 Report                                  plus its costs and benefits (including those that cannot
                                         be quantified in monetary terms)
 Personal Injury            PIC          A term commonly used to refer to road accidents
 Collison
 Post-Opening               POPE         Before and after monitoring of all highway schemes in
 Project Evaluation                      England
 Present Value of           PVC          Present Value of Costs is a term used in cost-benefit
 Costs                                   analysis and project appraisal that refers to the
                                         discounted sum, or Present Value, of a stream of costs
                                         associated with a project or proposal
 Risk Allowance             -            Risk refers to identifiable future situations that could
                                         result in an over spend or under spend occurring. The
                                         base cost estimate is adjusted to account for risk in
                                         order to obtain more accurate cost estimates
 Severance                  -            Community severance is the separation of adjacent
                                         areas by road or heavy traffic, causing negative impact
                                         on non-motorised users, particularly pedestrians
 -                          STATS        A database of injury accident statistics recorded by
                            19           police officers attending accidents
 Traffic Database           TRADS        Traffic count database developed by the HA, to hold
 System                                  data from traffic monitoring sites on the strategic
                                         network

Atkins POPE of LNMS | M18 J1 Traffic Signals | December 2014 | 5107696                                6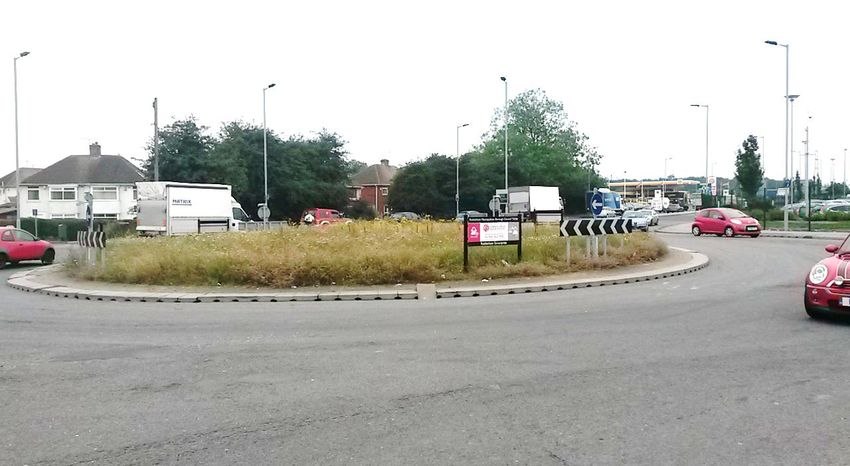
1. Introduction
Background
1.1. This report is the Post-Opening Project Evaluation (POPE) of the M18 J1
Signals Local Network Management Scheme (LNMS).
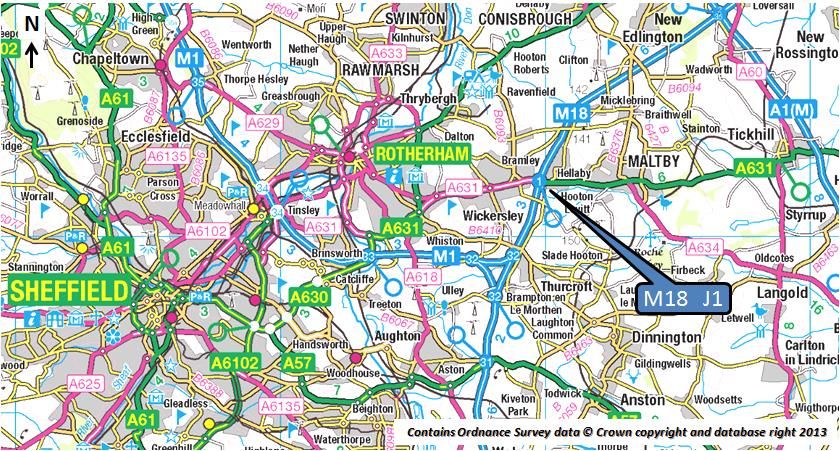
1.2. M18 Junction 1 is situated midway between Rotherham to the west and Maltby
to the east. The junction is formed by the motorway slip roads and the A631. The
A631 is a busy local road of significant importance which connects Junction 1
with Rotherham and Maltby/Bawtry to the west and east respectively. The
location of the junction is indicated in Figure 1.1.
Figure 1.1 Location Plan
1.3. The interchange was a four-arm, partially signalised roundabout with the
northbound motorway approach controlled by full time traffic signals. The other
three (southbound exit-slip and both A631 approaches) were priority controlled.
1.4. The scheme was developed to address issues with delays and congestion on the
M18 southbound exit slip road which affected the AM and PM peak hours. The
A631 approaches also suffered from extensive queuing and delays.
Furthermore, there was a safety issue associated with the junction with 42
Personal Injury Collisions (PICs) occurring during a five year period prior to the
scheme.
1.5. The scheme introduced new traffic signals on the M18 southbound exit and A631
approach arms to mean all arms of the junction became fully signalised. The
circulatory carriageway was also widened to provide three lanes throughout. The
junction was linked to MOVA and new lane and destination markings were also
Atkins POPE of LNMS | M18 J1 Traffic Signals | December 2014 | 5107696 7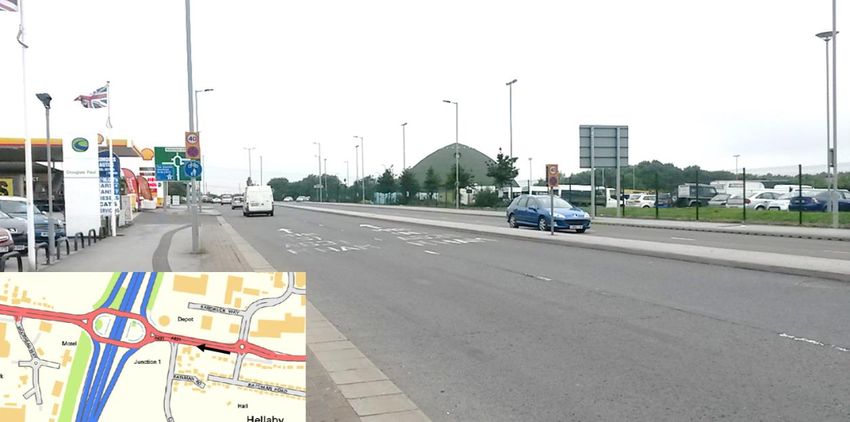
introduced on the slip road approaches. High friction surfacing was also installed
           on all approaches and around the circulatory carriageway.

1.6.       Scheme construction began on 9th January 2012 and the scheme opened on the
           17th March 2012.

           Purpose of this report
1.7.       As part of an ongoing programme, whereby the Highways Agency (HA)
           evaluates the impacts of trunk road schemes, Atkins is commissioned to
           undertake post-opening evaluations of LNMS with an implementation cost of
           between £25k and £10m.

1.8.       This report sets out the results of the POPE of the M18 J1 LNMS. More
           specifically, this report examines the economic and safety impacts resulting from
           the improvements, with consideration also given to wider impacts on the
           environment and society.

1.9.       It is intended that the findings from this report will feed into a wider summary of
           the outcomes of POPE. This is a document (namely the LNMS Annual
           Evaluation Report) produced in the 4th quarter of each year outlining the key
           messages from the entire POPE of LNMS process.

Atkins POPE of LNMS | M18 J1 Traffic Signals | December 2014 | 5107696                           8
2.         Scheme Detail
           Introduction
2.1.       This section of the report outlines the pre-scheme and post-scheme layout of the
           roundabout, using photos, diagrams and site observations to illustrate the
           changes made to the highway network. In addition, this section contains the
           views and feedback on the scheme from key stakeholders.

           Background
2.2.       The M18 J1 Signals LNMS introduced signals onto three approach arms of this
           four-arm roundabout. The remaining arm had already been signalised previously.
           The circulatory carriageway was also widened and MOVA integrated with the
           signals equipment. Table 2.1 summarises the scheme details.

                         Table 2.1 – Summary of M18 J1 Signals LNMS

 Scheme name              M18 J1 Signals
 Area                     12
 Opening date             17th March 2012
 Category                 Economy
                          The scheme was developed to address issues with delays and
                          congestion on the M18 southbound exit slip road, which affected the
 Reason for               AM and PM peak hours. The A631 approaches also suffered from
 scheme                   extensive queuing and delays. Furthermore, there was a safety issue
                          associated with the junction with 42 Personal Injury Collisions (PICs)
                          recorded in the PAR during a five year prior to the scheme.
                          To reduce AM and PM peak congestion and delay on the M18
 Objectives               southbound exit slip road and both A631 approaches
                          To reduce the annual accident rate
                          An economic study was undertaken which considered five alternative
 Alternative              options in addition to the delivered scheme. These included a part
 options                  signalisation solution which would have negated the need for
                          widening on the southbound exit slip road.

           Location
2.3.       The scheme is located at M18 Junction 1; known as Bramley Interchange. The
           M18 at this point is of dual three lane motorway standard and passes below
           Bramley interchange in a north/south orientation. The A631 is a busy local road
           of significant importance which connects Junction 1 with Rotherham and
           Maltby/Bawtry to the west and east respectively.

2.4.       Hellaby Industrial Estate is located to the immediate north-east of the junction
           which covers an area of around 0.95 km2. The industrial estate meets the A631
           around 300m east of the motorway junction at Denby Way. The outskirts of
           Maltby lie around 1.5 km east of the junction along the A631.

Atkins POPE of LNMS | M18 J1 Traffic Signals | December 2014 | 5107696                        9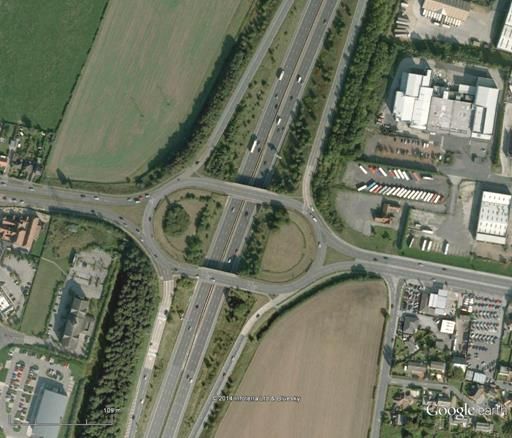
2.5.       Towards Rotherham, there is a retail park (which includes a gym, Morrisons
           store, hotel and McDonalds) to the immediate south-west of the junction. The
           outskirts of Bramley then begin within a few hundred metres of the motorway
           junction. The centre of Rotherham is around 7 km west of the motorway junction.

2.6.       Figure 2.1 indicates the local context of the junction.

                          Figure 2.1 Junction Location Context Plan

           Pre Scheme Junction Layout
2.7.       Prior to the scheme, the interchange was a four-arm partial signalised
           roundabout as shown in Figure 2.2.

2.8.       The northbound motorway approach was controlled by full time traffic signals
           with the other three (southbound exit-slip and both A631 approaches) all priority
           controlled.

Atkins POPE of LNMS | M18 J1 Traffic Signals | December 2014 | 5107696                     10
Figure 2.2 Pre-Scheme Junction Layout
2.9. The circulatory carriageway was three lanes along the southern section, but two
lanes for the majority of the junction. The approaches to the signalised section
were designated with lane and destination markings but no other approach arms
had destination markings.
2.10. There were only limited sections of high friction surfacing at various locations
around the junction. Controlled pedestrian facilities were provided with the
signalised M18 northbound approach but no other facilities were provided. In
some areas footways ran up to the arms but without any formal provision to
make crossing safe.
2.11. With this layout, the PAR states there were regular issues with delays and
congestion on the M18 southbound exit slip road. This was common in both the
AM and PM peak hours with queuing traffic also affecting traffic flow along the
M18 southbound mainline. The A631 approaches also suffered from extensive
queuing and delays.
2.12. In developing the PAR, the MAC prepared an improvements study which
assessed traffic volume and delay at the junction. A 12-hour turning count was
recorded at the junction on 18th March 2008 which identified all movements at
the junction. Details for the 12 hour period (0700-1900) are presented in Table
2.2.
Atkins POPE of LNMS | M18 J1 Traffic Signals | December 2014 | 5107696 11Table 2.2 – Pre-Scheme Junction Turning Flows
12 hour M18 A631 M18 A631 Total
(0700-1900) North West South East Flow
From
31 2,439 15 2,000 4,485
M18 North
0.1% 5.4% 0.0% 4.5% 10.0%
2,640 0 3,429 7,373 13,442
A631 West
5.9% 0.0% 7.6% 16.4% 30.0%
0 3,878 0 6,324 10,202
M18 South
0.0% 8.6% 0.0% 14.1% 22.7%
1,925 8,079 6,298 415 16,717
A631 East
4.3% 18.0% 14.0% 0.9% 37.3%
4,596 14,396 9,742 16,112
Total Flow To 44,846
10.2% 32.1% 21.7% 35.9%
2.13. This data demonstrates that before the scheme, the largest traffic movements
were between the east and west arms with 18.0% of trips made eastbound and
14.0% of trips made westbound across the junction over the 12 hour period.
2.14. The A631 East approach is the busiest, accounting for 37.3% of all vehicles
approaching and 35.9% of all vehicles leaving the junction over the 12 hour
period. 35.9% of all vehicles using the junction exited onto the A631 East, with
32.1% exiting onto the A631 West.
2.15. The data also shows there were very similar levels of vehicles entering and
exiting each of the four arms of the roundabout across the day. This suggests
that vehicles use the same routes when travelling to and from their destinations
and there is a general equilibrium in trip making across the whole of the
interchange.
2.16. In preparing the report, the MAC also undertook queue length and delay surveys
on all approaches at 10-minute intervals across the AM and PM peaks. The most
significant queues were observed on the A631 East approach with a maximum
queue of 132 vehicles per lane (450 seconds delay) in the AM peak and 183
vehicles per lane in the PM peak (526 seconds delay). Queues of more than 60
vehicles were also observed on the A631 West approach in both the AM and PM
peaks. The maximum queue observed on the M18 Southbound exit slip was 38
vehicles per lane in both the AM and PM peaks with delays of 420 seconds and
411 seconds respectively.
2.17. As well as congestion issues, there was a safety issue associated with the
junction, the PAR recording 42 Personal Injury Collisions (PICs) during a five
year period prior to the scheme.
Atkins POPE of LNMS | M18 J1 Traffic Signals | December 2014 | 5107696 12Post Scheme Junction Layout
2.18. Details of the scheme are shown in Figure 2.3. The scheme introduced new
traffic signals on the M18 southbound exit and A631 approach arms to mean all
arms of the junction became fully signalised. The traffic signals are all linked up
to MOVA meaning the signals can run dynamically based on flow to provide a
high level of efficiency.
Figure 2.3 Post-Scheme Junction Layout
2.19. The circulatory carriageway was also widened on the north, east and western
sides to now provide three lanes throughout. This has significantly increased the
capacity of the junction. Appropriate signing on the slip roads was introduced to
give advanced warning of the signals.
2.20. New lane and destination markings have been introduced on all of the slip road
approaches. This was with the specific intention of making navigation clearer for
drivers and hoping to reduce the number of ‘lane change’ accidents occurring at
the junction. The likelihood of an accident being caused by a vehicle failing to
give way should also be eradicated by the removal of the priority arrangement
and the introduction of the signal controls.
Atkins POPE of LNMS | M18 J1 Traffic Signals | December 2014 | 5107696 132.21. High friction surfacing was also improved in some areas and added to other
areas to provide the measure on all approaches and around the circulatory
carriageway.
2.22. Pedestrian accessibility around the junction was also improved with new
pedestrian and cyclist facilities integrated into the junction as part of the traffic
signals.
Post Scheme Site Observations
2.23. A site visit was undertaken during the AM peak (0730 – 0845) on Wednesday
23rd July 2014. The weather was dry and cloudy on the day. There were no
known incidents or roadworks close by on the network which would mean that
traffic activity was atypical, although the overall traffic flow could be slightly lower
than at other times of the year as a result of the start of the summer holiday
period.
2.24. All of the scheme elements were seen to be in place and operational. Some of
the road markings were beginning to fade; a result of the scheme having been in
situ for over two years and the high level of traffic which uses the area.
2.25. Generally, traffic operations at the junction appeared to function well with only
sporadic instances of queuing and delay on certain arms of the junction. Across
the whole junction it was observed that short green times were in place, meaning
traffic was quickly moving around and through the junction.
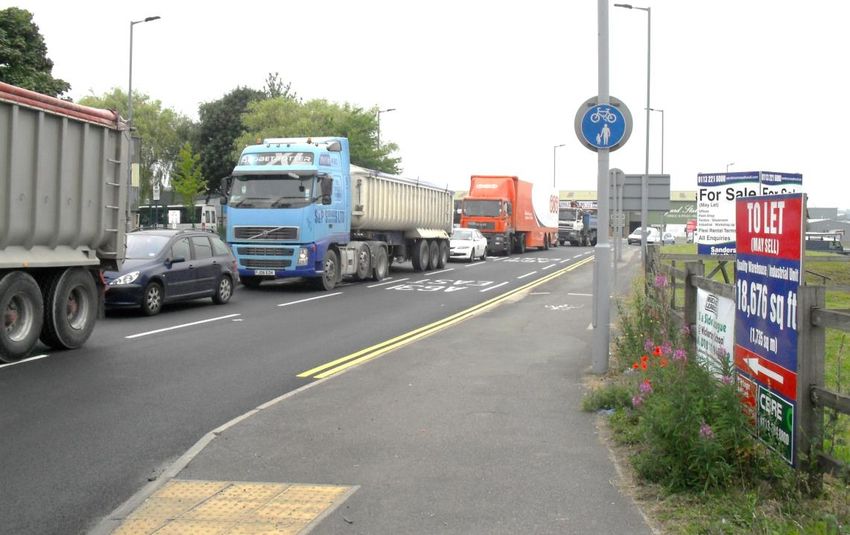
2.26. The most notable delays on the approach arms were observed on the A631
East. Traffic queues were observed at around 0740 between the junction and
Denby Way. This peaked at around 0810, when queues extended to around 500
metres and ran back from the junction stop line, through the roundabout which
the A631 forms with Denby Way and beyond the signalised pedestrian crossing
on the A631. This queuing is shown in Figure 2.4 and Figure 2.5.
2.27. It was clear that traffic on the A631 favoured the left hand traffic lane, suggesting
that most traffic is turning left to the M18 southbound or straight ahead towards
Rotherham. The right hand lane can also be used by traffic travelling across
towards Rotherham although it was noticeably less well used. Given the traffic
turning count information, it was clear that a large proportion of the arrivals on
this arm are travelling straight across the junction and so it was unclear why the
right hand lane was not more heavily used. It could be due to the markings not
being clear for drivers, or people may be being deterred from using the right
hand lane as there is an increased chance of being blocked on the circulatory
carriageway when they arrive at the desired exit.
Atkins POPE of LNMS | M18 J1 Traffic Signals | December 2014 | 5107696 14Figure 2.4 AM Peak A631 East Queuing (facing west from Denby Way) at
0810
Figure 2.5 AM Peak A631 East Queuing (facing east from Denby Way) at 0810
2.28. In observing the operation of the link, it appeared that the delay in getting to M18
J1 was notably impacted by traffic movements to/from Denby Way. Denby Way
is the main access for Hellaby Industrial Estate which contains a large number of
industrial and warehouse spaces.
2.29. During a 10 minute period at around 0810, there was a constant demand of
vehicles leaving the Industrial Estate, including a high proportion of HGVs.
Almost all of these vehicles turned right to travel towards the motorway junction.
Atkins POPE of LNMS | M18 J1 Traffic Signals | December 2014 | 5107696 152.30. Figure 2.6 shows vehicles queuing on Denby Way, waiting to join the A631
westbound towards the motorway. The left traffic lane is noticeably less well
used with little demand for travel towards Maltby.
Figure 2.6 AM Peak Traffic on Denby Way at 0810
2.31. This traffic turning out onto the A631, and predominantly attempting to merge
into the left hand lane, exacerbates other congestion leading to additional delay
impacts for the A631 East approach arm.
2.32. As with the other traffic signals at the motorway junction, the operation of the
A631 East approach was observed to operate with a quick interchange between
green time for the approach arm and the circulatory carriageway (both signals
had around seven seconds of green time). On occasion, this meant that the
A631 East approach was stopped despite the build-up of queues, when the
circulatory carriageway was only lightly trafficked.
2.33. The build-up of queues were observed to dissipate quickly at around 0820. As
well as a possible reduction in the traffic approaching from the Maltby area, this
coincided with a notable decline in the traffic demand turning out of Denby Way.
2.34. Figure 2.7 shows the approach to the motorway at 0820 without any significant
queues or delay.
Atkins POPE of LNMS | M18 J1 Traffic Signals | December 2014 | 5107696 16Figure 2.7 Traffic on A631 East Approach Arm at 8.20am
2.35. On the other approach arms there were no notable issues observed with traffic
flow generally able to clear on each cycle of the traffic signals. The MAC’s pre-
scheme improvements study identified that there were significant delays on the
A631 West approach arm although this was not observed on site, with all traffic
able to enter the junction. The improvements study did identify that delays were
worse in the PM peak, and so it may be that queues do occur in the PM peak.
No site observations were made during the afternoon period.
2.36. On the circulatory carriageway, the junction appeared to operate reasonably well
with only the occasional blocking. Blocking was most noticeable on the western
side of the junction, when traffic waiting at the signals on the circulatory
carriageway would infrequently extend back so as to block one lane of the traffic
leaving the junction onto the A631 West towards Rotherham. All of the traffic was
able to clear on each cycle of the traffic signals and the timing of the lights meant
that any blocking did not occur for more than a few seconds. This is shown in
Figure 2.8.
Atkins POPE of LNMS | M18 J1 Traffic Signals | December 2014 | 5107696 17Figure 2.8 AM Peak Circulatory Carriageway Queuing
2.37. It is therefore concluded that overall, the operation of the junction appears to
operate reasonably well, however the A631 East approach arm is impacted by
traffic movements out of Denby Way. The queuing which was observed was
significant but dissipated quickly after peak conditions. Observations of the signal
timings would suggest that often a slightly longer green time could be afforded to
the approach arms without any significant congestion impacts on the circulatory
movements. This would help to reduce the length of queues on the approaches.
2.38. As well as providing the signal controls for vehicles, pedestrian and cyclist
facilities were significantly improved as a result of the scheme with crossings
now providing continuous routes through and around the junction. The
pedestrian and cycle routes were all well signed, and were well maintained on
site. In terms of actual use however, there was only infrequent pedestrian and
cyclist activity observed throughout the period of the site visit.
Stakeholder Feedback
2.39. While the analysis in this report can consider the quantifiable impact of this
scheme based on empirical data, it is also worth considering the opinions of
major stakeholders of the scheme. For example, a scheme may save journey
times in practice, but if this saving isn’t perceived, the scheme may not be as
successful as first thought.
2.40. The major stakeholders contacted for feedback on the M18 J1 Signals scheme
are:
Rotherham Metropolitan Borough Council; and
Highways Agency.
2.41. The remainder of this section outlines the responses received from these
stakeholders.
Atkins POPE of LNMS | M18 J1 Traffic Signals | December 2014 | 5107696 18Rotherham Metropolitan Borough Council
2.42. A response was received on behalf of the Council comprising comments from
Ian Ashmore (transportation and traffic manager) and Mick Powell (Senior
Engineer). In summary:
“There appears to be an on-going issue with signal operation. Experience of it taking
3 cycles of the signals to clear to stop line on a Saturday afternoon where traffic flow was
light. It’s not an overly congested junction, therefore I suggest there is an ongoing
operational issue.”
“I recently travelled through the junction in the AM Peak and observed a significant queue
on Bawtry Road (westbound from Maltby). The signals were running with very short
greens on that approach and reverting to the circulatory with no traffic at all on this
approach.”
“We are aware that the signal timings are a regular issue which has also been reported
by colleagues working at the Hellaby Depot who can observe the junction from their site.”
Highways Agency
2.43. Tim Calvert (Service Delivery Manager (South Yorkshire)) provided some brief
comments.
“I am aware that there have been issues with excessive queuing on the westbound
approach (local road network) from Hellaby/Maltby particularly during the morning peak.”
“The signals were officially handed over to the NE TechMAC (Amey) on 12 Feb 2013.”
2.44. Overall, it appears that there are perceived to be some on-going issues with the
junction signals, and that the timings could be reviewed with a view to improving
the efficiency of the junction.
Atkins POPE of LNMS | M18 J1 Traffic Signals | December 2014 | 5107696 193. Traffic Volumes
Introduction
3.1. This section of the report considers the impact that the M18 J1 Signals Large
LNMS has had on traffic volumes.
Data Source
3.2. As scheme planning and construction is a process that takes a number of years,
it is important to understand how traffic volumes have changed over time and
whether this will impact the way the scheme performs. To understand this, traffic
data from three sources has been assessed:
Continuous ATC data collected on the M18 J1 Mainline and Exit Slip Roads,
as collected by the Highways Agency (TRADS);
ATC data collected in both directions on the A631 Bawtry Road during a two
week period of June 2014 to support this scheme evaluation; and
A turning count collected by the MAC for the junction in March 2008 is used
to understand turning movements and turning proportions.
Traffic Volume
M18 Mainline and M18 Slip Road Approach Arms
3.3. TRADS count sites on both the motorway exit slip roads, and the M18 mainline
through the junction have been evaluated. The Average Weekday Traffic (AWT)
on a monthly basis is shown in Figure 3.1.
Figure 3.1 Monthly AWT on the M18 (Mainline and Slip Road Exits)
45
Thousands
Construction
Northbound Through the Junction Period
40
35
30
Southbound Through the Junction
Number of Vehicles
25
20
15
10
Northbound Slip Road
5
Southbound Slip Road
0
Sep
Nov
Dec
Feb
Nov
Dec
Jan 2012
Feb
Nov
Dec
Feb
Nov
Dec
Feb
July 2010
Aug
Jan 2011
Apr
Apr
Aug
Sep
Mar
Aug
Sep
Mar
Jan 2013
Mar
Apr
Aug
Sep
Jan 2014
Apr
Mar
May
Oct
May
Jun
Jul
Oct
May
Oct
May
Oct
Jun
Jul
Jun
Jul
Jun
Jul
Month
Atkins POPE of LNMS | M18 J1 Traffic Signals | December 2014 | 5107696 203.4. The data shows that traffic flow patterns have remained relatively consistent
before and after the implementation of the scheme. There is also little difference
in 2014 than in 2013 suggesting there has been no traffic growth in the periods
since the scheme opened.
3.5. The chart demonstrates that the northbound exit slip road carries around twice
as much traffic as the southbound exit slip road and that the volume of traffic on
the slip roads is relatively constant throughout the year.
3.6. Vehicle flow on the mainline through the junction is shown to experience
seasonal variation with traffic relatively constant through spring to autumn, but
with a reduction each winter. Lower traffic levels through winter are considered
typical across the highway network as wintery bad weather tends to reduce the
traffic on the network. However, this effect is hardly evident in the traffic volume
on the junction slip roads.
3.7. The chart also suggests that there has been a small overall increase in the M18
mainline vehicle flow since 2010. To understand how this trend compares to the
national traffic growth, Table 3.1 presents DfT statistics on Great British road
traffic on motorways between 2010 Q3 and 2014 Q1, adjusted for seasonality.
Table 3.1 – Changes in Average Annual Traffic on Motorways since 2010 Q3
Variation from 2010 Q2 % Change from
Period
(Billion vehicle miles) 2010 Q2
2010 Q3 0.0 0.0%
Q4 -0.3 -1.9%
2011 Q1 0.1 0.6%
Q2 0.0 0.0%
Q3 0.0 0.0%
Q4 0.1 0.6%
2012 Q1 0.2 1.3%
Q2 -0.1 -0.6%
Q3 0.3 1.9%
Q4 0.4 2.6%
2013 Q1 0.4 2.6%
Q2 0.7 4.5%
Q3 0.8 5.2%
Q4 0.9 5.8%
2014 Q1 1.0 6.5%
3.8. Figure 3.1 shows that there has been a minimal change in traffic flows on the
M18 near to the scheme with Table 3.2 demonstrating that traffic on both
motorway slip road approach arms has slightly decreased (-1.4%) over the
period that the scheme has been developed and opened.
Atkins POPE of LNMS | M18 J1 Traffic Signals | December 2014 | 5107696 21Table 3.2 – Pre & Post-Scheme Change in Average Daily Traffic on M18 J1 Slips
M18 N Slip M18 S Slip
Period Total
Road ADT Road ADT
January 2011 – December 2011 10606 4454 15060
May 2012 – April 2013 10418 4424 14842
Difference 188 30 218
% Change Before and After Scheme -1.8% -0.7% -1.4%
A631 Approach Arms
3.9. An ATC count was undertaken across a two week period on the A631, either
side of the junction. Although data was collected across a 17 day period, issues
with the data collection equipment meant that observations for a number of the
days was unsuitable for analysis. Robust data to the east of the junction was
collected 11th – 19th June 2014 and 16th – 27th June 2014 to the west of the
junction. The daytime traffic observed during the two weeks is shown in Figure
3.2.
Figure 3.2 Daily Traffic Flow on the A631 Either Side of the Junction
3.10. The data shows traffic entering the junction from the two A631 approach arms is
of a similar level across an average 24 hour weekday; between 17,000 and
18,000 vehicles.
Atkins POPE of LNMS | M18 J1 Traffic Signals | December 2014 | 5107696 223.11. When compared to the June 2014 traffic flows observed from the TRADS data
(presented in Figure 3.1), it is evident that the A631 approach arms carry more
traffic into the junction than either of the motorway slip road approaches.
Daily Traffic Patterns
3.12. By studying the daily traffic patterns, it is possible to identify peak periods during
which the junction is subject to high demand. This will help to understand journey
times around the junction and when delays might be expected.
3.13. The HA TRADS sites located on the motorway slip road approaches (June 2014)
and the June 2014 ATC counts on the A631 have been interrogated to gain an
appreciation of the daily flow profile of traffic into the junction (shown in Figure
3.3).
Figure 3.3 Average Weekday Hourly Traffic Flow into the Junction (June 2014)
3.14. In summary:
AM Peak traffic through the junction is experienced between 0700 and
0900 - The data demonstrates that the peak traffic through the junction
occurs across a two hour AM peak, with the A631 West approach providing
the highest traffic flows. The A631 East approach is the second highest
demand flow, with the motorway slip road approaches being relatively less
well used. This is in line with the traditional AM peak period;
PM Peak traffic through the junction is experienced between 1600 and
1800 – The data demonstrates that in excess of 4000 vehicles per hour
travel through the junction across a two hour PM peak. Traffic from the two
A631 approach arms and the M18 South are all of a similar volume (around
Atkins POPE of LNMS | M18 J1 Traffic Signals | December 2014 | 5107696 231200 vehicles per hour) with the M18 North approach being relatively less
busy; and
The junction is at its busiest during the PM Peak. There are around 300
more vehicles using the junction between 1700 and 1800 than between
0700 and 0800.
3.15. Similar data of traffic using the junction is presented in Figure 3.4 for Saturdays
and Figure 3.5 for Sundays.
Figure 3.4 Average Saturday Hourly Traffic Flow into the Junction (June 2014)
Atkins POPE of LNMS | M18 J1 Traffic Signals | December 2014 | 5107696 24Figure 3.5 Average Sunday Hourly Traffic Flow into the Junction (June 2014)
3.16. On Saturdays and Sundays, the peak hour is between 1200 and 1300, with the
heaviest traffic flows observed on the two A631 approach arms. Traffic volumes
approaching from the motorway slip roads are notably smaller with the M18
North arm carrying the lowest flow.
Traffic Turning Movements
3.17. Vehicle turning movements across the 12 hours covered by the count (0700-
1900) have been analysed for the March 2008 turning count alongside the AM
peak (0800-0900) and PM peak (1700-1800) hours. Please note that the M18 J1
Economy Improvements Study by A1+ analysed the 2008 turning count data and
identified the above two peak periods. As these are broadly in line with those
identified when analysing the TRADS data above, we have adopted these time
periods for the below analysis. This is presented in Figure 3.6.
Atkins POPE of LNMS | M18 J1 Traffic Signals | December 2014 | 5107696 25Figure 3.6 All Vehicle Turning Flows (March 2008) Atkins POPE of LNMS | M18 J1 Traffic Signals | December 2014 | 5107696 26
3.18. Some key observations from the turning count data are:
Generally there are similar levels of traffic approaching and exiting each arm
of the junction across the 12 hour count. This suggests that generally the
vehicles use the same routes when travelling to and from their destinations;
Motorway traffic was shown to turn both directions onto the A631 without a
strong preference. For traffic approaching from the north, there is a slightly
higher proportion that turned right to travel towards Rotherham than turned left
to travel towards Maltby. In contrast, slightly more traffic approaching from the
south turned right to travel towards Maltby than turned left to travel towards
Rotherham;
On each of the A631 approach arms, the dominant movement was straight
ahead along the A631; and
More of the A631 traffic uses the junction to turn onto the M18 southbound
(towards the M1), than northbound (towards Doncaster).
Summary
Traffic flows before and after the scheme are of a similar volume;
The A631 approach arms carry more traffic than the M18 approaches, with the
A631 West approach arm carrying the highest traffic flow in the PM Peak;
Turning count data indicates that for A631 traffic, the predominant movement
is straight across the junction; and
Motorway traffic is turning in both directions onto the A631.
Atkins POPE of LNMS | M18 J1 Traffic Signals | December 2014 | 5107696 274. Journey Time Analysis
Introduction
4.1. As an economy scheme, the key justification for this LNMS is a journey time
benefit for road users. The scheme has introduced signals to three arms of the
junction, introduced MOVA and widened the circulatory carriageway to provide
additional capacity. These measures were designed to improve journey times for
vehicles moving through the junction, especially during peak periods.
4.2. To assess the impact, this report considers evidence from before and after the
scheme to ascertain whether there has been a journey time benefit experienced
due to the implementation of the M18 J1 Signals LNMS.
Data Source
4.3. For the journey time analysis, Sat Nav data has been used to inform pre and
post scheme journey times. This data is available from some motorists who use
satellite navigation devices and allow their data to be used anonymously for the
purpose of generating travel statistics. This data can provide crucial intelligence
on the operation of the highway network. The data also has the benefit of being
historic, so that it is possible to retrieve pre-scheme journey time data after the
scheme has opened.
4.4. In order to conduct the analysis, seven time periods have been defined using the
diurnal flow profiles presented in chapter 3 as a guide. The time periods have
been defined to combine similar hours in terms of flow levels and trip purposes
(commuting/leisure etc). The seven time periods used are listed in Table 4.1.
Table 4.1 – Journey Time Analysis: Time Period Splits
24 Hour Flow Mon-Fri Sat-Sun
Weekday AM Peak 0700 - 0900
Weekday Daytime 0900 - 1500
Weekday PM
1500 - 1600 & 1800 - 1900
Shoulder
Weekday PM Peak 1600 - 1800
7-Day Overnight 1900 - 0700 1900 - 0700
Saturday Daytime 0900 - 1800
Sunday Daytime 1000 - 1700
4.5. The periods of the week which are not covered by these seven time periods
(Saturdays 0700-0900, Saturdays 1800-1900, Sundays 0700-1000, Sundays
1700-1900) are all considered to have journey times similar to the overnight
period, due to the low levels of traffic flow.
4.6. Sat Nav data has been acquired for these time periods over a one year period
before and after the scheme. These periods are defined as:
Pre-scheme: 1st January 2011 to 31st December 2011; and
Atkins POPE of LNMS | M18 J1 Traffic Signals | December 2014 | 5107696 28 Post-scheme: May 2012 to April 2013.
4.7. The post-scheme period allows a month after the scheme has opened to allow
for any bedding-in of the scheme and any initial tweaks to the operation of the
MOVA equipment.
Journey Time Comparison
4.8. The impact of the scheme during each of these seven time periods has been
considered separately. Table 4.2 presents the change in journey time between
the pre-scheme and post-scheme periods for each movement. Negative values
indicate a journey time saving and hence a benefit.
4.9. Table 4.2 shows journey time differences on every movement and every time
period, but in reality, some of the small changes may be due to sampling errors
or if true, may be unperceivable. As a result, only journey time changes in
excess of 10 seconds (positive or negative) are considered when calculating the
annual vehicle hours saved.
4.10. The analysis shows that the scheme has reduced journey times on the M18
North approach arm around the peak periods, but has increased journey times
on the other arms of the junction.
Table 4.2 – Difference in Before and After Journey Times (seconds per vehicle)
Arm Arm To Wkday Wkday Wkday PM Wkday 7-Day Sat Sun
From AM Pk Inter Pk Shoulder PM Pk O/night Daytime Daytime
A631 W -27.86 -3.51 -21.77 -108.59 -1.05 3.96 3.83
M18
M18 S -27.82 -3.73 -24.22 -106.92 1.52 3.06 6.85
N
A631 E -35.65 -11.55 -29.77 -115.93 -5.35 -3.72 -1.60
M18 N -6.79 9.04 18.05 10.14 6.22 10.27 8.83
A631
M18 S 8.66 20.27 23.13 17.47 10.10 19.61 21.39
W
A631 E 0.83 12.45 17.58 8.46 3.24 12.84 12.93
M18 N 38.26 3.99 7.96 -0.75 -2.89 9.10 2.29
M18
A631 W 28.09 -3.34 -2.10 -8.83 -9.98 0.07 -8.59
S
A631 E 45.89 7.40 7.49 -2.44 -5.87 11.67 6.39
M18 N 11.44 16.51 18.00 17.76 15.32 18.82 12.59
A631
A631 W 1.27 9.19 7.94 9.68 8.23 9.78 1.72
E
M18 S 1.32 8.97 5.49 11.35 10.79 8.88 4.74
Negative values indicate a journey time saving and hence a benefit. Savings > 10 secs are highlighted in
Green.
Positive values indicate an increase in journey time and hence a dis-benefit. Increases of > 10 seconds are
highlighted in Red.
4.11. The greatest benefits are observed on the M18 North approach in the PM peak
when a saving of at least 106 seconds is recorded for all movements. The other
Atkins POPE of LNMS | M18 J1 Traffic Signals | December 2014 | 5107696 29arms do however experience a journey time increase with delays increasing by
over 17 seconds for vehicles turning right from the A631 approaches onto the
motorway (A631 W - M18 S & A631 E – M18 N). The M18 South approach
appears to have slightly benefited in the PM peak, although the scale of any
savings are too small to be considered significant.
4.12. In the AM peak, the M18 North is again the only approach that is shown to have
benefited. Although the benefits are less than in the afternoon, journey times for
vehicles entering from the north are between 27 and 36 seconds quicker
depending on the arm-to-arm movement. Dis-benefits are however observed on
each of the other three approaches with the M18 South approach experiencing
the greatest level of additional delay. This is an expected result as this approach
arm was already signalised and so the provision of further signals around the
junction means green time is now shared with other locations. Trips from the
M18 South are up to 45 seconds slower following the opening of the scheme
(right turn: M18 S – A631 E).
4.13. Outside of the peak periods (and PM shoulder peak), there are no periods where
journey times have notably improved. However, dis-benefits are observed across
the weekday interpeak and at weekends. Traffic on the two A631 approach arms
now faces additional delay during all time periods which is in opposition to the
pre-scheme forecasts and the scheme’s objectives. For example, the right turns
from the A631 East to join the M18 northbound is adversely impacted during all
periods of the day.
4.14. Whilst Table 4.2 presents the change in journey times, the actual before and
after journey times observed in the Sat Nav data are presented in Appendix A
and Appendix B respectively.
Journey Time Reliability
4.15. The Sat Nav data also allows any change in journey time reliability to be
quantified, by using the inter-quartile range journey times and the 5th to 95th
percentile journey times. By considering how these ranges have changed from
the pre-scheme year to the post-scheme year the reliability of journey times can
be assessed.
4.16. The Sat Nav data has been extracted as a series of right turning arm-to-arm
vehicle movements which take in the majority of the circulatory carriageway. It is
possible to assess the change in journey time reliability for each of these vehicle
movements to make a robust assessment of how reliability has been affected.
4.17. The graphs presented in Appendix C show the journey time reliability on the four
right turning arm-to-arm vehicle movements assessed:
M18 North to A631 West;
A631 West to M18 South;
M18 South to A631 East; and
A631 East to M18 North.
4.18. In summary, the reliability graphs show:
The M18 North to A631 East movement shows improvements in the AM and
PM Peak periods with a significant improvement in the PM Peak where 95%
of journeys now take up to 198 seconds, compared to 612 seconds
Atkins POPE of LNMS | M18 J1 Traffic Signals | December 2014 | 5107696 30previously. Outside of the peaks, the changes in journey time reliability are
small;
The A631 East to M18 North movement shows a reduction in reliability with
journey times more variable following the opening of the scheme in most time
periods assessed. The exception is the AM peak where journey time
reliability has improved, although with the mean journey time increasing;
The M18 South to A631 East movement shows a sharp decline in reliability
during the AM Peak, but a substantial improvement during the PM peak.
Reliability has got worse in most of the other time periods although there is
an improvement overnight with the 95% percentile decreasing by 82
seconds; and
The A631 East to M18 North movement shows an adverse impact on journey
time reliability across most time periods, including both AM and PM peaks. In
the AM peak, 95th percentile journey times are now 52 seconds slower than
previously.
Calculation of annual vehicle hour benefits
4.19. Table 4.2, presented earlier in this section, demonstrates how journey times
have changed for certain movements and time periods before and after the
scheme’s construction. It is assumed that these changes are a result of the
scheme measures. Therefore, it is necessary to calculate the number of vehicle
hours saved in the opening year, in order to understand and quantify the overall
impact for this evaluation.
4.20. Post-scheme traffic volumes have been identified using June 2014 data from the
TRADS slip-road sites and the ATCs collected on the A631 during June 2014.
4.21. The turning proportions from the June 2008 turning count have been applied to
the traffic entering the junction from each arm in 2014 as a robust estimate of the
number of vehicles making each arm-to-arm movement for the post-scheme
period. Although the 2008 count was collected more than three years prior to the
scheme works, traffic volume analysis (presented in Figure 3.1) indicates that
traffic did not change notably during this period so it was felt to be remain a
robust source of traffic information. Furthermore, traffic volumes recorded on the
A631 in the 2008 junction turning count has been compared to the June 2014
ATC data for the A631 approaches. This reaffirms that there has not been a
significant changes in traffic levels and there is therefore no requirement to
include a rule of half adjustment to the vehicle hour savings1.
4.22. As outlined previously, the journey time assessment focuses on seven time
periods and hence it is the vehicle movements during these periods which are
relevant to the vehicle hour savings calculations.
4.23. Weekly vehicle movement matrices, factored to Post-Scheme April 2014, are
presented in Table 4.3. These present the total vehicle movements in each time
period.
1 Note that Rule of Half (RoH) is triggered when the flow changes increases by over 10%.
On these occasions we can be confident that the flow difference is related to the scheme
and not just traffic survey errors. Under the rule of half, the existing traffic experiences the
full benefit, whereas the additional traffic volume only experiences half of the benefit.
Atkins POPE of LNMS | M18 J1 Traffic Signals | December 2014 | 5107696 31Table 4.3 – Total Weekly Arm-to-Arm Vehicle Flow Matrices by Period
Arm Arm To Wkday Wkday Wkday PM Wkday 7-Day Sat Sun
From AM Pk Inter Pk Shoulder PM Pk O/night Daytime Daytime
A631 W 2305 3042 3910 1170 983 4638 440
M18
M18 S 16 32 8 2 2 10 4
N
A631 E 1715 2573 3398 1017 854 4030 334
M18 N 3936 2298 4802 1431 1029 5084 360
A631
M18 S 5052 2759 6613 1970 1417 7002 449
W
A631 E 5108 7047 17015 5070 3645 18015 1274
M18 N 0 0 0 0 0 0 0
M18
A631 W 2852 5137 7213 1879 1343 6742 734
S
A631 E 5854 6892 12852 3348 2393 12014 1044
M18 N 2228 999 3501 998 753 3615 177
A631
A631 W 4480 6205 15980 4557 3435 16500 1174
E
M18 S 5165 4769 11165 3184 2400 11528 804
Total 38711 41753 86457 24626 18254 89178 6794
4.24. The arm-to-arm vehicle movements outlined in Table 4.3 are multiplied by the
differences in journey times outlined in Table 4.2 to identify the total weekly
vehicle hour savings. As outlined above, only changes in journey time which are
greater than 10 seconds are included in the calculation to isolate only the
changes which are perceivable and therefore tangible.
4.25. Weekly vehicle hour savings are multiplied by 52 to calculate the annual vehicle
hour savings. The annual resulting vehicle hour savings are summarised, by
approach arm, in Table 4.4.
4.26. A full breakdown of the vehicle hour savings by arm-to-arm movement is
presented in Appendix D.
Table 4.4 – Annual Vehicle Hour Savings, by Approach Arm
Arm Wkday Wkday Wkday PM Wkday 7-Day Sat Sun Total
AM Pk Inter Pk Shoulder PM Pk O/night Daytime Daytime
M18 N -1,817 -429 -2,694 -3,541 -8,481
A631 W 2,075 7,782 707 207 6,078 377 17,226
M18 S 5,037 2,025 7,063
A631 E 368 238 910 778 541 983 32 3,850
Total 3,588 1,884 5,999 -2,056 748 9,086 409 19,658
Negative values indicate a journey time saving and hence a benefit. These are highlighted in Green.
Positive values indicate an increase in journey time and hence a dis-benefit. These are highlighted in Red.
Atkins POPE of LNMS | M18 J1 Traffic Signals | December 2014 | 5107696 324.27. Table 4.4 demonstrates:
Overall the scheme has resulted in an increase in journey times through the
junction, producing 19,658 vehicle hours of journey time dis-benefits in the
opening year;
Only traffic entering from the M18 North approach is shown to have reduced
journey times; this is the arm which carries the lightest traffic volumes;
The A631 West approach is shown to be most significantly adversely
impacted with 17,226 additional vehicle hours of delay per annum. The
largest impacts have been during the PM shoulder peak and on Saturdays;
The Weekday PM peak is the only time period when the junction is now
operating more effectively, in terms of journey times and delay;
Conditions on Sundays and overnight are similar to previous, albeit with
slight additional delay; and
A significant dis-benefit on Saturdays with over 9,000 more vehicle hours
observed. These delays are predominantly from the A631 West approach
arm, which has accrued around two thirds of the dis-benefit.
4.28. The PAR only considered the impact of the scheme measures during the AM
and PM peaks and had forecast a vehicle hour saving during these time periods.
The most significant savings were anticipated for the two A631 approach arms.
4.29. The evidence presented shows that the scheme has been unsuccessful with an
overall increase in journey times. This conclusion is drawn from considering all
time periods throughout the week as the implementation of new signals has
affected traffic movements throughout all hours of each day. If the AM and PM
peak hours were to have been evaluated in isolation (in line with the PAR
approach), the evidence shows there would still be a net dis-benefit of over
1,500 vehicle hours as a result of the additional delays in the AM peak.
Summary
The scheme has failed to meet its objective of reducing journey times
through the junction and has resulted in 19,658 vehicle hours of journey
time dis-benefits in the opening year;
Only the M18 north approach is shown to have reduced journey times from
the scheme;
The A631 West approach is shown to have significantly more vehicle hours
of delay than prior to the scheme;
The weekday PM peak is the only time period when the junction is now
operating more effectively, in terms of journey times and delay;
There is a significant dis-benefit on Saturdays with the A631 West approach
most severely impacted; and
The impact on journey time reliability is variable. There are some right
turning movements where improvements are significant such as from M18
North to A631 East in the AM and PM peaks. Conversely, the A631 East to
M18 North and M18 South to A631 East right turning movements have both
got worse across most time periods.
Atkins POPE of LNMS | M18 J1 Traffic Signals | December 2014 | 5107696 335. Safety Impacts
Introduction
5.1. A critical component of any highway scheme is safety. This scheme aimed to
reduce the number of accidents occurring at the junction, particularly those
involving shunts. This section examines the safety impacts associated with the
scheme, and compares the pre and post scheme opening accident rates to
determine whether the scheme has resulted in a post opening safety benefit or
dis-benefit.
Data Source
5.2. The PAR used accidents2 from the five year period 1st January 2006 to 31st
December 2010 as evidence for the pre-scheme conditions at the scheme site.
The PAR stated that there had been 42 accidents during this period and that the
scheme aimed to save 3.14 accidents in the opening year. The area over which
accidents are considered is highlighted in Figure 5.1.
5.3. The PAR covers the evidence used to support the decision to proceed with the
scheme, effectively outlining the business case. However, once a PAR has been
completed and agreed, there can be a time delay before the start of scheme
construction.
5.4. The delay between collecting evidence for a scheme and starting construction
means the accident data used to evidence the situation before the scheme is
often dated. As such, to understand just the impact of the scheme, a five year
pre-construction accident analysis represents a better comparison to the outturn
accident rate, and hence representation of scheme impacts.
5.5. For this scheme, the PAR used accident data up until the end of December
2010. However, scheme construction did not begin until January 2012.
Therefore, there are 12 months between the evidence and the scheme, during
which time the accident rate could have changed.
5.6. As such, to understand just the impact of the scheme, accident data has been
analysed for the same location for a period of five years directly before
construction began (1st January 2007 to 31st December 2011).
2 All references to accidents in this report refer to Personal Injury Collisions (PICs).
The accident data referred to in this report has not necessarily been derived from the national validated
accident statistics produced by Department for Transport (DfT). As such, the data may subsequently be
found to be incomplete or contain inaccuracies. The requirement for up-to date information and site specific
data was a consideration in the decision to use non-validated data and, as it is sourced from Local
Processing Units through the Managing Agent Contractors or Asset Support Contractors, it is sufficiently
robust for use in this context.
Atkins POPE of LNMS | M18 J1 Traffic Signals | December 2014 | 5107696 34You can also read