Recent hydrological response of glaciers in the Canadian Rockies to changing climate and glacier configuration
←
→
Page content transcription
If your browser does not render page correctly, please read the page content below
Hydrol. Earth Syst. Sci., 26, 2605–2616, 2022
https://doi.org/10.5194/hess-26-2605-2022
© Author(s) 2022. This work is distributed under
the Creative Commons Attribution 4.0 License.

Recent hydrological response of glaciers in the Canadian Rockies to
changing climate and glacier configuration
Dhiraj Pradhananga1,2,3 and John W. Pomeroy1
1 Centrefor Hydrology, University of Saskatchewan, 1151 Sidney Street, Canmore, Alberta T1W 3G1, Canada
2 Department of Meteorology, Tri-Chandra Multiple Campus, Tribhuvan University, Kathmandu, Nepal
3 The Small Earth Nepal, P.O. Box 20533, Kathmandu, Nepal

Correspondence: Dhiraj Pradhananga (dhiraj.pradhananga@usask.ca)

Received: 29 June 2021 – Discussion started: 27 July 2021
Revised: 22 March 2022 – Accepted: 9 April 2022 – Published: 18 May 2022

Abstract. Mountain snow and ice greatly influence the hy-        to increasing winter maximum and summer minimum daily
drological cycle of alpine regions by regulating both the        temperatures. Annual precipitation has increased by less than
quantity of and seasonal variations in water availability        11 %, but rainfall ratios have increased by 29 %–44 %. The
downstream. This study considers the combined impacts of         results show that changes in both climate and glacier config-
climate and glacier changes due to recession on the hydrol-      uration have influenced the melt rates and runoff and a shift
ogy and water balance of two high-elevation basins in the        of peak flows in the Peyto Glacier basin from August to July.
Canadian Rockies. A distributed, physically based, uncali-       Glacier melt contributions increased/decreased from 27 %–
brated glacier hydrology model developed in the Cold Re-         61 % to 43 %–59 % of the annual discharges. Recent dis-
gions Hydrological Modelling platform (CRHM) was used            charges were 3 %–19 % higher than in the 1960s and 1970s.
to simulate the glacier mass balance and basin hydrology of      The results suggest that increased exposure of glacier ice
the Peyto and Athabasca glacier basins in Alberta, Canada.       and lower surface elevation due to glacier thinning were less
Bias-corrected reanalysis data were used to drive the model.     influential than climate warming in increasing streamflow.
The model calculates the water balance of glacierized basins,    Streamflow from these glaciers continues to increase.
influenced by the surface energy and mass balance, and con-
siders the redistribution of snow by wind and avalanches. It
was set up using hydrological response units based on ele-
vation bands, surface slope, and aspect, as well as changing     1   Introduction
land cover. Aerial photos, satellite images and digital eleva-
tion models (DEMs) were assimilated to represent the chang-      Mountain streamflow profoundly affects the quantity, qual-
ing configurations of glacier area and the exposure of ice and   ity, and seasonal variation in water in major downstream river
firn. Observations of glacier mass balance, snow, and glacier    systems, particularly in the arid and semiarid regions of west-
ice surface elevation changes at glacier and alpine tundra me-   ern North America (Marks et al., 2008). Glaciers contribute
teorological stations and streamflow discharge at the glacier    significantly to this streamflow during warm and dry periods
outlets were used to evaluate the model performance. Basin       and, in doing so, moderate interannual variability and con-
hydrology was simulated over two periods, 1965–1975 and          tribute to flow water during extreme warm and dry periods
2008–2018, using the observed glacier configurations for         (Comeau et al., 2009; Fountain and Tangborn, 1985; Hop-
those time periods. Both basins have undergone continuous        kinson and Young, 1998). North American mountain glaciers
glacier loss over the last 3 to 5 decades, leading to a 6 %–     began to retreat after the Little Ice Age ended in the early
31 % reduction in glacierized area, a 78 %–109 % increase in     1800s (Barry, 2006; Riedel et al., 2015). In addition to warm-
ice exposure, and changes to the elevation and slope of the      ing after the Little Ice Age, western Canada has experienced
glacier surfaces. Air temperatures are increasing, mainly due    a warming climate in recent decades, with changes in precip-
                                                                 itation regimes and a decline in snow cover (DeBeer et al.,

Published by Copernicus Publications on behalf of the European Geosciences Union.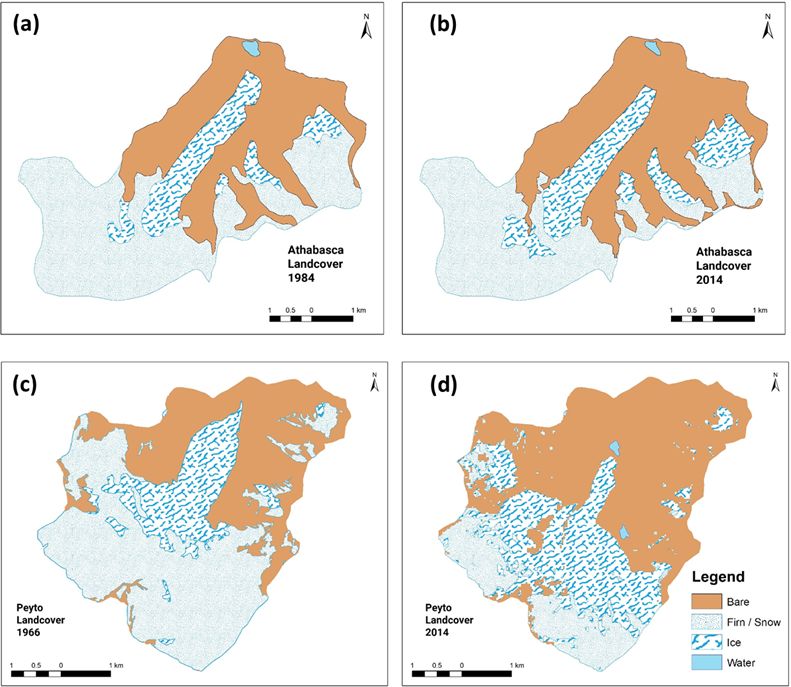
2606 D. Pradhananga and J. W. Pomeroy: Glacial hydrological response to changing climate in the Canadian Rockies

2016). As a result, glaciers in the region are retreating more    Hydrological Model – Glacier) forced by bias-corrected re-
rapidly than in the past (DeBeer et al., 2016; Schiefer et al.,   analysis data.
2007; Tennant et al., 2012), and additional glacier meltwa-
ter is contributing to headwater streamflow discharge and
groundwater recharge (Castellazzi et al., 2019).                  2     Study basins, data, and methods
   Marshall et al. (2011) projected glacier volumes of the
Canadian Rockies (eastern slopes) for the next century. Their     2.1    Study basins
projected values are alarming, as they indicate a further
∼ 85 % loss of glacier volume by 2100 and an order of mag-        In total, two alpine glacier basins in the Canadian Rock-
nitude decrease in glacier contribution to streamflow in Al-      ies, Alberta, Canada (Fig. 1), were chosen for this research,
berta from 1.1 km3 yr−1 at present to 0.1 km3 yr−1 at the end     namely the Peyto Glacier research basin (PGRB; 22.43 km2 )
of this century. Similarly, Clarke et al. (2015) projected a      in Banff National Park and Athabasca Glacier research basin
75 % loss of glacier mass in western Canada by the end of         (AGRB; 29.3 km2 ) in Jasper National Park. The details of
the 21st century compared to 2005.                                these basins are provided by Pradhananga and Pomeroy
   It has been proposed that, as the climate warms, flow orig-    (2022) and Pradhananga et al. (2021). Both glaciers are in-
inating from glaciers will increase for a certain time, due to    strumented with on-ice meteorological stations on the lower
increased melt rates, and then decline as the glacier-covered     ice tongues of the glacier and off-ice meteorological sta-
area decreases (Moore et al., 2009). The duration and tim-        tions on moraine below the tongue, and their outlet streams
ing of this change from increasing to decreasing flow, how-       are gauged at the outlets of their current proglacial lakes.
ever, will be regionally dependent on basin elevation and/or      Both glaciers have been losing mass continuously since the
glacier coverage of the basin (Casassa et al., 2009). Stahl       mid-1970s (Demuth and Keller, 2006; Intsiful and Ambi-
and Moore (2006) observed that late summer streamflow             nakudige, 2021; Kehrl et al., 2014; Reynolds and Young,
from many British Columbia glacierized mountain basins            1997; Tennant and Menounos, 2013). Clarke et al. (2015)
has been declining, which suggests that most source glaciers      projected that AGRB will lose half of its glacier coverage by
have already completed the phase of increased flow due to         2050. Kehrl et al. (2014) estimated that Peyto Glacier may
rising temperatures and increasing melt rates and now con-        lose about 85 % of its present-day mass by 2100.
tribute less streamflow as their areas decline. Chernos et al.
(2020) projected a rise in glacier discharge in the Athabasca     2.2    Meteorological forcing datasets
River basin in Alberta until the mid-21st century and then re-
duced discharge. Similarly, Neupane et al. (2018) modelled        Bias-corrected ERA-40 (Uppala et al., 2005) and ERA-
the upper Athabasca River basin and assessed the effects of       Interim reanalysis data (Dee et al., 2011), representing sur-
changes in temperature and precipitation on simulated fu-         face levels for air temperature, vapour pressure, wind speed,
ture discharge for the 2080–2099 period. They projected a         precipitation, and incoming short- and longwave radiation
reduction in water availability in the basin during the sum-      were used to force the CRHM-glacier model. The ERA-40
mer months.                                                       was available for the period of 1957–2002 and ERA-Interim
   Glacier mass loss is associated with a reduction in the        for the period of 1979–2019, with an overlapping period of
glacier-covered area, an increase in ice exposure compared        1979–2002. These ERA global reanalyses were first bias cor-
to that of snow and firn, and changes to the elevation and        rected to in situ observational datasets from meteorological
slope of the glacier surface. However, it is yet to be fully      stations near to the glaciers (Athabasca Moraine Station for
understood how the changes in glacier configuration and cli-      AGRB and Peyto Main Station for PGRB; Fig. 1). A monthly
mate impact the streamflow jointly and individually. The in-      quantile mapping approach (Gudmundsson et al., 2012) with
tegrated impacts of climate change on mountain streamflow         monthly bias correction factors were used for the bias cor-
are complex, and sometimes changes in hydrological pro-           rection of ERA-40 and ERA-Interim.
cesses can have compensating effects on streamflow gener-            For PGRB, ERA-Interim data (2008–2018) were bias cor-
ation under a changing climate, e.g., a reduction in one con-     rected to Peyto Main Station observations from 2013–2018,
tribution is compensated for by an increase in another contri-    and ERA-40 data (1965–1975) were bias corrected to the
bution (Fang and Pomeroy, 2020; Harder et al., 2015). There-      archived observations from the station for the common over-
fore, the impacts from climate change and glacier change on       lap period of 1992–2001, as described by Pradhananga et al.
hydrology need to be diagnosed both separately and together.      (2021). For AGRB, ERA-Interim data were bias corrected to
This study investigates the individual and combined impacts       2014–2018 observations at the Athabasca Moraine Station.
of changing climate and receding glaciers on the headwater        There were not any in situ meteorological observations avail-
hydrology of two well-instrumented glacierized basins on the      able at AGRB prior to 2014. Therefore, the biases in ERA-40
eastern slopes of the Canadian Rockies, using a cold regions      for AGRB were identified by comparing the overlapping pe-
glacier hydrological model, CRHM-glacier (Cold Regions            riod of ERA-40 and bias-corrected ERA-Interim, similar to
                                                                  the procedure outlined by Krogh and Pomeroy (2018).

Hydrol. Earth Syst. Sci., 26, 2605–2616, 2022                                      https://doi.org/10.5194/hess-26-2605-2022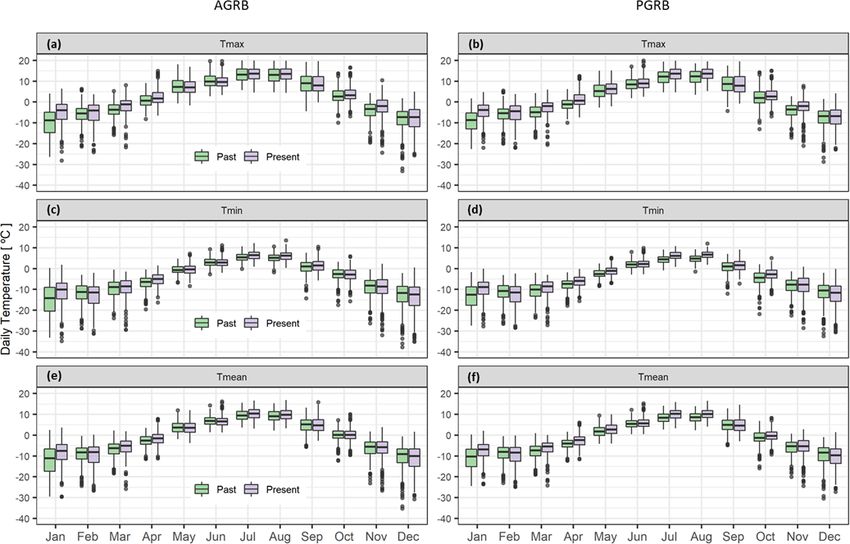
D. Pradhananga and J. W. Pomeroy: Glacial hydrological response to changing climate in the Canadian Rockies 2607
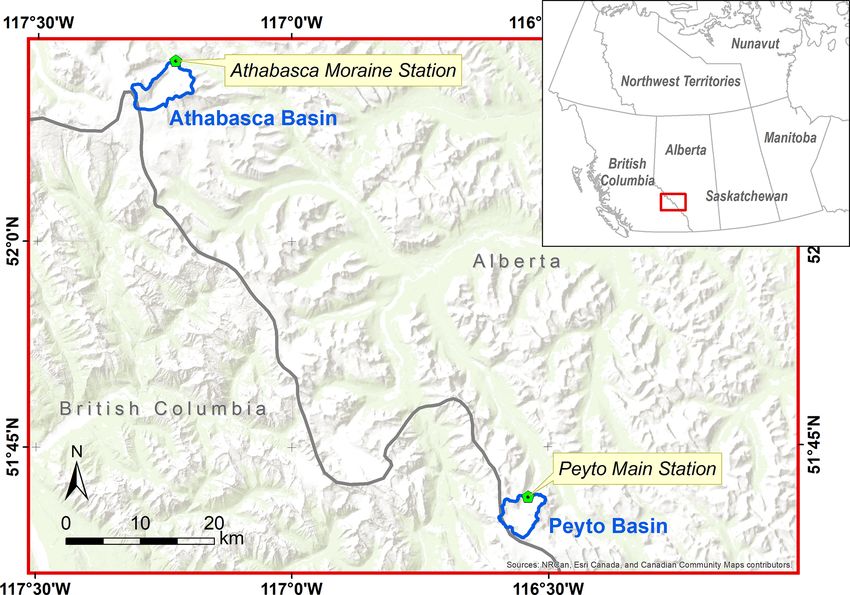
Figure 1. Location map of Peyto and Athabasca glacier research basins. The gray line is the border between two provinces, blue polygons
are basin boundaries, and green pentagons are meteorological stations.
2.3 CRHM-glacier model cludes the calculation of actual evapotranspiration, using the
Penman–Monteith method and soil moisture and groundwa-
The CRHM-glacier model (Pradhananga and Pomeroy, ter dynamics, based on infiltration to frozen and unfrozen
2022), developed in the Cold Regions Hydrological Mod- soils, and the use of saturated and unsaturated hydraulic con-
elling platform (Pomeroy et al., 2007), was applied in this ductivities to calculate flow velocities in porous media. The
study to evaluate the impacts of changes in climate and in model parameters are not calibrated from its fit to streamflow.
glacier configuration on the hydrology of glacierized basins. Parameters are selected primarily from local and regional ob-
CRHM-glacier is a physically based, flexible, multi-physics servations (e.g., temperature and precipitation lapse rates),
hydrological model (Pradhananga and Pomeroy, 2022). It and its operation has been verified against observed albedo,
downscales and distributes meteorological variables (short- mass balance, melt rate, and streamflow at PGRB and AGRB
wave and longwave radiation, air temperature, relative hu- (Pradhananga and Pomeroy, 2022).
midity, wind speed, precipitation, and its phase) to differing
slopes, aspects, elevations, and groundcover defined by hy- 2.4 Modelling scenarios
drological response units (HRUs), using in-built algorithms
and macros (Ellis et al., 2010; Harder and Pomeroy, 2013). CRHM-glacier was run to simulate the hydrological re-
The HRUs used to discretize these basins are presented in sponses of the two glacier research basins to four experimen-
Pradhananga and Pomeroy (2022). CRHM-glacier simulates tal scenarios. Observed glacier configurations, with “past”
the hydrology of both glacier and non-glacier areas in a corresponding to 1966 (PGRB) and 1983–1984 (AGRB) and
basin. It redistributes snow by coupling the blowing snow “present” to 2014 (PGRB) and 2011–2014 (AGRB), were
transport and sublimation processes with snow avalanching. set as initial conditions for two modelling scenarios in each
The implementation used here does not calculate ice flow. basin. Initializing the model with observed glacier configu-
Melt energies for snow and ice melt are calculated sepa- rations, and restricting simulation periods to 1 decade, com-
rately, based on Snobal and energy budget glacier melt mod- pensated for the lack of ice flow dynamics in the model sce-
ules, respectively, to calculate snow, firn, and ice mass bal- narios.
ances (Pradhananga and Pomeroy, 2022). Meltwater routing Glacier configuration maps for the two periods were pre-
is through three glacier reservoirs (snow, firn, and ice), modi- pared from available digital elevation model (DEM) and
fied to the de Woul et al. (2006) approach. Once water leaves land cover information. These maps were used to delineate
the glacier, rain and meltwater are routed further into the soil the configuration, namely the accumulation (snow- or firn-
surface, subsurface, and groundwater using well-developed covered) and ablation (ice-exposed) areas and to determine
alpine routing routines (Fang et al., 2013). The model in- ice elevations, slopes, and aspects. The glacier area was taken
https://doi.org/10.5194/hess-26-2605-2022 Hydrol. Earth Syst. Sci., 26, 2605–2616, 2022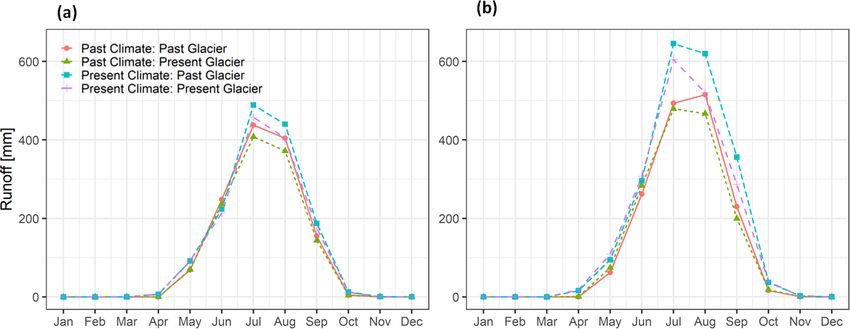
2608 D. Pradhananga and J. W. Pomeroy: Glacial hydrological response to changing climate in the Canadian Rockies

as the sum of the snow-, firn-, and ice-exposed areas. The ac-    outputs was examined to diagnose the hydrological response
cumulation area ratio (AAR) of the glaciers was calculated as     to both glacier change and climate change.
the ratio of snow-/firn-covered area to the total glacier area.      Statistical tests, the Student’s t test and the Wilcoxon
   A topographic map of Peyto Glacier from 1966 (Sedg-            signed-rank test (Wilcoxon, 1945) in the R environment
wick and Henoch, 1975) was used to prepare the past glacier       (R Core Team, 2017), were applied to test the significance
configuration scenario. Both the 1966 DEM (10 m resolu-           of the changes between the results obtained from the model
tion) and the 1966 land cover map were developed from             scenarios. These tests were used to assess whether one popu-
this topographic map, which was produced from aerial pho-         lation of model output metrics is statistically distinguishable
tographs taken in August 1966. The 2014 DEM was prepared          from the other. All tests were conducted at the 5 % level of
at 10 m resolution from aerial photographs taken during July      significance.
and September 2014 by Parks Canada over Banff National
Park and made available for this study. The land cover map
for the present basin was prepared based upon the Landsat         3     Results
image taken on 18 August 2014. Bolch et al. (2010) found
only 1.7 % deviation between aerial photograph and satellite      3.1    Change in climate
imagery approaches for delineating glacier area and snow/-
firn/ice coverage. For AGRB, DEM, and land cover map              Air temperature and precipitation over PGRB and AGRB
were not available from the 1960s. Therefore, DEM at 20 m         were analysed for the 2 decades – 1965–1975 (past)
horizontal resolution from 1983 (Canadian Digital Elevation       and 2008–2018 (present). Daily mean (Tmean), maximum
Model – CDEM) and the satellite image taken on 28 July            (Tmax), and minimum (Tmin) temperature (Fig. 2 and Ta-
1984 (Landsat 5) was used to prepare the past glacier con-        bles S2–S4) and monthly precipitation (Fig. 3 and Table S1),
figuration. The 2011 DEM (20 m resolution from the Japan          averaged and aggregated over the two climatic periods, were
Aerospace Exploration Agency – JAXA) and the 2014 satel-          compared using C1.
lite image (Landsat 8) taken on 18 August were used to pre-          Annual and seasonal average temperatures generally in-
pare the present glacier configuration.                           creased in the present decade compared to the past, ex-
   The models were then run for two climate periods, namely       cept for the summer maximum at AGRB. Annual Tmax in-
past (1965–1975) and present (2008–2018). A novel ap-             creased by 1 ◦ C at AGRB and by 1.5 ◦ C at PGRB. Analysis
proach was used in that past and present climate forced           of the monthly time periods also shows that air temperatures
both past and present glacier configurations to diagnose how      have increased at both glaciers. The greatest increases in the
past glaciers would respond to the present-day climate and        monthly Tmax were in January, when they rose by 5.1 ◦ C
present-day glaciers to the past climate. Therefore, there was    at AGRB and 4.8 ◦ C at PGRB. Monthly Tmin at AGRB in-
a combination of four model simulation scenarios, A–D,            creased by 3.6 ◦ C in January and by 1 ◦ C in July, and that at
using 2 separate decades of climate forcing from past and         PGRB increased by 3.5 ◦ C in January and 1.9 ◦ C in July. An-
present periods, with past and present glacier configurations     nual Tmean at AGRB increased by 0.5 ◦ C, and that at PGRB
as follows:                                                       increased by 1 ◦ C. Temperature differences over time that
                                                                  were found to be significantly different from zero are more
 A. Past climate – past glacier
                                                                  consistently evident at PGRB than at AGRB.
 B. Past climate – present glacier                                   Annual precipitation increased slightly in the present
                                                                  decade compared to the past (Fig. 3 and Table S1), with
 C. Present climate – past glacier                                15.2 mm (2.5 %) at AGRB and 71.7 mm (10.3 %) at PGRB.
                                                                  But these differences are not statistically significant. Winter
 D. Present climate – present glacier.
                                                                  (December–February) precipitation decreased at both basins,
   Based on these four experimental scenarios (A–D), five         by 49.5 mm at AGRB and by 35.2 mm at PGRB. But pre-
comparisons (C1–C5; Table 1) were employed to diagnose            cipitation in the other seasons (spring, summer, and fall) in-
the impacts of climate and glacier changes on streamflow.         creased by 13.1, 38.5, and 13.1 mm, respectively, at AGRB
C1 represents realistic conditions of both climate and glacier    and by 29.7, 50.2, and 27.0 mm, respectively, at PGRB. The
configuration; it compares A and D, i.e., past climate – past     increases in summer precipitation at both basins, and the de-
glacier with present climate – present glacier. The other         crease in winter precipitation at AGRB, were statistically sig-
comparisons are falsified modelling experiments to segregate      nificant (Table S1).
the impacts of changing climate and glacier configurations.          There was a statistically significant increase in the rain-
C2 and C5 consider only changes in the glacier configuration,     fall ratio (rainfall divided by total precipitation), for D com-
while keeping the climate fixed in either the past or present.    pared A (C1) in both research basins (Fig. 4), from 0.161
C3 and C4 compare the impacts from changing the climate,          to 0.232 (44 %) at AGRB and from 0.220 to 0.283 (29 %)
while keeping the glacier configuration constant as either the    at PGRB (Table S5). The average annual rainfall ratios in-
past or present glacier. Simulated runoff from these model        creased with reductions in glacier area and surface eleva-

Hydrol. Earth Syst. Sci., 26, 2605–2616, 2022                                      https://doi.org/10.5194/hess-26-2605-2022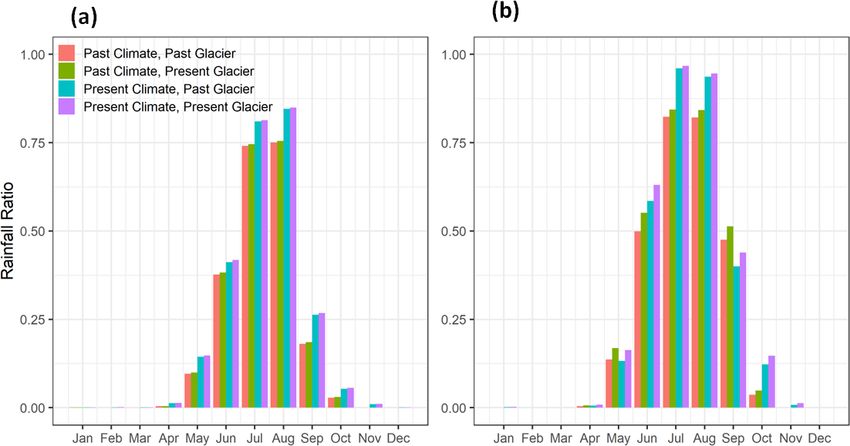
D. Pradhananga and J. W. Pomeroy: Glacial hydrological response to changing climate in the Canadian Rockies 2609

Table 1. Comparison of model outputs.

                   Comparison no.    Comparison of model scenarios
                   C1                Past climate – past glacier (A) vs. present climate – present glacier (D)
                   C2                Past climate – past glacier (A) vs. past climate – present glacier (B)
                   C3                Past climate – past glacier (A) vs. present climate – past glacier (C)
                   C4                Past climate – present glacier (B) vs. present climate – present glacier (D)
                   C5                Present climate – past glacier (C) vs. present climate – present glacier (D)

Figure 2. Monthly means of daily maximum (a, b), minimum (c, d), and mean (e, f) temperature comparison between two periods, i.e., past
(1965–1975) and present (2008–2018). (a, c, e) AGRB. (b, d, f) PGRB.

tion; at AGRB there was an increase from 0.161 to 0.163                3.2   Change in glacier configuration
for the past climate (C2) and from 0.163 to 0.232 for the
present climate (C5) and at PGRB from 0.220 to 0.283                   Figure 5 compares the configuration of both glaciers between
for the past climate (C2) and from 0.268 to 0.283 for the              the two periods and shows changes in the accumulation and
present climate (C5). However, the increase in rainfall ra-            ablation areas. During the period 1966–2014, the area of
tios was mainly due to changes in climate (temperature in-             Peyto Glacier shrank from 14.4 to 9.9 km2 (31 %) and its
creases) over time. The average annual rainfall ratio for the          AAR dropped from 0.75 to 0.35, exposing more ice in 2014,
past glacier configuration (C3) increased from 0.161 to 0.229          which is more than double the area exposed in 1966. The ex-
at AGRB (statistically significant) and from 0.220 to 0.268            posed ice area increased from 3.6 to 6.4 km2 (78 %), whereas
at PGRB, and for the present glacier configuration (C4), the           the snow/firn area decreased from 10.8 to 3.5 km2 . Though
ratio increased from 0.163 to 0.232 at AGRB (statistically             to a lesser degree than Peyto Glacier, the area of Athabasca
significant) and from 0.234 to 0.283 at PGRB.                          Glacier also decreased from 18 to 16.9 km2 (6 %), and its
                                                                       AAR decreased from 0.76 to 0.47. The exposed ice area of
                                                                       Athabasca increased from 4.3 to 9.0 km2 (109 %), and the
                                                                       snow/firn area decreased from 13.6 to 7.9 km2 . The firn line

https://doi.org/10.5194/hess-26-2605-2022                                            Hydrol. Earth Syst. Sci., 26, 2605–2616, 2022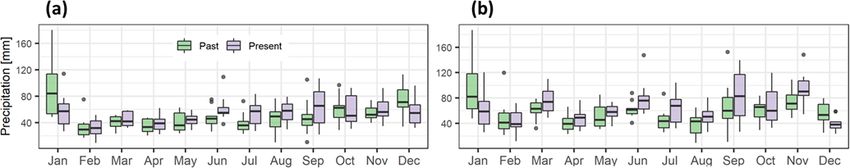
2610 D. Pradhananga and J. W. Pomeroy: Glacial hydrological response to changing climate in the Canadian Rockies

Figure 3. Monthly mean precipitation averaged over the two periods, i.e., past (1965–1975) and present (2008–2018). (a) AGRB. (b) PGRB.

Figure 4. Mean monthly rainfall ratios simulated for the four model run scenarios, with A–D combining the past and present climate and
glacier. (a) AGRB. (b) PGRB.

moved to a higher elevation in both glaciers, and glacier sur-        1975) to 324 mm (2008–2018), resulting in negative mean
faces have become steeper from the past to present period;            annual mass balances, from −271 mm in the past climate to
the slope of the glacier increased from 14.2 to 16.8 in AGRB          −733 mm in the present climate (Table S7). These changes
and that increased in PGRB from 19.9 to 22.0. The other               are more due to the change in climate than the change
change in the two glacier configurations was in elevation; the        in glacier configuration. Summer ablation increased signif-
mean glacier surface elevation for Peyto Glacier decreased            icantly from past to present climate for both past and present
from 2628 to 2615 m, while that of Athabasca Glacier in-              glacier configurations (C3 and C4). The changes are not sta-
creased from 2799 to 2826 m.                                          tistically significant in the model runs for C2 and C5. How-
                                                                      ever, the past glacier configurations resulted in greater winter
3.3   Change in glacier mass balance                                  snow accumulations in both basins for both past and present
                                                                      climates.
Seasonal and annual mass balance for AGRB and PGRB
from the four model scenarios, A–D, are presented in Fig. 6.          3.4   Change in runoff and runoff generation processes
The results from the statistical analysis are presented in Ta-
ble S7. Except for the change in winter mass balance be-              Figure 7 shows runoff and volumetric melt components of
tween A and D (C1), the mass balance changes are not statis-          runoff from AGRB and PGRB for A and D scenarios (C1).
tically significant at AGRB. There were significant changes           Snowmelt runoff dominated both of the basins in compar-
in winter and annual mass balances between past and present           ison to the rainfall runoff, ice melt runoff, and firn melt
climates and glaciers at PGRB (C1). Mean annual winter ac-            runoff. The present climate and present glacier configura-
cumulation decreased from an average of 586 mm (1965–                 tions (D) produced more runoff than the past climate and past

Hydrol. Earth Syst. Sci., 26, 2605–2616, 2022                                          https://doi.org/10.5194/hess-26-2605-2022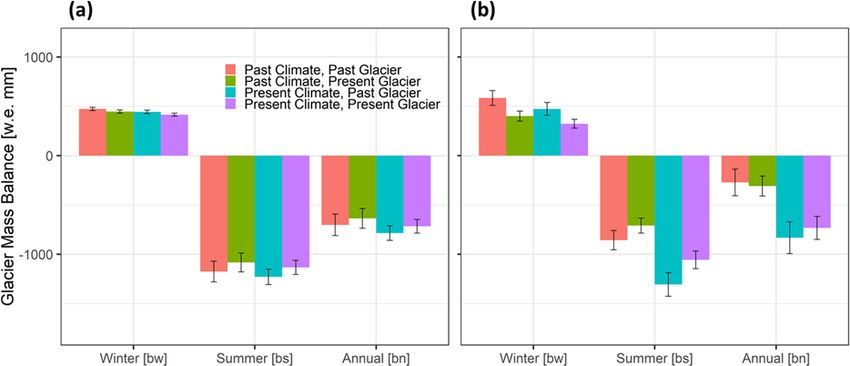
D. Pradhananga and J. W. Pomeroy: Glacial hydrological response to changing climate in the Canadian Rockies 2611

Figure 5. Change in land cover between the glaciers in the past and present. Panels (a) and (b) are AGRB in 1984 and 2014, respectively.
Panels (c) and (d) are PGRB in 1966 and 2014, respectively.

Figure 6. Glacier mass balance during winter, summer, and annual periods from the four model scenarios, A–D, combining past and present
climate and glacier. Error bars show the annual variability, defined as the standard error between years. (a) AGRB. (b) PGRB.

https://doi.org/10.5194/hess-26-2605-2022                                           Hydrol. Earth Syst. Sci., 26, 2605–2616, 2022
2612 D. Pradhananga and J. W. Pomeroy: Glacial hydrological response to changing climate in the Canadian Rockies
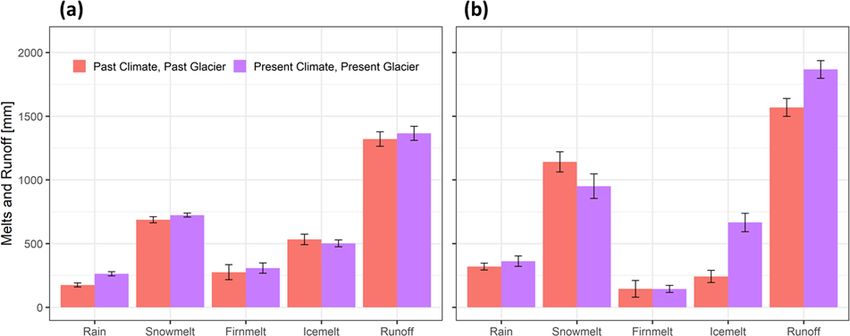
Figure 7. Mean annual melt, rainfall–runoff, and basin runoff for the past and present glacier configuration and climate scenarios. Error bars
show the annual variability, which is defined as the standard error between years. (a) AGRB. (b) PGRB.
glacier configurations (A). There was a 19 % significant in- Monthly averaged runoff from the four model scenarios
crease (p = 0.005) in the mean annual runoff, from 1581 to is presented in Fig. 8. The glaciers in AGRB and PGRB
1888 mm at PGRB (Table S5). This was mainly due to an in- produced more runoff in the recent period (D) than in the
creased contribution from ice melt, which was from 265 to past (A). Both past and present glaciers produced more
667 mm. There was a decrease in the mean annual snowmelt runoff in the present than in the past climate. However, the
and firn melt, but the changes in these and the other fluxes past glaciers generated more streamflow compared to the
were not statistically significant. For AGRB, the 3 % increase present glaciers with both present and past climates. As the
in runoff from 1320 to 1365 mm was not statistically signif- climate shifted, there was a shift in the peak from August in
icant (p = 0.578; Table S5), though there was a significant the past (A) to July in the present (D) at PGRB.
increase in rainfall from 175 to 262 mm. Monthly statistical Significant changes in runoff, firn melt, and snowmelt oc-
values are shown in Table S6. AGRB experienced increased curred for PGRB, suggesting that the increase in runoff over
snowmelt and firn melt but decreased ice melt. time (C3 and C4) was due to an increase in firn melt and ice
Snowmelt-dominated basin runoff provided 52 %–70 % melt (Table S5). The large loss of firn coverage from past
and 52 %–53 % of all runoff for PGRB and AGRB, re- to present at PGRB resulted in a decrease of firn melt by
spectively. At PGRB, rainfall–runoff provided 19 %–20 % of 65 % (from 414 to 146 mm), when the past glacier configu-
basin runoff, which exceeded ice melt and firn melt contri- ration was replaced by the present one, with the climate for
butions, except for ice melt in the current climate and glacier both glacier configurations held constant at the present cli-
configuration. The sum of firn melt and ice melt contribu- mate (C5). In the case of AGRB, only increases in rainfall in
tions at PGRB increased from 27 % in the past to 43 % in the the C3 and C4 and in snowmelt in C4 were significant. More
present (C1). At AGRB, rainfall–runoff provided 13 %–19 % rainfall occurred with both past and present glacier configu-
of basin runoff and was smaller than either firn melt or ice rations.
melt contributions. Firn melt was smaller than both snowmelt
and ice melt. The sum of firn melt and ice melt contributions
at AGRB decreased slightly from 61 % in the past to 59 % 4 Discussion
in the present. Basin runoff increased by 19 % at PGRB but
The glaciohydrological model, CRHM, was used to simulate
only by 3 % at AGRB from the past to present climate for the
the headwater hydrology of two glacierized mountain basins
present glacier configuration (C1). This increase was due to
with four scenarios by combining the climate and glacier
increases in rainfall (statistically significant), snowmelt, and
configurations of two periods, mid-20th century and early
firn melt at AGRB, whereas it was due to an increase in rain-
21st century. These scenarios were used to diagnose the hy-
fall and a remarkable 152 % increase in ice melt (statistically
drological responses to changes in glacier and climate, indi-
significant) at PGRB (Table S5). Snowmelt declined 12 % at
vidually and jointly presenting how glaciers in the past would
PGRB. Basin runoff increased due to the warming climate
respond to present-day climate and glaciers today to past cli-
for both past and present glaciers (C3 and C4), whereas it
mate.
decreased with decreasing glacier configurations for both the
past and present climates (C2 and C5).
Hydrol. Earth Syst. Sci., 26, 2605–2616, 2022 https://doi.org/10.5194/hess-26-2605-2022D. Pradhananga and J. W. Pomeroy: Glacial hydrological response to changing climate in the Canadian Rockies 2613 Figure 8. Monthly averaged runoff simulated using the past and present glacier and climate scenarios. (a) AGRB. (b) PGRB. Changes in glacier configurations included changes in with the future prediction by Kienzle et al. (2012), for the glacier extent, glacier surface elevation and slope, and Cline River watershed, that spring runoff and peak stream- change in AAR, which also changed the albedo feedback of flow would shift 18–26 d advance in the 21st century (2020– glacier surfaces. Compared to the past, present glacier areas 2080) compared to the baseline period (1961–1989). have declined, elevations have decreased/increased, surface In general, there was increased runoff in the present com- slopes have become steeper, and AARs have become smaller, pared with the past for both basins, particularly from PGRB. exposing more ice, and thus reduced the glacier albedos. This shows that these glaciers in Alberta, in the cold, high- Air temperatures increased from past to present; the elevation headwaters on the northeastern slopes of the Cana- changes were more often significant at PGRB than at AGRB. dian Rockies, are still in the initial phase of warming-induced Though there was not much change in the total precipitation, increased runoff, in contrast to most glaciers in British rainfall ratios increased in the present compared to past due Columbia, including the more temperate southwestern slopes to changes in both climate and glacier configuration, and this of the Canadian Rockies (Stahl and Moore, 2006) and west- caused reduced snowfall at both basins. The differences for ern Canada in general (DeBeer et al., 2016). However, this is the same climate were due to the change in glacier configura- similar to the results of Chernos et al. (2020), who projected tions; for instance, the present glacier configurations feature glacier contributions to streamflow to increase till the mid- a smaller glacier surface at a lower surface height than past dle of the 21st century (2040) and to decrease thereafter for configurations do. Both factors contribute to increased rain- the Athabasca River. Moore et al. (2009) also noted increas- fall ratios. Increases in the rainfall ratio in these basins are ing trends of runoff in glacierized basins in relatively colder consistent with other studies, for example, in western Canada northwest British Columbia and southwest Yukon. Casassa by DeBeer et al. (2016) and in Europe by Hynčica and Huth et al. (2009) generalized that high-elevation basins and/or (2019). In the case of glacier mass balance, the present cli- basins with high glacierization were experiencing increasing mate and present glacier were responsible for making the runoff trends around the world. winter mass balance less positive. Compared to the present The novel model falsification approach of using the past glacier configuration, the past glacier gained more mass dur- glacier configuration with present climate and the present ing winter. glacier configuration with past climate provided a means There was a reduction in peak monthly flows from both to separate the combined and individual impacts of climate basins as the glacier area declined over time with the climate change and glacier recession on the headwater hydrology held constant (Fig. 8). However, with the climate changing and water balance of glacierized basins. With fixed glacier and the glacier configuration held constant, peak monthly configurations (C3 and C4), the impact of climate on glacier flows increased over time. The combination of moving from hydrology could be analysed, and using the same climate the past to present climate and changing glacier configuration to force past and present glacier configuration models (C2 shifted peak monthly flows forward by a month at PGRB, and C5) provided an explicit separation of the impacts of but the impact of changing climate was greater than that of changes in glacier configuration on glacier hydrology. the changing glacier configuration on this shift. The shift in The warmer temperatures and increased rainfall ratio in PGRB’s peak monthly flow from August to July is consistent the present climate led to increased glacier runoff from both https://doi.org/10.5194/hess-26-2605-2022 Hydrol. Earth Syst. Sci., 26, 2605–2616, 2022
2614 D. Pradhananga and J. W. Pomeroy: Glacial hydrological response to changing climate in the Canadian Rockies

basins. However, the reduced glacier extent in the present        glacierized basin in the context of climate change and vari-
glacier configuration resulted in decreased runoff from both      ability. The results suggest that the increased exposure of
basins, counteracting the direct impacts of climate change on     glacier ice and lower surface elevation due to glacier thin-
the basins. In summary, the outputs show that changes in both     ning was less influential than climate warming in increasing
climate and basin configurations were causing changes in the      streamflow.
melt rate and runoff. Compared to the past climate and past
glacier configuration, the present climate and present glacier
configuration provided more runoff in both basins, although       Code availability. CRHM is available at https://research-groups.
there were significant losses of glacier area over the last 5     usask.ca/hydrology/modelling/crhm.php#TechnicalDetails (Centre
decades.                                                          for Hydrology, 2022).

                                                                  Data availability. The dataset for PGRB is publicly
5   Conclusions
                                                                  available from Federated Research Data Repository at
                                                                  https://doi.org/10.20383/101.0259 (Pradhananga et al., 2020).
This study investigated the influence of snow and glaciers on
headwater hydrology in two mountain basins in the Cana-
dian Rockies, where a warming climate and glacier retreat
                                                                  Supplement. The supplement related to this article is available on-
continue to cause concern about changes in high mountain          line at: https://doi.org/10.5194/hess-26-2605-2022-supplement.
hydrology.
   There was an increase in air temperature, mainly in daily
maximum and winter minimum temperatures. Total precip-            Author contributions. DP and JWP conceptualized the research.
itation has not increased, but the rainfall ratio has increased   DP did the analysis and prepared the draft. JWP instrumented the re-
with the shift in climate. Both present climate and present       search basins, guided the research methods, and edited and revised
glacier caused an increase in rainfall ratio compared to past     the paper.
climate and past glacier. Decreases in winter precipitation
were balanced by increased precipitation in the other sea-
sons, some of which fell as rainfall. Both mass balance stud-     Competing interests. The contact author has declared that neither
ies and analysis of satellite imagery show that the glaciers      they nor their co-author has any competing interests.
are losing mass and area, and that the exposure of ice at the
glacier surfaces has increased. The fractional glacier retreat
is lower at AGRB (6 %) than at PGRB (31 %), whereas the           Disclaimer. Any reference to specific products is for informational
fractional change in the exposure of ice is higher at AGRB        purposes and does not represent a product endorsement.
(109 %) than at PGRB (78 %). The retreat of the glaciers has
                                                                  Publisher’s note: Copernicus Publications remains neutral with
led to reductions in glacierized areas and changes in eleva-
                                                                  regard to jurisdictional claims in published maps and institutional
tion and slope of the glacier surfaces.                           affiliations.
   The study used a novel approach to apply present climate
forcings to drive hydrological modelling, using past glacier
configurations, and past climate forcings to drive modelling,     Acknowledgements. The authors wish to acknowledge the decades
using present glacier configuration, so that the impacts of       of extremely challenging field research at Peyto and Athabasca
changes in glacier configuration and climate on glacier hy-       glacier basins by dozens of scientists and students over the decades.
drology could be explicitly separated. The modelling results      Meriting special mention are D. Scott Munro, of the University of
presented here show that glacier retreat and ablation are due     Toronto, and Michael N. Demuth, of Natural Resources Canada,
to the joint effect of warming climate and an increase in ice     whose legacy of research on Peyto Glacier, including meteorologi-
exposure, which increased both seasonal melt and runoff.          cal and mass balance observations, made this study possible. Spe-
The sum of firn melt and ice melt contributions to annual         cial mention also goes to the prescient scientists of the Interna-
                                                                  tional Hydrological Decade, who established Peyto Glacier as a re-
discharges increased from the past climate and glacier to
                                                                  search site, including Gordon Young of Environment Canada and
the present climate and glacier at PGRB from 27 % to 43 %         Wilfrid Laurier University. Additional data were provided by Envi-
and decreased slightly at AGRB from 61 % to 59 %. In-             ronment and Climate Change Canada’s Meteorological Service of
creased streamflow discharges (3 %–19 %) were due to cli-         Canada and Water Survey of Canada, Parks Canada, and Alberta
mate warming and were somewhat limited by glacier retreat         Environment and Parks. Tom Brown and Xing Fang of the Cen-
and areal decreases. The model results indicated that stream-     tre for Hydrology supported CRHM development and operation/-
flow from the glaciers increased in the present climate (2008–    parameterization, respectively. Nammy Hang Kirat of The Small
2018) from the past climate (1965–1975), despite reductions       Earth Nepal supported satellite image interpretation and GIS maps.
in glacier area and volume. Such a modelling approach is          Special thanks go to the reviewers (anonymous reviewer no. 1 and
important for diagnosing the hydrological responses from a        Eleanor Bash), for their careful and critical review of the paper

Hydrol. Earth Syst. Sci., 26, 2605–2616, 2022                                       https://doi.org/10.5194/hess-26-2605-2022
D. Pradhananga and J. W. Pomeroy: Glacial hydrological response to changing climate in the Canadian Rockies 2615
and their several insightful comments and constructive suggestions, A. J., Haimberger, L., Healy, S. B., Hersbach, H., Hólm, E. V.,
which helped to improve the paper. Isaksen, L., Kållberg, P., Köhler, M., Matricardi, M., Mcnally, A.
P., Monge-Sanz, B. M., Morcrette, J. J., Park, B. K., Peubey, C.,
de Rosnay, P., Tavolato, C., Thépaut, J. N., and Vitart, F.: The
Financial support. Funding for this study has been provided by the ERA-Interim reanalysis: Configuration and performance of the
Canada Research Chairs, the Canada Foundation for Innovation, data assimilation system, Q. J. Roy. Meteorol. Soc., 137, 553–
the Natural Sciences and Engineering Research Council of Canada 597, https://doi.org/10.1002/qj.828, 2011.
through its Discovery Grants, and the Changing Cold Regions Net- Demuth, M. N. and Keller, R.: An assessment of the mass bal-
work and the Canada First Research Excellence Fund’s Global Wa- ance of Peyto glacier (1966-1995) and its relation to Recent and
ter Futures Programme. past-century climatic variability, in: Peyto Glacier: One Cen-
tury of Science, edited by: Demuth, M. N., Munro, D. S., and
Young, G. J., National Hydrology Research Institute, Saskatoon,
Review statement. This paper was edited by Carlo De Michele and Saskatchewan, pp. 83–132, 2006.
reviewed by Eleanor Bash and one anonymous referee. de Woul, M., Hock, R., Braun, M., Thorsteinsson, T., Jóhannesson,
T., and Halldórsdóttir, S.: Firn layer impact on glacial runoff: a
case study at Hofsjökull, Iceland, Hydrol. Process., 20, 2171–
2185, https://doi.org/10.1002/hyp.6201, 2006.
References Ellis, C. R., Pomeroy, J. W., Brown, T., and MacDonald, J.:
Simulation of snow accumulation and melt in needleleaf
Barry, R. G.: The status of research on glaciers and global forest environments, Hydrol. Earth Syst. Sci., 14, 925–940,
glacier recession: a review, Prog. Phys. Geog., 30, 285–306, https://doi.org/10.5194/hess-14-925-2010, 2010.
https://doi.org/10.1191/0309133306pp478ra, 2006. Fang, X. and Pomeroy, J. W.: Diagnosis of future changes in hy-
Bolch, T., Menounos, B., and Wheate, R.: Landsat-based inventory drology for a Canadian Rockies headwater basin, Hydrol. Earth
of glaciers in western Canada, 1985–2005, Remote Sens. En- Syst. Sci., 24, 2731–2754, https://doi.org/10.5194/hess-24-2731-
viron., 114, 127–137, https://doi.org/10.1016/j.rse.2009.08.015, 2020, 2020.
2010. Fang, X., Pomeroy, J. W., Ellis, C. R., MacDonald, M. K., De-
Casassa, G., López, P., Pouyaud, B., and Escobar, F.: Detection of Beer, C. M., and Brown, T.: Multi-variable evaluation of hy-
changes in glacial run-off in alpine basins: Examples from North drological model predictions for a headwater basin in the Cana-
America, the Alps, central Asia and the Andes, Hydrol. Process., dian Rocky Mountains, Hydrol. Earth Syst. Sci., 17, 1635–1659,
41, 31–41, https://doi.org/10.1002/hyp.7194, 2009. https://doi.org/10.5194/hess-17-1635-2013, 2013.
Castellazzi, P., Burgess, D., Rivera, A., Huang, J., Longuev- Fountain, A. G. and Tangborn, W. V.: The effect of glaciers
ergne, L., and Demuth, M. N.: Glacial Melt and Po- on streamflow variations, Water Resour. Res., 21, 579–586,
tential Impacts on Water Resources in the Canadian https://doi.org/10.1029/WR021i004p00579, 1985.
Rocky Mountains, Water Resour. Res., 55, 10191–10217, Gudmundsson, L., Bremnes, J. B., Haugen, J. E., and Engen-
https://doi.org/10.1029/2018WR024295, 2019. Skaugen, T.: Technical Note: Downscaling RCM precipitation
Centre for Hydrology: CRHM: The Cold Regions Hydrological to the station scale using statistical transformations – a com-
Mode, Centre for Hydrology [code], https://research-groups. parison of methods, Hydrol. Earth Syst. Sci., 16, 3383–3390,
usask.ca/hydrology/modelling/crhm.php#TechnicalDetails, last https://doi.org/10.5194/hess-16-3383-2012, 2012.
access: 9 May 2022. Harder, P. and Pomeroy, J. W.: Estimating precipitation phase using
Chernos, M., MacDonald, R. J., Nemeth, M. W., and Craig, J. a psychrometric energy balance method, Hydrol. Process., 27,
R.: Current and future projections of glacier contribution to 1901–1914, https://doi.org/10.1002/hyp.9799, 2013.
streamflow in the upper Athabasca River Basin, Can. Water Harder, P., Pomeroy, J. W., and Westbrook, C. J.: Hydro-
Resour. J./Rev. Can. des ressources hydriques, 45, 324–344, logical resilience of a Canadian Rockies headwaters
https://doi.org/10.1080/07011784.2020.1815587, 2020. basin subject to changing climate, extreme weather, and
Clarke, G. K. C., Jarosch, A. H., Anslow, F. S., Radić, forest management, Hydrol. Process., 29, 3905–3924,
V., and Menounos, B.: Projected deglaciation of western https://doi.org/10.1002/hyp.10596, 2015.
Canada in the twenty-first century, Nat. Geosci., 8, 372–377, Hopkinson, C. and Young, G. J.: The effect of glacier wastage on
https://doi.org/10.1038/ngeo2407, 2015. the flow of the Bow River at Banff, Alberta, 1951–1993, Hydrol.
Comeau, L. E. L., Pietroniro, A., and Demuth, M. N.: Glacier con- Process., 12, 1745–1762, https://doi.org/10.1002/(SICI)1099-
tribution to the North and South Saskatchewan Rivers, Hydrol. 1085(199808/09)12:10/113.0.CO;2-S,
Process., 23, pp. 2640–2653, 2009. 1998.
DeBeer, C. M., Wheater, H. S., Carey, S. K., and Chun, K. P.: Recent Hynčica, M. and Huth, R.: Long-term changes in precipitation
climatic, cryospheric, and hydrological changes over the interior phase in Europe in cold half year, Atmos. Res., 227, 79–88,
of western Canada: a review and synthesis, Hydrol. Earth Syst. https://doi.org/10.1016/j.atmosres.2019.04.032, 2019.
Sci., 20, 1573–1598, https://doi.org/10.5194/hess-20-1573-2016, Intsiful, A. and Ambinakudige, S.: Glacier Cover Change
2016. Assessment of the Columbia Icefield in the Canadian
Dee, D. P., Uppala, S. M., Simmons, A. J., Berrisford, P., Poli, Rocky Mountains, Canada (1985–2018), Geosciences, 11, 19,
P., Kobayashi, S., Andrae, U., Balmaseda, M. A., Balsamo, G., https://doi.org/10.3390/GEOSCIENCES11010019, 2021.
Bauer, P., Bechtold, P., Beljaars, A. C. M., van de Berg, L., Bid-
lot, J., Bormann, N., Delsol, C., Dragani, R., Fuentes, M., Geer,
https://doi.org/10.5194/hess-26-2605-2022 Hydrol. Earth Syst. Sci., 26, 2605–2616, 20222616 D. Pradhananga and J. W. Pomeroy: Glacial hydrological response to changing climate in the Canadian Rockies Kehrl, L. M., Hawley, R. L., Osterberg, E. C., Winski, D. A., R Core Team: R: A language and environment for statistical and Lee, A. P.: Volume loss from lower Peyto Glacier, Al- computing, R Foundation for Statistical Computing, Vienna, berta, Canada, between 1966 and 2010, J. Glaciol., 60, 51–56, Australia, https://www.r-project.org/ (last access: 9 May 2022), https://doi.org/10.3189/2014JoG13J039, 2014. 2017. Kienzle, S. W., Nemeth, M. W., Byrne, J. M., and Mac- Reynolds, J. R. and Young, G. J.: Changes in areal extent, elevation donald, R. J.: Simulating the hydrological impacts of and volume of Athabasca Glacier, Alberta, Canada, as estimated climate change in the upper North Saskatchewan River from a series of maps produced between 1919 and 1979, Ann. basin, Alberta, Canada, J. Hydrol., 412–413, 76–89, Glaciol., 24, 60–65, 1997. https://doi.org/10.1016/j.jhydrol.2011.01.058, 2012. Riedel, J. L., Wilson, S., Baccus, W., Larrabee, M., Fudge, T. J., Krogh, S. A. and Pomeroy, J. W.: Recent changes to the hydrologi- Fountain, A., and Riedel, C. J. L.: Glacier status and contribu- cal cycle of an Arctic basin at the tundra–taiga transition, Hydrol. tion to streamflow in the Olympic Mountains, Washington, USA, Earth Syst. Sci., 22, 3993–4014, https://doi.org/10.5194/hess-22- J. Glaciol., 61, 8–16, https://doi.org/10.3189/2015JoG14J138, 3993-2018, 2018. 2015. Marks, D., Winstral, A., Flerchinger, G., Reba, M., Pomeroy, J., Schiefer, E., Menounos, B., and Wheate, R.: Recent volume loss Link, T., and Elder, K.: Comparing Simulated and Measured Sen- of British Columbian glaciers, Canada, Geophys. Res. Lett., 34, sible and Latent Heat Fluxes over Snow under a Pine Canopy 1–6, https://doi.org/10.1029/2007GL030780, 2007. to Improve an Energy Balance Snowmelt Model, J. Hydrom- Sedgwick, J. K. and Henoch, W. E. S.: 1966 Peyto Glacier Map, eteorol., 9, 1506–1522, https://doi.org/10.1175/2008JHM874.1, Banff National Park, Alberta, Environment Canada, IWD 1010, 2008. 1 : 10, 000., 1975. Marshall, S. J., White, E. C., Demuth, M. N., Bolch, T., Stahl, K. and Moore, R. D.: Influence of watershed glacier cover- Wheate, R., Menounos, B., Beedle, M. J., and Shea, J. M.: age on summer streamflow in British Columbia, Canada, Water Glacier Water Resources on the Eastern Slopes of the Cana- Resour. Res., 42, 1–5, https://doi.org/10.1029/2006WR005022, dian Rocky Mountains, Can. Water Resour. J., 36, 109–134, 2006. https://doi.org/10.4296/cwrj3602823, 2011. Tennant, C. and Menounos, B.: Glacier change of the Columbia Ice- Moore, R. D., Fleming, S. W., Menounos, B., Wheate, R., Foun- field, Canadian Rocky Mountains, 1919–2009, J. Glaciol., 59, tain, A., Stahl, K., Holm, K., and Jakob, M.: Glacier change 671–686, https://doi.org/10.3189/2013JoG12J135, 2013. in western North America: influences on hydrology, geomor- Tennant, C., Menounos, B., Wheate, R., and Clague, J. J.: Area phic hazards and water quality, Hydrol. Process., 23, 42–61, change of glaciers in the Canadian Rocky Mountains, 1919 to https://doi.org/10.1002/hyp.7162, 2009. 2006, The Cryosphere, 6, 1541–1552, https://doi.org/10.5194/tc- Neupane, R. P., Adamowski, J. F., White, J. D., and Kumar, 6-1541-2012, 2012. S.: Future streamflow simulation in a snow-dominated Rocky Uppala, S. M., KÅllberg, P. W., Simmons, A. J., Andrae, U., Bech- Mountain headwater catchment, Hydrol. Res., 49, 1172–1190, told, V. D. C., Fiorino, M., Gibson, J. K., Haseler, J., Hernan- https://doi.org/10.2166/NH.2017.024, 2018. dez, A., Kelly, G. A., Li, X., Onogi, K., Saarinen, S., Sokka, Pomeroy, J. W., Gray, D. M., Brown, T., Hedstrom, N. R., Quin- N., Allan, R. P., Andersson, E., Arpe, K., Balmaseda, M. A., ton, W. L., Granger, R. J., and Carey, S. K.: The cold regions Beljaars, A. C. M., Berg, L. Van De, Bidlot, J., Bormann, N., hydrological model: a platform for basing process representation Caires, S., Chevallier, F., Dethof, A., Dragosavac, M., Fisher, M., and model structure on physical evidence, Hydrol. Process., 21, Fuentes, M., Hagemann, S., Hólm, E., Hoskins, B. J., Isaksen, L., 2650–2667, https://doi.org/10.1002/hyp.6787, 2007. Janssen, P. A. E. M., Jenne, R., Mcnally, A. P., Mahfouf, J.-F., Pradhananga, D. and Pomeroy, J. W.: Diagnosing changes in Morcrette, J.-J., Rayner, N. A., Saunders, R. W., Simon, P., Sterl, glacier hydrology from physical principles using a hydro- A., Trenberth, K. E., Untch, A., Vasiljevic, D., Viterbo, P., and logical model with snow redistribution, sublimation, firnifica- Woollen, J.: The ERA-40 re-analysis, Q. J. Roy. Meteorol. Soc., tion and energy balance ablation algorithms, J. Hydrol., 608, 131, 2961–3012, https://doi.org/10.1256/qj.04.176, 2005. https://doi.org/10.1016/j.jhydrol.2022.127545, 2022. Wilcoxon, F.: Individual Comparisons by Ranking Methods, Bio- Pradhananga, D., Pomeroy, J., Aubry-Wake, C., Munro, D., Shea, metrics Bull., 1, 80, https://doi.org/10.2307/3001968, 1945. J., Demuth, M., Kirat, N., Menounos, B., and Mukherjee, K.: Hydrometeorological, glaciological and geospatial research data from the Peyto Glacier Research Basin in the Cana- dian Rockies, Federated Research Data Repository [data set], https://doi.org/10.20383/101.0259, 2020. Pradhananga, D., Pomeroy, J. W., Aubry-Wake, C., Munro, D. S., Shea, J., Demuth, M. N., Kirat, N. H., Menounos, B., and Mukherjee, K.: Hydrometeorological, glaciological and geospa- tial research data from the Peyto Glacier Research Basin in the Canadian Rockies, Earth Syst. Sci. Data, 13, 2875–2894, https://doi.org/10.5194/essd-13-2875-2021, 2021. Hydrol. Earth Syst. Sci., 26, 2605–2616, 2022 https://doi.org/10.5194/hess-26-2605-2022
You can also read