Setting the Course: Navigating the North Superior Workforce in 2022-2023
←
→
Page content transcription
If your browser does not render page correctly, please read the page content below
Setting the Course: Navigating the North
                      Superior Workforce in 2022–2023
                                         2022–2023 Local Labour Market Plan

Written by:
Rachel Rizzuto and Dr. Martin Lefebvre
Setting the Course: Navigating the North Superior Workforce in 2022-2023
Limitations
The North Superior Workforce Planning Board recognizes the potential limitation of this
local labour market report and will continue to seek out information in areas that
require further analysis and action. The North Superior Workforce Planning Board
assumes no responsibility to the user for the consequences of any errors or omissions. This
document may be freely quoted and reproduced without the permission of North
Superior Workforce Planning Board provided that North Superior Workforce Planning
Board is acknowledged as the author of the document. The information presented in
this report is current at the time of printing.
For further information, please contact:
Madge Richardson
Executive Director
North Superior Workforce Planning Board
600 Hewitson St.
Thunder Bay, ON P7B 6E4
mrichardson@nswpb.ca | 807-346-2940
This project is funded in part by the Government of Canada and the Government of Ontario.Setting the Course: Navigating the North Superior Workforce in 2022-2023
About North Superior Workforce Planning Board
The North Superior Workforce Planning Board (NSWPB) is one of 26 Workforce Planning
Boards covering four regions across Ontario. Mandated by the Province of Ontario, the
role of the NSWPB is to identify, assess and prioritize the skills and knowledge needs of
community, employers, and individual participants/learners in the local labour market
through a collaborative local labour market planning process.
An active and broadly-based volunteer Board of Directors governs the affairs of the
organization. First established in 1996, NSWPB is recognized by community, economic
and municipal leaders as a “partner of choice” in the identification and
implementation of local solutions to local labour market issues.
Workforce Planning Boards play a key role in the Province’s goal of integrating its
programs and services. Part of the ongoing strategy to achieve this goal is to first
identify and then respond to the diverse regional and local labour market needs
throughout the province.
Vision
Our human resource pool will be strategically aligned, competitively positioned, and
progressively developed to meet future social and economic demands across
Northwestern Ontario.
Mission
Connecting community partners to improve the quality of life in our communities
through workforce development. The North Superior Workforce Planning Board will:
• Build a strategic workforce readiness plan;
• Create a dynamic, responsive process to satisfy current needs and prepare
people for emerging labour market opportunities within a global economy; and,
• Leverage community alliances to maximize labour market capacity and
competitiveness.
Mandate
Leading in the creation of innovative labour market solutions by:
• Providing authoritative and evidence-based research;
• Identifying employment trends;
• Targeting workforce opportunities; and,
• Initiating workforce development strategies.Setting the Course: Navigating the North Superior Workforce in 2022-2023
NSWPB Board of Directors
Crystal Olson (Chair) Doris Rossi
John DeGiacamo Roger Shott
David Farrell Owen Smith
John Hatton Bert Johnson
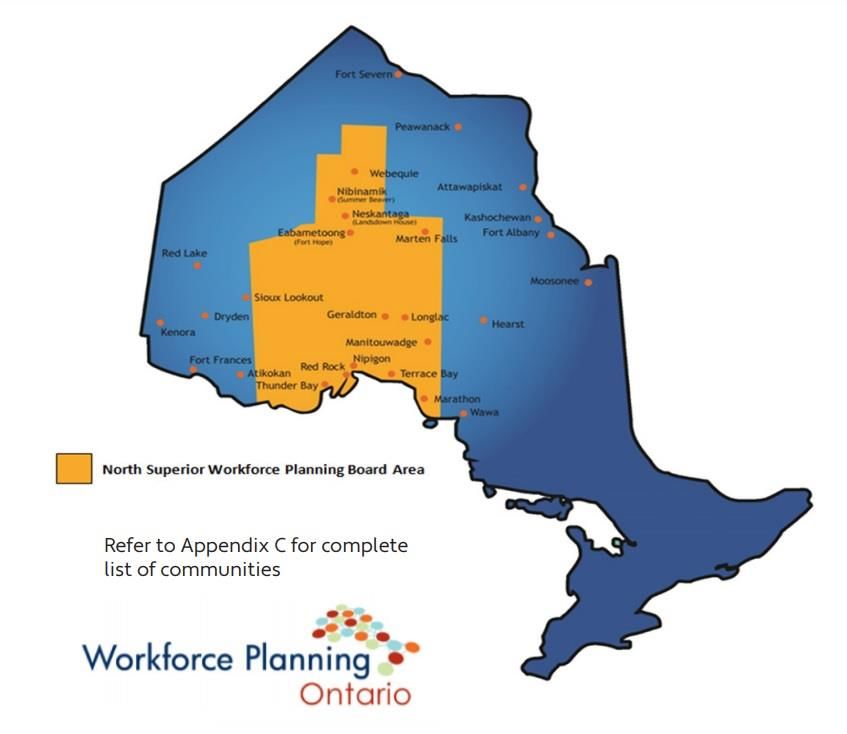
Refer to Appendix A for
complete list of communitiesLand Acknowledgement The North Superior Workforce Planning Board would like to acknowledge the First Peoples on whose traditional territories we live and work. We are grateful for the opportunity to have our office located on these lands and thank all generations of people who have taken care of this land. The office of the NSWPB is in the City of Thunder Bay, which is on Robinson-Superior Treaty territory. The land is the traditional territory of the Anishinaabeg and Fort William First Nation. NSWPB’s service area includes more than 40 communities, and each is home to many diverse First Nations, Inuit, and Métis Peoples. NSWPB recognizes and appreciates the historic connection that Indigenous people have to these territories. We support their efforts to sustain and grow their nations. We also recognize the contributions that they have made in shaping and strengthening local communities, the province, and Canada. Acknowledgements Development of the 2022-2023 Local Labour Market Plan (LLMP) for the North Superior Workforce Planning Board catchment area has been made possible by the insights of many community actors. We greatly appreciate the individual and collective contributions of time, talent, and perspectives in creating our local plan that is representative of our current realities in the ever changing social and economic landscape. The development of this report was done in partnership with Northern Policy Institute via the Northern Analyst Collective Program. Specifically, we would like to acknowledge Rachel Rizzuto (Research Manager) and Dr. Martin Lefebvre (Lead Policy Analyst) for this report. We would also like to acknowledge Samrul Aahad (Economist) for his data contributions. We would also like to acknowledge our funder, the Ontario Ministry of Labour, Training and Skills Development (MLTSD) for supporting us in our efforts to address local labour market challenges and opportunities.
Setting the Course: Navigating the North Superior Workforce in 2022-2023

A Note on Data
2022 is an exciting year for data. Statistics Canada will be releasing a series of census
datasets throughout the year that researchers, decision-makers, and you can use to
understand what is going on in Ontario’s northern regions and communities.

Now having said this, one of the limitations of this report is that where census data was
used, it was based on 2016 data. This was done so as the data collection and writing of
this report took place in December 2021 and January 2022. Furthermore, some
indicators such as business counts were only available up to June 2021 at the time of
data collection and writing. Nevertheless, armed with information gathered from the
consultations as well as additional literature, the report provides a detailed picture of
current trends and projections that NSWPB and others can utilize until more census data
is released.
Setting the Course: Navigating the North Superior Workforce in 2022-2023

Table of Contents
Introduction………………………………………………………………………............................... 1

Labour Market Consultations…………………………………………………............................... 1

Economic and Labour Market Data……………………………………………………………... 15

Employment Ontario Data Review…………………………………………............................... 39

Action Items…………………………………………………………………………………………… 56

Conclusion…………………………………………………………………………………………….. 57

Works Cited……………………………………………………………………………………………. 58

Appendix A: Communities in the NSWPB Region……………………………………………… 63

Appendix B: EO and non-EO Employment and Training Service Providers………………. 65

Appendix C: Glossary of Acronyms………………………………………………………………. 67

Appendix D: NSWPB and NPI Labour Market Tools, Programs, and Reports……………... 68
Introduction
For some, the year 2022 means they will be attending a post-secondary institution to
study electrical engineering or political science. For others, it means continuing to try to
balance work with childcare responsibilities. And for some it may mean switching
careers to open a business. These individuals and many more are at the heart of the
local economy, and the choices they make impact decision-making.

Of course, planning is no easy task. For the North Superior Workforce Planning Board
(NSWPB), their service area encompasses nearly 40 communities, including First Nations
and three Métis communities (see Appendix A for a full list). While there may be areas
where the needs and realities of these communities align, it is important to
acknowledge and account for the differences.

This report is broken up into several sections, the first of which is the Local Labour Market
Consultations, where expertise from a range of community actors provide insight on
current labour market conditions and next steps. Following this section is a statistical
breakdown of the labour force and employers in the NSWPB region. The third section
focuses on the experiences of Employment Ontario (EO) service providers, and data on
their EO programs. Finally, based on findings from the first three sections, the last section
outlines action items for the NSWPB going forward.

The picture of the labour market we are left with is one in which the COVID19
pandemic is still an influencing reality and some issues that have persisted prior to the
pandemic continue to be important such as Indigenous training and education, the
need for quality data, or access hurdles for EO clients (e.g., digital, transportation). Still,
there were elements of hope for future growth and recovery opportunities.

Labour Market Consultations
Throughout the month of December 2021 and early January 2022, various community
actors were asked a series of questions, one of which was: “Looking ahead three years,
what will a successful recovery and rebuild look like?” Some individuals countered,
asking: what do they think it will look like or what do they hope it will look like? While a
seemingly small distinction, it matters a great deal when it comes to planning.

This portion of the NSWPB Local Labour Market Plan aims to outline the results of several
focus groups and interviews that took place in December 2021 and January 2022. The
focus group and interview participants represented a wide variety of industries and
areas of expertise such as immigration, municipal government, education, employment
and training, business, and so on. Additionally, the individuals were located from
around the Thunder Bay district, both large and small communities. Overall, the key
goal was to provide a range of voices and perspectives that could speak to the current
and future landscape of the labour market.

                                               1
Setting the Course: Navigating the North Superior Workforce in 2022-2023
THINKING ABOUT TOMORROW, TODAY
To no one’s surprise, the impact of COVID19 on the economy and labour market has
manifested itself in various ways. The first is the noticeable shift in one’s relationship to
work, whether this be what individuals are looking for in a job or how they work (such as
working from home if they can). Regarding the former, there are instances of people
who do not want to go back to work due to the pandemic or what they value in a job.1
Reasons why this may be the case could include current access to government
benefits, working in a public- facing job being seen as risky, and longevity of a job
(Dunstan 2021). Of course, it was highlighted that this mindset is not the same for all
workers.
There has also been a demonstrated impact of the pandemic on females in the labour
market. In a study by Statistics Canada, it was found that “the impact on year-over-
year employment losses was consistently more severe for women than for men.”
(Grekou and Lu 2021). The service sector was primarily driving these losses and many
women make up employment in that sector (ibid 2021). This impact on women in the
workforce is likely not over. In a post-COVID19 scenario, it was estimated by McKinsey &
Company that women, low-wage earners, and those without a post-secondary
degree, are more likely to be disproportionately impacted by job displacements over
the next several years (Lund et al 2021, 79).
Recommendations: Given the shift in an employee’s relationship to work, it was
proposed that an employer might, for example, build more inclusive incentive
packages as a way to attract and/or retain workers. It’s not always about the
money. A second example is supporting employers as they adjust policies to
better reflect the shifting work/life balance realities. McKinsey & Company offer
up insight in this regard. They propose that businesses might think about what
activities can be done remotely as opposed to what jobs can be done remotely.
As well, defining metrics that measure employee satisfaction, connectedness,
and other factors can help employers assess gaps and opportunities (Lund et al
2021, 100).
The other recommendation was supporting female participation in the
workforce, as well as parents and guardians in general. While there are
numerous ways this could be done, one obvious way is childcare. According to
Statistics Canada, “one in four parents and guardians who were using childcare
and reported difficulty finding childcare said that the difficulty was specifically
related to the pandemic.” (Findlay and Wei 2021). One unique solution
suggested was the creation of a day care centre for staff at the Sleeping Giant
Brewery in Thunder Bay – which now has plans of opening a second centre
(Dunick 2021).
1See Table 2 in “From Crisis to Recovery: How COVID-19 is Impacting Business in Thunder Bay (part 7)” (Champaigne
2021).
2Setting the Course: Navigating the North Superior Workforce in 2022-2023
Another discussion point in the consultations was that of businesses, which can be
likened to walking on a wire. While there may be growth in some communities,
pandemic limitations are negatively impacting businesses. Some may not be able to
afford the continuous closing and reopening. In the Thunder Bay COVID19 Business
Impact Survey, the percentage of business respondents that indicated they had to
close their business/organization temporarily was 35 per cent in May 2020, dropped to a
low in the fall, and then shot up again to 33 per cent in April 2021 (Champaigne 2021,
11). Finally, it was stated that before pandemic-related funding reduces, businesses
need to be ready.
Naturally, the consultation discussions also revolved around trends and issues in labour
supply and demand. There are gaps in the workforce right now and they will likely
continue in the future, barring any changes. This supply issue is the product of multiple
sources such as retirements, lack of people wanting to fill jobs (could be due to type of
work available, assistance provided by government during COVID, lack of interest in
what is available based on their education and skills, etc.), or simply industry cycles.
Additionally, it is one thing to have supply issues, but we also need to make sure that
the labour force is appropriately engaged. For example, some may not have regular
access to internet – an issue that is no stranger to Northern Ontario. There is an uneven
distribution in the areas that have a 50/10 mbps connection – 50 mbps download and
10 mbps upload vs 5/1 mbps (see Figures 1 and 2). Finally, discussions made note of the
influence of the transient workforce and the lack of skilled employees in some
communities.
3Setting the Course: Navigating the North Superior Workforce in 2022-2023
Figure 1: Current 50/10 mbps areas, Northern Ontario snapshot
Source: National Broadband Internet Service Availability Map, 2021.
Note: light orange >0% to 25%, burnt orange >25% to 50%, dark orange >50% to 75%, and brown >75% to
100%.
4Setting the Course: Navigating the North Superior Workforce in 2022-2023
Figure 2: Current 5/1 mbps areas, Northern Ontario snapshot
Source: National Broadband Internet Service Availability Map, 2021.
Note: yellow >75% to 100%.
On the demand side of the equation, participants stated that they are seeing a current
and/or future demand in several sectors such as childcare, construction, health care,
and mining. However, it was noted by a participant that COVID19 has impacted youth
trying to secure employment in some settings. In a 2020 youth survey by the Workforce
Planning Board of Waterloo Wellington Dufferin, it was found that 26 per cent of youth
respondents stated that finding a job was more difficult now due to COVID (2020, 47).
On that note, youth respondents also outlined several reasons that were holding them
back from securing employment such as concerns about catching COVID19 (31%),
lack of response from employers (24%), and either a lack of utilizing employment
resources or not knowing they exist (46%) (ibid 2020, 45).
Recommendations: There were several recommendations noted for addressing
the supply and demand challenges, the first of which is focusing on the
attraction and retention of labour. Initiatives such as the Rural and Northern
5Setting the Course: Navigating the North Superior Workforce in 2022-2023
Immigration Pilot program, as well as the International and Community
Matchmaker2 run by the Association des francophones du Nord-Ouest de
l'Ontario (AFNOO) can aid in this regard.
The second recommendation was industry specific, focusing on increasing
medical graduates across Northern Ontario as opposed to solely relying on
virtual health care. According to the Northern Ontario School of Medicine,
Northern Ontario needs 325 physicians as of June 2021, 135 of whom need to be
family physicians. Rural generalists were also noted as a particular need within
this 325 (NOSM n.d.).
Several other recommendations were made such as supporting opportunities for
post-secondary students, focusing on opportunities in the Indigenous space such
as the projected population increases, prioritizing vulnerable groups, targeting
barriers to employment, and encouraging inclusive workplaces.
The fourth major discussion point was on training the workforce, whether this be
discussing opportunities in certain industries with youth or planning for future demand in
jobs. There were a range of items discussed, such as: targeted demographics,
appropriate planning, communicating opportunities, access and availability of training,
potential industry shifts to provide opportunities, and current certification challenges.
In the post-pandemic scenario developed by McKinsey & Company, they estimated
that across their eight focus countries3, it was estimated that 107 million individuals may
need to transition into another occupation by 2030 due to shifting occupational
demands (Lund et al 2021, 83). Of the 17.1 million United States workers that may need
to change occupations, 87 per cent would need to find a job in a different
occupational category (ibid 2021, 86). Closer to home, the Ontario government and
others have taken steps to retrain the workforce. For example, the Province committed
to an additional $5 million to expand the Second Career program, while groups such as
Lighthouse Labs developed the Ontario Web Developers Network which equips
un/underemployed Ontarians with skills needed for the digital workspace (Ontario
Government 2021; Lighthouse Labs n.d.).
Recommendations: Alongside subsidies to employers, there needs to be a
continued focus on skill-building education. In addition to the investment the
Province has made into the Second Career program, another initiative is the Skills
Development Fund, which supports the training, retraining, and hiring of workers
in Ontario (Ontario Government 2021). Also, in one of the consultations it was
mentioned skill stockpiling may be occurring right now at the post-secondary
level given enrolment levels. Continued support in this area is also critical.
2 The International and Community Matchmaker was a pilot run by Northern Policy Institute from 2018 to 2019 in
Northwestern Ontario. Given the success of the Northwest Matchmakers, the pilot was launched in Northeastern Ontario
as well.
3 China, France, Germany, India, Japan, Spain, United Kingdom, and the United States.
6Setting the Course: Navigating the North Superior Workforce in 2022-2023
The other recommendations noted were the need to start thinking outside the
box when it comes to certification and licensing, and second, extending
internship timeframes. For example, the current year-long internships with the
Northern Ontario Heritage Fund Corporation (NOHFC) could be two years. By
extending the timeline, not only does this mean greater financial stability for the
intern, but they are able to dive deeper into skills and experiences in a consistent
space.
Finally, other topics that were brought up in the consultations included the impact of
COVID19 on community engagement, supply chain concerns, and how not all
industries were impacted by COVID19.
In light of the above challenges, there were several external factors identified that play
a role in the success of the labour market now and in the future:
HOUSING SUPPLY AND AVAILABILITY
Housing plays an important role not only in one’s employment success (see Rizzuto 2020,
32), but can impact a community’s ability to attract and retain potential workers.
During COVID19, if you were in the market for a home, you had to move quick. In
February 2021, national resales were at an all-time high, but inventory was limited
(Khan, Bilyk, and Ackman 2021). This is certainly the case in the City of Thunder Bay
where completions for all types of dwellings have gradually declined from 1990 to 2021
(less than 100 in July 2021) (Figure 3). Simultaneously, the average price of a home in
Thunder Bay increased by 12.9 per cent from November 2020 to November 2021 (Figure
4).
7Setting the Course: Navigating the North Superior Workforce in 2022-2023
Figure 3: All Dwelling Type Completions for City of Thunder Bay, 1990-2021
900
800
700
600
500
400
300
200
100
0
Dec-90
Dec-91
Dec-92
Dec-93
Dec-94
Dec-95
Dec-96
Dec-97
Dec-98
Dec-99
Dec-00
10-Dec
17-Dec
11-Dec
12-Dec
13-Dec
14-Dec
15-Dec
16-Dec
18-Dec
19-Dec
20-Dec
21-Jul
1-Dec
2-Dec
3-Dec
4-Dec
5-Dec
6-Dec
7-Dec
8-Dec
9-Dec
Source: Author’s calculations, CMHC Starts and Completions Survey.
Note: Data for all intended markets; all dwelling types: single, semi-detached, row, and apartment. Graph
originally produced for Walleye Magazine, October 2021.
8Setting the Course: Navigating the North Superior Workforce in 2022-2023
Figure 4: Home Prices across Northern Ontario, Ontario and Canada, 2020-2021
$1,000,000
$900,000
$800,000
$700,000
$600,000
$500,000
$400,000
$300,000
$200,000
$100,000
$0
Canada Ontario Thunder Bay Sudbury North Bay* Sault Ste. Timmins,
Marie Cochrane &
Timiskaming
Districts
Nov-20 Nov-21
Source: The Canadian Real Estate Association, National Price Map.
Note: *Areas displaying MLS Home Price Index benchmark prices; all other areas display average prices.
MENTAL HEALTH AND GENERAL WELL-BEING
Burnt out.
Conversations around mental health and general well-being have strengthened during
COVID19 and for good reason. In December of 2020, 38 per cent of Canadians rated
their mental health as very good or excellent – it was 53 per cent in 2019 (Kronfli 2021,
4). Additionally, in 2021, 73 per cent of Ontario residents that were surveyed reported
that they are experiencing some level of stress, and 63 per cent are worried about
personal finances (ibid 2021, 7). Issues such as these can have significant
consequences. In a report by the Ontario Chamber of Commerce, it was outlined that
these issues not only can strain health care resources, but it can also impact employers
as productivity is hindered. As well, “without a healthy and productive workforce,
business competitiveness will be undermined, with many organizations unable to fully
contribute to their communities and the economy.” (ibid 2021, 8).
As such, practices such as encouraging an open atmosphere, focusing on health as a
part of the work culture, developing a mental health strategy in consultation with
employees are important (ibid n.d., 11, 13).
9Setting the Course: Navigating the North Superior Workforce in 2022-2023
POPULATION GROWTH
No discussion on the Northern Ontario labour market would be complete without
acknowledging the impacts of the aging population. This trend is evidenced in the
demographic dependency ratio (DDR), which is the number of workers to dependents
(youth under 15 or seniors over 65). When one’s population is retiring and not enough
youth are entering the workforce to fill those jobs, the DDR increases. Ideally, one’s DDR
should be 2:1 – two workers for every one dependent. For the District of Thunder Bay,
recent projections put the DDR at a high of 0.67 in the mid-2030s and then falling to 0.65
just after 2045 (see Figure 11). A DDR close to 0.5 is the goal. Encouraging newcomers
and ensuring the domestic population is fully participating in the labour force will help
ease this DDR.
In addition to attracting and retaining migrants, another trend that needs to be
considered is the increase in the Indigenous population. It is projected that between
2015 and 2030, the total Indigenous population in the District of Thunder Bay will grow
by 21.5 per cent (Moazzami 2019, 18). Drilling down to the working-age individuals, the
District will see a 14.8 per cent rise during this time period (ibid 2019, 18). While this
increase is good news, an important factor to consider is that educational
achievement levels are lower for Indigenous peoples compared to the total
population, which can impact future labour force productivity (ibid 2019, 20). As such,
continuing to support educational pathways is critical.
DATA
Sitting down to crunch numbers is not a new concept, however, COVID19 has
highlighted and underlined the need for quality data, particularly real-time data. It was
noted in the consultations that having good data on hand is critical.
OTHER
In addition to the above topics, other items that were mentioned in the discussions
included the importance of who is playing a role in the recovery.
Overall, the realities of today’s labour market are a mix of old and new trends.
However, what has not changed are the priorities to support employment, businesses,
industry and so on for all communities in the NSWPB service area.
NEW PLAYERS ON THE FIELD? INDUSTRIES AND OCCUPATIONS
When participants were asked about new industries and occupations that could
emerge in the local economy, the responses were varied and covered multiple sectors
– some of which are not new but are certainly growth areas to watch. Examples
10Setting the Course: Navigating the North Superior Workforce in 2022-2023
include tourism, information technology and e-commerce, mining, and health care.
According to the Prosperity and Growth Strategy for Northern Ontario (PGSNO), sectors
such as these are prime opportunities for growth. To illustrate, mining and tourism, as
well as forestry, steel, and agriculture are shifting to a more knowledge-based and
innovation-focused environment (Canada 2018, 7). In mining, this is evidenced by the
use of battery-electric vehicles in underground mines, which has the positive effect of
reducing greenhouse gases (Xavier 2021, 9). This shift in mining is something that can be
marketed to youth to get them excited about the industry, as stated in the consultation.
Another opportunity that was highlighted was the potential for Northwestern Ontario to
be a hub – whether it be for a lithium processing plant or a nuclear plant.
One sector that ought to be discussed, particularly given its proliferation during
COVID19, is e-commerce. While COVID19 has contributed to the displacement of
workers, particularly in occupations that are more public-facing, such as restaurants,
there is also growth happening in other occupational areas simultaneously. For
example, a clothing store may choose to sell their products online thereby creating a
demand for workers in warehouses and delivery (Lund et al 2021, 71).
In a report by the Information and Communications Technology Council, it was
estimated that by the end of 2022, over 2 million individuals will be employed in the
digital economy – a growth rate that is faster than various other sectors and the overall
economy (ICTC 2020, 7). However, a potential impediment to this growth in Northern
Ontario is our digital infrastructure.
And on this note, the consultation participants stated that there were barriers to
consider in sectors such as health care. For example, while virtual care is a way to break
down access barriers in Northern Ontario4, it does not mean that health care
professionals in communities are no longer needed. Industry examples such as this
highlight the importance of recognizing that there are opportunities to take advantage
of for Northern Ontario but that not all communities are the same. Thinking strategically
about what barriers could hold some communities back from leveraging economic
opportunities will help to lift human capital across the board – not just for the few.
Third, in the discussions, it was stated that it is important to support the labour market
participation and capacity building of Indigenous peoples and Indigenous-led
businesses/organizations. In a 2020 Ontario Aboriginal Business Survey by the Canadian
Council for Aboriginal Business (CCAB), responses called attention to the factors that
were important to Indigenous business growth including financing, innovation, internet
connectivity, and institutional supports (37-44). In terms of financing, the survey found,
among other things, that personal savings was the major source for start-up and
ongoing financing, and that 37 per cent of the Indigenous female business owners
reported having a harder time accessing equity and capital compared to males (23%)
(ibid 2020, 37-38).
4 See Newbery and Malette 2020; McMillan Boyles et al 2020; Health Quality Ontario 2017.
11Setting the Course: Navigating the North Superior Workforce in 2022-2023
Locally, organizations such as the Anishnawbe Business Professional Association, the
PARO Centre for Women’s Enterprise, Anishinabek Employment and Training Services
(AETS), and ORIGIN, are working to support Indigenous entrepreneurship and business
development as well as equipping individuals with the know-how and training for
labour market success.
Finally, other items discussed during the consultations included type of work (contract vs
full-time) and the impact of remote work on local organizations.
Spotlight on Mining
Mining is an industry targeted for future opportunity, investment and recovery. The associated benefits
of this are creating jobs in communities, new businesses, innovative practices, and possibly the creation
of a hub for Thunder Bay. As well, given the pandemic, there are natural opportunities for the health
care sector and mining to work together, particularly on the health care restrictions front.
However, there are several influencing factors to consider as part of encouraging growth in the industry.
The first is making strong, tailored efforts into educating and communicating with the younger
generation about industry opportunities and successes and thinking about what is holding back efforts
so far. It was noted that industry as well as local government can be of assistance for education and
recruitment.
A second and related point is to shift how education and training is delivered. For example,
incorporating more training and mentorship into the industry, shifting industry thinking about
qualifications, and encouraging cross-training so people have a wider set of skills. It was stated that
progress still needs to be made on the training front. An additional point was made about the provincial
government contributing by modernizing apprenticeships.
Third, some individuals in the younger generation may have a different relationship to work than the
older generation. For example, one participant stated younger individuals may not be interested in a fly-
in/fly-out lifestyle, which translates to a need for changes in training. They may also not want the same
type of work as the older generation, which impacts succession planning if youth are choosing not to
enter the mining workforce.
The fourth point is on staffing and recruitment. There were several points on this front, the first is that
personnel will be needed to fill in-demand jobs now and in the future. Tied into this is who and from
where is this labour supply coming. It was noted that some companies are having a difficult time finding
people while others not so much. Furthermore, it was stated that attraction and retention involve
multiple actors including mining companies. For companies, this could mean implementing fixed term
contracts as opposed to full-time, as well as offering flexible hours.
An additional point on staffing and recruitment had to do with who is being recruited. Aside from the
youth cohort, the growing Indigenous population presents an opportunity for companies. Targeting
vulnerable groups as a part of recruitment efforts is also an option. On the first point, one observation
from the consultations is that there are positive examples of Indigenous employment at mines, however,
work still needs to be done on the engagement piece. As such, working with Indigenous communities
was one of the stated roles that industry needs to carry out.
12Setting the Course: Navigating the North Superior Workforce in 2022-2023
On a related note, it is important to think about the various types of jobs needed in a mine – contractors,
engineering, construction, and so on. This ties into the first point about educating youth about the types
of opportunities available in the industry.
As identified in the consultations, the workforce priorities identified align with the above – workforce
training, youth recruitment, staffing, and attraction and retention. Other priorities were infrastructure
investments – whether it be municipal or housing. Both of these can impact successful attraction and
retention efforts. Additionally, it was stated that it is important to leverage the human capital from
projects that are winding down.
Finally, while some specific roles were identified above, others were also highlighted. For companies, this
included collaboration and engagement as well as focusing on basic infrastructure for retention. For the
provincial government, its roles include workforce payroll and ensuring foundational infrastructure is in
place so as not to impede projects moving forward. Additionally, organizations like the NSWPB operate
locally and regionally, which is valuable, especially when bringing players together.
WE EACH HAVE A PART TO PLAY
The economic needs and realities of one community do not always translate to
another. Indeed, the tools used, and the priorities identified, will vary. As such, the
participants were asked: “When thinking about strengthening the economic health of
communities, what is the role of: Government? Your organization/industry? Civil society?
The public?”
The answers were varied, ranging from business supports, providing quality data, and
addressing education and training gaps for Indigenous peoples to infrastructure
investments, engagement, and wage subsidies – just to name a few. Despite this
variety, there were some areas that overlapped between organizations such as
attraction and retention, education and training, and collaboration/engagement.
Finding alignments between actors can be beneficial as it could lead to collaborative
projects and/or sharing of resources and information.
A second observation was the impact of certain roles on roles elsewhere. For example,
investment in housing can support attraction and retention efforts, or supporting
education and training may lead to a call for greater quality data. While these
statements may seem obvious, they make an important point about knowing who does
what and for whom. And this is where asset mapping can step in. An asset map is a tool
that catalogues services, resources, and strengths in a given community (RHIhub n.d.).
One example is the Vancouver Food Asset Map developed by Vancouver Coastal
Health. In an interactive GIS map, a user can choose from a drop-down menu of
services and resources in the community such as “Kitchen or Food Programs”, “Free or
Low-Cost Grocery Items”, and “Neighbourhood Food Networks” (Vancouver Coastal
Health n.d.). Closer to home, there is the 211 Ontario North program that maintains a
more comprehensive list of assets across Northern Ontario communities –
13Setting the Course: Navigating the North Superior Workforce in 2022-2023
Employment/Training, Homelessness, Youth, Indigenous Peoples, etc. (211 Ontario North
n.d.).
WORKFORCE PRIORITIES MOVING FORWARD
To end each session, participants were asked the following: “From the perspective of
your organization/industry, what are the short and medium-term workforce priorities
going forward? Why?” The answers were grouped into six categories.
• Data: Alongside communicating data to groups such as employers, several
participants were focused on data collection and analysis to fill in data gaps.
• Engagement and Communication: Whether it be simply communicating the
services an organization can offer to their community, or engaging with
communities to encourage buy-in, etc.
• Infrastructure: Municipal infrastructure and housing were noted priorities. On the
housing front, as mentioned earlier, is critical for the attraction and retention of
individuals in communities. It can also play an important role in one’s job success.
• Building a Strong Labour Force: Several participants made note that there is a
need to address the current and future labour market supply and demand
issues. With respect to demand, this referred not only to occupational demand,
but to the need of matching skills to jobs in demand. In relation to this, active
and appropriate attraction and retention steps need to be made. Finally, several
participants discussed a focus on training, whether it be helping students
transition into the workforce, the need for holistic training, stabilizing industry
training models, or ensuring we are training local individuals over relying heavily
on a transient workforce.
• Supporting Businesses: Given the changing relationship that some people are
having to the workforce, there is a need to think about how employers can best
manage this transition. Additionally, how can we work on expanding monetary
supports beyond a handful of sectors, and can we support employers through
an asset map and assist them with pandemic policies?
• Planning: Developing strategic plans and conducting regular assessments to
measure progress.
Overall, the consultations highlighted that while the COVID19 pandemic brought about
some new developments, there are some recurring issues and trends that have been a
part of the labour market policy landscape for some time. However, this is not to say
that these areas have been ignored. They are layered and tie into other factors. Take
for example Indigenous education and training gaps. Organizations like AETS or ORIGIN
are working to support progress, but there are unique barriers that contribute to the
issue such as access to reliable internet, education delivery, reliable funding, and gaps
in the coordination of and access to services and programs (Grewal 2018, 6-8).
14Setting the Course: Navigating the North Superior Workforce in 2022-2023
As outlined in the Action Item section of the report, engagement with key players
through these consultations, as well as in other instances, are important for identifying
trends and growth areas for the labour market and economy in general. These
discussions can also help fill in knowledge gaps and provide context to statistical data.
Economic and Labour Market Data
As mentioned in the consultations, good and reliable data is critical. With it,
communities, organizations, governments, and individuals can make informed decisions
– whether it be a student wondering about future in demand jobs or a municipality
measuring the economic impact of a mill. The data in this section focuses on a range of
indicators, from population estimates and employment rates to occupational
breakdowns by sex. These indicators can provide insight into the labour market and
what next steps NSWPB can take.
POPULATION
Figure 5 below illustrates the total annual population estimates of the communities
within the NSWPB region. Compared to the previous Local Labour Market report by
NSWPB5, the population has declined recently despite a gradual increase since 2015.
This decline can be traced to influences of migration flows (Figure 6).
Regarding the Indigenous population, in 2016 the total stood at 21,755 (Statistics
Canada 2017). Unfortunately, the updated census population estimates for Indigenous
peoples in Canada won’t be available until September 2022 (Statistics Canada 2021).
5 See “On the Road to Recovery: Becoming A Superior Workforce post COVID-19” (NSWPB 2021).
15Setting the Course: Navigating the North Superior Workforce in 2022-2023
Figure 5: Annual Population Estimates of the NSWPB Region, 2006-2021
Source: Author calculations, Population estimates, July 1, by census subdivision, 2016 boundaries Table: 17-10-0142-01.
Note: Data for Thunder Bay District minus Osnaburgh and Ojibway Nation of Saugeen plus Ring of Fire communities.
16Setting the Course: Navigating the North Superior Workforce in 2022-2023
Figure 6: Components of Population Growth, Thunder Bay District, 2015-2021
Source: Author calculations, Components of population change by census division, 2016 boundaries Table: 17-10-0140-
01.
On the topic of immigration, an interesting observation is the percentage of each
immigration generation who live in the Thunder Bay area. In other words, are the
newcomers that come to Thunder Bay first, second or third generation? From 2001 to
2016, the majority were third generation or more (73 per cent in 2016) while only a
comparatively smaller percentage of people were first generation (9 per cent in 2016).
What this indicates is that from 2001 to 2016, first generation immigrants were less
interested in coming to Thunder Bay (Statistics Canada, various census).
Of new immigrants that do come to Thunder Bay, most are temporary residents – those
holding a study or a work permit. Nevertheless, we see a steady increase of those with
temporary status and permanent resident admissions.
17Setting the Course: Navigating the North Superior Workforce in 2022-2023
Table 1: Study Permit and Work Permit Holders for Work Purposes by Intended
Destination, 2013-2019
District 2013 2014 2015 2016 2017 2018 2019
Thunder Bay 935 930 1,115 1,480 1,930 2,570 2,725
Northwestern
1,295 1,270 1,470 1,815 2,390 3,050 3,190
Ontario
Ontario 125,970 153,535 184,100 205,970 231,870
Source: IRCC, CDO, Temporary Residents, January 31, 2020 Data; Canada - Study permit holders by province/territory of
intended destination, gender and year in which permit(s) became effective, January 2015 - July 2021. IRCC, July 31,
2021; Canada - Temporary Foreign Worker Program (TFWP) work permit holders by province/territory of intended
destination and year in which permit(s) became effective, January 2015 - July 2021. IRCC, July 31, 2021.
Table 2: Admissions of Permanent Residents by Intended Destination, 2013-2019
District 2013 2014 2015 2016 2017 2018 2019
Thunder Bay 125 140 160 295 240 330 420
Northwestern
170 210 230 385 330 420 520
Ontario
Ontario 103,625 110,035 111,955 137,440 153,395
Source: IRCC, CDO, Permanent Residents, January 31, 2020 Data; Canada - Admissions of Permanent Residents by
Province/Territory of Intended Destination and Immigration Category, January 2015 - July 2021. IRCC, July 31, 2021.
Figure 7 shows a similar trend to Figure 5. Given how the City of Thunder Bay is the
largest city in the District (and second in all of Northern Ontario), this is no surprise. What
is interesting is that we do not see this dramatic drop replicated in the next ten largest
communities in the Thunder Bay District (Figure 8). Of course, that is not to say that the
loss of residents, whether it be due to age or out-migration, does not have some impact
on smaller communities.
18Setting the Course: Navigating the North Superior Workforce in 2022-2023
Figure 7: Annual Population Estimates of Thunder Bay Census Metropolitan Area, 2006-
2021
Source: Author calculations, Statistics Canada Table 17-10-0135-01.
Note: A census metropolitan area “is formed by one or more adjacent municipalities centred on a population centre
(known as the core). A CMA must have a total population of at least 100,000 of which 50,000 or more must live in the
core.” (Statistics Canada 2018).
19Setting the Course: Navigating the North Superior Workforce in 2022-2023
Figure 8: Population Estimates of the 10 Largest Communities Outside of the City of
Thunder Bay, 2020-2021
Source: Population estimates, July 1, by census subdivision, 2016 boundaries Table: 17-10-0142-01.
Now, it doesn’t appear that the overall slump will last for long. In Figure 9 we see a
sharp increase for the District starting in 2022. This could be due to resumption of
migration flows into the area as COVID19 hampered this as shown in Figure 6 (Ontario
Government 2021b). Similar upward growth is expected in the other two Northwestern
Ontario districts of Rainy River and Kenora. However, unlike Thunder Bay, these two
Districts do not level off (Ontario Government 2021c).
20Setting the Course: Navigating the North Superior Workforce in 2022-2023
Figure 9: Population Projections for the District of Thunder Bay, 2020-2046
155,000
154,000
153,000
152,000
151,000
150,000
149,000
148,000
2028
2041
2020
2021
2022
2023
2024
2025
2026
2027
2029
2030
2031
2032
2033
2034
2035
2036
2037
2038
2039
2040
2042
2043
2044
2045
2046
Source: Author calculations, Statistics Canada for 2020 and Ontario Ministry of Finance projections (Spring 2021),
Population projections by age and sex for the 49 census divisions.
Figure 10 below illustrates population projections for the District of Thunder Bay broken
down by three age groups. In the working age population (15-64) there is a tiny
increase between 2040 to 2046 while those aged 65 will experience a small decline
during that same period. One potentially troublesome observation is the small size of
the youth cohort (0-14). As those in the workforce reach retirement age and are no
longer participating in the labour force, this will mean many jobs in demand for people.
When taking a closer look year-over-year, the data shows that the working-age
population and young dependents (0-14) gradually decline in the early 2020s, but then
are back up in the mid to late 2030s. The number of seniors (65+) experiences a gradual
incline starting in 2020s, levels off in the 2030s and then experiences a slight decline
starting in the 2040s. It is likely a portion of that ‘scoop’ near the late 2030s for the 15-64
age cohort reflects the youth that are entering the labour force.
21Setting the Course: Navigating the North Superior Workforce in 2022-2023
Figure 10: Population Projections for Thunder Bay District by Age, 2020-2046
120,000
98,106
100,000 93,207
80,000
60,000
39,539
40,000 31,519
21,794 21,379
20,000
0
0 to 14 15 to 64 65 Plus
2020 2030 2040 2046
Source: Author calculations, Statistics Canada for 2020 and Ontario Ministry of Finance projections (Spring 2021),
Population projections by age and sex for the 49 census divisions.
One of the reasons it is important to understand age groups within the population is to
measure the burden on those in the workforce. This ‘burden’ is what is known as the
demographic dependency ratio (DDR). As outlined earlier, an ideal scenario would be
two workers per one dependent. When there is a higher ratio of dependents, it can put
a strain on those in the workforce to fund services like public education or health care
services.
Figure 11 shows that compared to the 2016 projections, the DDR estimates for the
District of Thunder Bay have lowered significantly when working from the latest 2021
population data. If immigration can return to levels prior to the pandemic, this could be
an influencing factor on the DDR projections.
22Setting the Course: Navigating the North Superior Workforce in 2022-2023
Figure 11: Demographic Dependency Ratio Projections in Thunder Bay District, 2016 vs
2021 projections
Source: Author calculations, Statistics Canada for 2020 and Ontario Ministry of Finance projections (Spring 2021),
Population projections by age and sex for the 49 census divisions.
LABOUR FORCE CHARACTERISTICS
Armed with an understanding of the current and projected population estimates, this
portion of the report will outline a range of characteristics of the labour force. To start,
Table 3 illustrates the number of individuals within the labour force as well as the
participation, employment, and unemployment rates for the census metropolitan area
of Thunder Bay. Unfortunately, this annual data is not made available for all
municipalities or the entire District.
The number of individuals in the labour force since 2006 has fluctuated within a few
thousand people or so, recently dipping in 2020. As well, we would naturally see an
increase in unemployment due to COVID19.
23Setting the Course: Navigating the North Superior Workforce in 2022-2023
Table 3: Labour Force Statistics, Thunder Bay Census Metropolitan Area, 2006-2020
2006 2011 2016 2017 2018 2019 2020
Population 104,000 104,500 104,700 104,800 104,800 104,700 104,300
Labour force 66,200 64,800 64,500 65,200 67,100 65,400 62,700
Not in labour force 37,800 39,700 40,200 39,600 37,700 39,400 41,700
Participation rate 63.7 62 61.6 62.2 64 62.5 60.1
Employment rate 58.8 57.7 57.4 58.7 60.8 58.9 55.1
Unemployment rate 7.6 6.8 6.8 5.7 5.1 5.5 8.3
Source: Author calculations, Labour force characteristics by census metropolitan area, annual, inactive Table: 14-10-
0096-01.
Tables 4 and 5 below outline total full- and part-time employment in the census
metropolitan area of Thunder Bay over the past 20 years, as well as numbers broken
down by sex. In two of the selected seven years below, the number of females
employed has been greater than men – but not by much. For the most part,
employment between sexes tends to be roughly the same. Females tend to be found
more in part-time employment positions compared to men. As noted elsewhere in this
report, COVID19 has had a significant impact on females given that they have typically
been found in public-facing occupations (see Figure 14 for a breakdown of
occupations by sex).
Table 4: Employment Status Statistics, Thunder Bay Census Metropolitan Area, 2001-2020
Employment 2001 2011 2016 2017 2018 2019 2020
Employed
61,600 60,300 60,100 61,500 63,700 61,700 57,500
Employed
32,900 30,900 30,000 30,100 32,300 31,600 29,200
(Males)
Employed
28,800 29,500 30,200 31,400 31,400 30,200 28,300
(Females)
Full-Time
48,200 46,500 46,600 47,400 49,500 49,300 46,100
Employment
Part-time
13,400 13,800 13,500 14,100 14,200 12,500 11,400
Employment
24Setting the Course: Navigating the North Superior Workforce in 2022-2023
Full-Time as
a % of all 78.2 77.1 77.5 77.1 77.7 79.9 80.2
Employment
Source: Author calculations, Statistics Canada Labour Force Characteristics by Census Metropolitan Area, Annual Table
14-10-0096-01.
Table 5: Employment Status by Sex, Thunder Bay Census Metropolitan Area, 2001-2020
Employment 2001 2011 2016 2017 2018 2019 2020
Full-time
Employment 28,700 26,700 25,400 25,600 27,200 27,400 25,400
(Males)
Full-Time
Employment 19,500 19,900 21,200 21,900 22,300 21,900 20,800
(Females)
Part-time
Employment 4,200 4,200.0 4,500 4,600 5,100 4,200 3,800
(Males)
Part-time
Employment 9,200 9,600 9,000 9,500 9,100 8,300 7,500
(Females)
Males as a %
of Full-time
Employment 59.5 57.4 54.5 54.0 54.9 55.6 55.1
Females as a
% of Full-time
40.5 42.8 45.5 46.2 45.1 44.4 45.1
Employment
Males as a %
of Part-time
Employment 31.3 30.4 33.3 32.6 35.9 33.6 33.3
Females as a
% of Part-time
68.7 69.6 66.7 67.4 64.1 66.4 65.8
Employment
Source: Author calculations, Statistics Canada Labour Force Characteristics by Census Metropolitan Area, Annual Table
14-10-0096-01.
25Setting the Course: Navigating the North Superior Workforce in 2022-2023
According to Figure 12, total incomes for both males and females have been
increasing since 2006. Another noticeable observation is that the income of females is
lower than that of males. This difference can be attributed to a variety of factors such
as part-time vs full-time work, occupation, industry, education, and demographics, to
name a few (Pay Equity Office n.d.). While the wage gap has steadily declined since
1998, females still earn 89 cents to every dollar earned by a male (ibid n.d.).
In a 2019 study by Statistics Canada, it was found that when considering the factors
that explained why the wage gap shrunk from 1998 to 2018, the entire gap could not
be explained (Pelletier et al 2019, 7). This can be due to “the impact of any measurable
wage-related characteristics that were not able to be included in the particular
study”6, as well as unobservable wage-related characteristics such as gender-based
wage discrimination, work motivation, societal expectations, etc. (ibid 2019, 6).
Figure 12: Median and Average Total Income by Sex, Thunder Bay Census Metropolitan
Area, 2006-2019
60000
50000
40000
30000
$
20000
10000
0
Median total Median total Median total Average Average Average
income (both income income employment employment employment
sexes) (males) (females) income (both income income
sexes) (males) (females)
2006 2011 2016 2017 2018 2019
Source: Author calculations, Statistics Canada Labour Force Labour Income Profile of Tax Filers by Sex, Annual. Table 11-
10-0031-01.
6In the study by Statistics Canada, they point to the example of total work experience. The authors state that females
experience more work interruptions due to caregiving responsibilities, which they note is “an important component of
gender differences in annual or lifetime earnings and has been shown to partially account for differences in hourly
wages” (Pelletier et al 2019, 6).
26Setting the Course: Navigating the North Superior Workforce in 2022-2023
Figure 13 illustrates the share of the workforce in the NSWPB region in ten occupational
categories. The national occupational classification, or NOC for short, is a way to
categorize occupations based on the type of work involved. For example, a nurse falls
under the “Health” category. Any health occupation will start with the number “3” so a
nurse’s NOC is 3012. These codes are also associated with skill levels from 0 to D, with 0
usually tied to management levels positions. D level occupations do not typically
require higher education. A nurse would fall under skill level A, which usually calls for a
university degree (Government of Canada 2022). Understanding the codes and the
associated skill levels can help decision makers plan for current and future labour
market needs.
In the NSWPB region, 23.5 percent of the workforce is in sales and service-related
occupations, followed by trades, transport and equipment operators. When thinking
back to the consultation discussions and the displacement of workers in some
occupations, we may see a shift when new census data is released in 2022.
27You can also read