Skilling Tanzania: improving financing, governance and outputs of the skills development sector - Dr Antonio Andreoni1 - SOAS-ACE
←
→
Page content transcription
If your browser does not render page correctly, please read the page content below
Working Paper      006

                        Skilling Tanzania:
   improving financing, governance and
outputs of the skills development sector
                        Dr Antonio Andreoni1

                                          October 2018

                        1
                            SOAS, University of London
                             Email: aa155@soas.ac.uk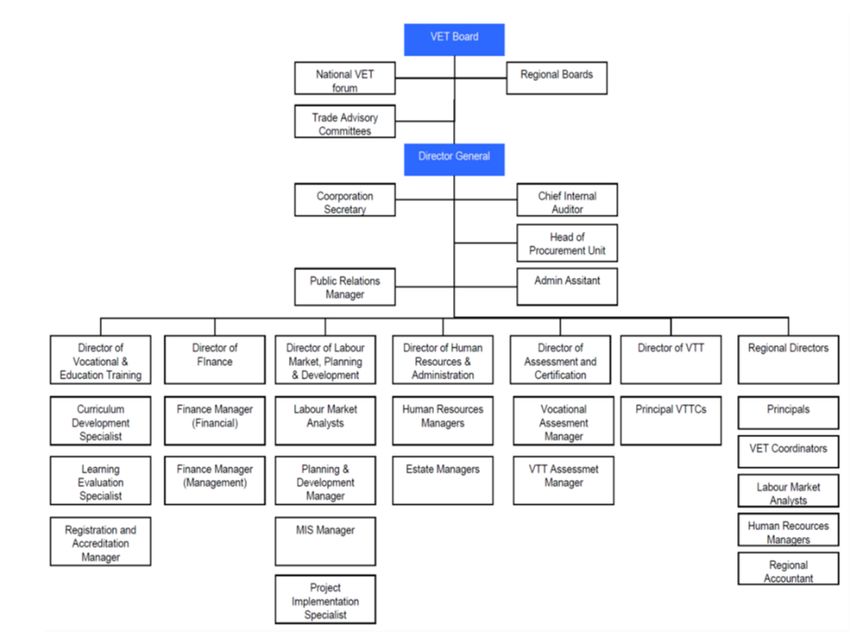
Skilling Tanzania: improving financing, governance and outputs of the skills development sector
Contents
Acknowledgments 4
Executive summary 5
List of Acronyms 7
1. Introduction 8
2. Background: industry and skill sets in Tanzania 10
2.1. Industry structure 10
2.2. Skill levels and employment rates 11
3. Tanzania’s vocational education and training (VET) sector: activities, outputs and
emerging models 15
3.1. Activities, capacity and outputs 16
3.2. Emerging VET models: private- and public-led partnerships 20
4. The Skills Development Levy (SDL): financing and governance of the skills sector 23
4.1. SDL regulatory framework and its recent development 23
4.2. SDL revenue and allocation: a quantitative assessment 25
4.3. SDL governance and accountability 30
4.4. VETA self-financing through short courses 35
5. Rent analysis of the SDL-based system and comparative country cases 37
5.1. Costs, competitiveness and employment disincentives 37
5.2. Trust, accountability and governance 43
6. Conclusion: re-aligning incentives and designing for differences 46
7. References 51
Figures
Figure 1: Structural heterogeneity in manufacturing in Tanzania (2013) 10
Figure 2: Labour force employment and inactivity trends 2007-2016 11
Figure 3: Workforce skill levels by type of firm (2012) 12
Figure 4: Type of skills needed in Tanzania (2017) 13
Figure 5: Total SDL revenue (2010-2017/18 (2Q), million TShs) 26
Figure 6: Shares of SDL contribution by employer type (2010-2017/18 (2Q), million TShs) 26
Figure 7: SDL allocation (2010-2017, million TShs) 30
Figure 8: VETA governance structure 31
Figure 9: VETA budgeting and accountability process 33
Figure 10: Utilisation of SDL funds by VETA to support SCs and LCs 35
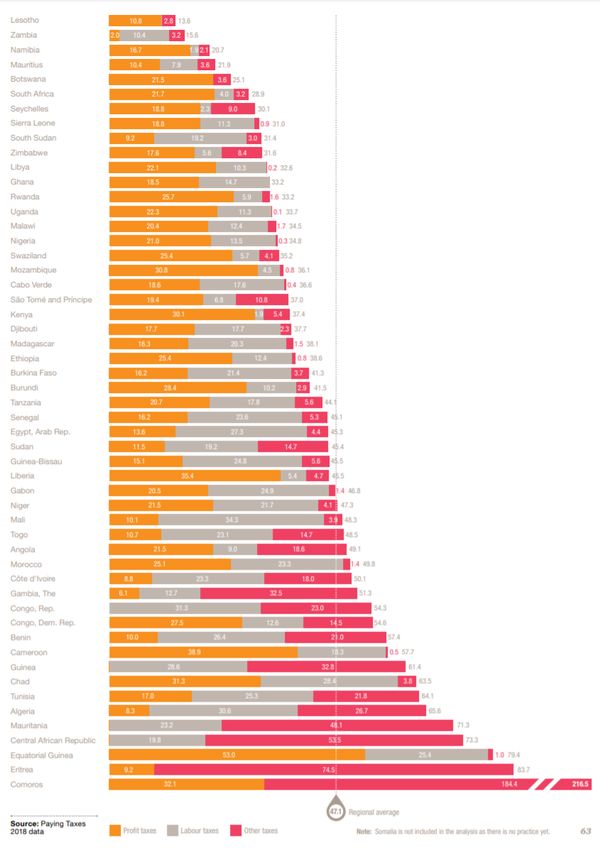
Figure 11: Total tax and contribution rate (%) in Africa 39
Figure 12: Tax revenue collection in Tanzania, composition and comparators 44
Figure 13: Governance and coordination of the National Skills Development Council 48
2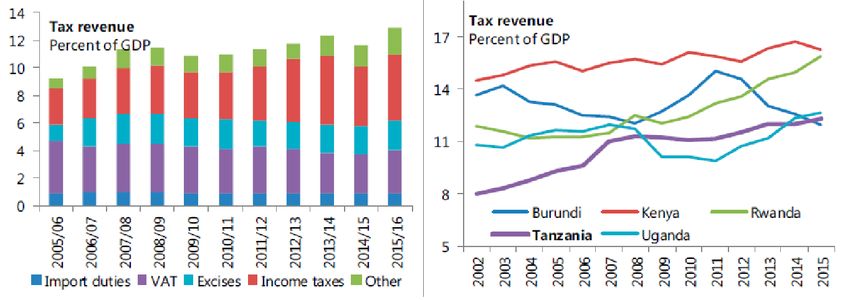
Skilling Tanzania: improving financing, governance and outputs of the skills development sector

Tables
Table 1: Number of VET centres and enrolment rates in Tanzania (2007-2015)                                    18
Table 2: Centre capacity and enrolment by centre ownership (2015)                                             19
Table 3: Employability of VET trainees and reasons for unemployment/inactivity (2010)                         19
Table 4: The significance of SDL across tax departments (million TShs)                                        27
Table 5: SDL revenue projections for mainland Tanzania and Zanzibar
(2017/18-2021/22, billion TShs)                                                                               27
Table 6: Estimates of SDL revenue at different SDL rates for mainland Tanzania
(2017/18-2021/22, billion TShs)                                                                               37
Table 7: Estimated cost reductions for employers in mainland Tanzania at different SDL rates
(2017/18-2021/22, billion TShs)                                                                               38
Table 8: Five-Year Development Plan total costings (billion TShs)                                             46

Boxes
Box 1: Kenya case study: The Industrial Training Levy                                                         40
Box 2: South Africa case study: Skills Development Levy                                                       41

                                                          3
Skilling Tanzania: improving financing, governance and outputs of the skills development sector

Acknowledgments
The author gratefully acknowledges the contributions and assistance provided by Zebadiah
Moshi, Sophie Van Huellen and Andrew Mahiga. The paper also benefited from discussions
and joint interviews with Cornelia Jesse, Gael Raballand and Joel Turkewitz (World Bank).

Special thanks go to all the institutions, organisations and private companies that provided
invaluable support in the data collection and analysis, in particular the Vocational Education
and Training Authority (VETA), the National Council for Technical Education (NACTE), the
Higher Education Students Loan Board (HESLB), the Tanzania Revenue Authority (TRA), the
Tanzania Private Sector Foundation (TPSF), the Association of Tanzanian Employers (ATE),
the Confederation of Tanzanian Industries (Cti), the CEO Roundtable, the Ministry of Labour
and the Tanzania Chamber of Mines. Final thanks go to a number of young Tanzanian
individuals enrolled in technical and vocation education who provided insider perspectives
on the skills development sector in Tanzania.

This paper is a background research report for a broader study on the skills development
sector in Tanzania. This study is conducted by the Anti-Corruption Evidence (ACE) research
consortium, with the direct involvement of REPOA in Tanzania, and aims to generate new
evidence for improving the financing, governance and outputs of the skills sector in
Tanzania. The broad study consists of an extended firm survey combined with a discrete
choice experiment aimed at comparing different packages of incentives and matching the
latter with firm characteristics. The final goal of the study is to assess the likelihood of
success of different policy reforms for different target groups.

                                                        4
Skilling Tanzania: improving financing, governance and outputs of the skills development sector
Executive summary
More skills, higher levels of skills, and different kinds of skills have to be developed and
effectively organised if countries are to be able to enhance their industrial competitiveness
and, as a result, improve their governance systems and the functioning of their institutions.
Despite several efforts to invest in the skills development sector in Tanzania over the last
decade, the sector has remained weak and presents a number of critical challenges for the
country. First, Tanzania needs to integrate and create employment for large groups of young
people every year, many of whom come from the poorest segments of society. Second, the
quality and type of skills developed in Tanzania do not meet the requirements of productive
organisations, while at the same time there are very few firms capable of organising and
deploying skills effectively. The third major challenge that Tanzania faces relates to the
financing and governance of the skills development sector.
In many countries in Southern and Eastern Africa, governments have relied on dedicated
levies to finance the skills development sector (the Skills Development Levy (SDL) in
Tanzania). The governance of these schemes is made particularly difficult by the fact that
private organisations hardly see the results of their financial contribution on the ground. In
some cases, this is because skills development takes time and is sector-specific, in other
cases it is because firms themselves do not develop the organisational capabilities needed
for them to be able to benefit from the improved skills. As a result – and despite the fact
that both governments and companies have a strong joint interest in developing skills –
more often the sector is affected by conflicting dynamics and allegations of resource
misallocations and tax avoidance.
In Tanzania, vocational education and training (VET) activities and services are run by around
520 providers and promoted under more than thirty programmes and public–private
partnership (PPP) schemes (e.g. Integrated Mining Technical Training (IMTT) in the mining
sector). The existing VET centres are extremely heterogenous with respect to their capacity
and training quality, but also with respect to the proportion of long and short courses they
are able to provide. VET providers include public VET centres, some of which are owned by
the VET Authority (VETA). The latter are funded through the SDL, which is set at 4.5% of
firms’ monthly payroll. The SDL in Tanzania is significantly higher than in Kenya and South
Africa and there are worries that this can create a competitive disadvantage and discourage
formal employment. Moreover, business organisations and associations have lamented the
fact that the levy is not used entirely for VET programmes, and that accountability of the
financing and allocation model needs improvements.
In order to ensure more constructive engagement between the public and private sector,
the transparency and accountability of the fund flows seem to be an important preliminary
condition. This implies: (i) a gradual move away from a centralised system where the SDL is
used to fund general government expenditures; (ii) a less ambiguous legal framework which
allows tracking of SDL collection and allocation; (iii) a more direct link between sectoral-level
collection and allocation, while guaranteeing that cross-sectoral needs are met; (iv)
increased voice and accountability in the curriculum and determination of whether existing
5Skilling Tanzania: improving financing, governance and outputs of the skills development sector
training models are fit for purpose. Reform opportunities also exist in terms of restructuring
incentives to take into account differences across sectors and firm types, as well as different
governance levels. Another important area for reform relates to the design and delivery of
skills training itself. There is a significant need for greater differentiation between skills
training to meet the needs of current employers, and skills training to enable trainees to
establish new economic activities (i.e. self-employment). Finally, promoting the involvement
of the private sector in on-the-job training through industrial placements, dual
apprenticeships and internships is critical to improve the overall supply of quality VET and a
skilled workforce. The introduction of rebate or grant models such as those adopted in South
Africa and Kenya could potentially improve the link between VETA and VET providers and
private companies.
6Skilling Tanzania: improving financing, governance and outputs of the skills development sector
List of Acronyms
2Q First two quarters of financial year
ATE Association of Tanzania Employers
CAGR Compound annual growth rate
CSO Civil society organisation
DAT Dual Apprenticeship Training
EAC East African Community
EEVT Enhancing Employability through Vocational Training
FBO Faith-based organisation
FYDP Five-Year Development Plan
HESLB Higher Education Students Loan Board
IGA Income generating activity
IMTT Integrated Mining Technical Training
INTEP Integrated Training for Entrepreneurship Promotion
LC Long course
MVA Manufacturing value addition
NACTE National Council for Technical Education
NGO Non-governmental organisation
NITA National Industrial Training Authority
NSDS National Skills Development Strategy
PAYE Pay As You Earn
PPP Public–private partnership
SARS South African Revenue Service
SC Short course
SDL Skills Development Levy
SEP Skills Enhancement Programme
SETA Sector Training and Education Authority
TCME Tanzanian Chamber of Minerals and Energy
TEA Tanzania Education Authority
TNBZ Tanzania National Business Council
TPSF Tanzania Private Sector Foundation
TRA Tanzania Revenue Authority
TShs Tanzanian Shillings
TVET Technical and vocational education and training
VET Vocational education and training
VETA Vocational Education and Training Authority
7Skilling Tanzania: improving financing, governance and outputs of the skills development sector
1. Introduction
The industrial competitiveness of countries depends on many factors; ‘ultimately perhaps
the most important single determinant is the level and improvement of workforce skills at all
levels’ (Lall, 1999: 2). More skills, higher levels of skills and different kinds of skills have to be
developed and effectively organised if countries are to be able to enhance their industrial
competitiveness and, as a result, improve their governance systems and the functioning of
their institutions. Indeed, all countries that have experienced sustained economic growth
and structural transformation have targeted and significantly invested in the development of
their skills sector.
The importance of skills development as a driver of structural transformation becomes
evident when we look at companies’ technological efforts at the shop-floor level. For firms,
the possibility of capturing new production opportunities in markets and introducing new
production technologies – machines, equipment and tools, or selecting alternative
technologies – critically depends on the domestic availability of relevant industrial skills and
their effective organisation and deployment in production and innovation (Penrose, 1959;
Lall, 2001; Toner, 2011; Andreoni, 2014).
Firms rely on workforce skills for absorbing and adapting technologies to local conditions,
and to innovate and ultimately increase productivity. Organisational capabilities are the
collective and managerial capacities that companies need to develop to make effective use
of workers’ improved skills. Organisational capabilities are also crucially important for the
development of new modes of production, from the simple re-arrangement of production
tasks up to the introduction of information technologies for process control, inventory
systems and quality management (Penrose, 1959; Amsden, 1989; Andreoni and Chang,
2017; Khan, 2017).
From a country-level perspective, the importance of skills for technological development is
just as clear as at the shop-floor level. Crucially, increasing skills changes the structural
trajectories of countries: they move from simple to difficult technologies, and within them,
from basic production functions (for simple components and assembly) to complex ones (for
improvement, design and innovation). Engaging in more complex production activities
generally leads to the creation and eventual capture of higher value, increased productivity
and generates spillover benefits to local input-supplying companies, within and across
industries (Chang, 2002; Cimoli et al., 2009; Andreoni, 2019, forthcoming).
In fact, the improvement of workforce skills is a core driver of structural transformation as
well as one of its main outcomes. Specifically, the development of organisational capabilities
and the expansion of technological processes within domestic and foreign companies create
new demand for higher-skilled workers as well as generating resources to improve the
education and vocational school system. Governments, in partnership with companies, have
a fundamental role to play here. By investing increasing tax revenues in the education
system and, in particular, in the vocational education and training (VET) system, they can
help drive the cumulative self-reinforcing process of skills development and structural
8Skilling Tanzania: improving financing, governance and outputs of the skills development sector
transformation (Noman et al., 2012; World Bank, 2012). Various forms of in-job training and
re-skilling are integral to the VET system as they allow for experience-based technical skills
development as well as for the transformation of formal education-based skills into
production capabilities.
This working paper provides an in-depth analysis of the financing and governance of skills
development in Tanzania, to inform the development of new strategies and, ultimately, to
improve sectoral outcomes. While the sector presents several governance and
accountability challenges, the paper aims to identify potential areas for improvement in the
financing, design and delivery of VETs. The findings of the study have informed the design of
an Anti-Corruption Evidence (ACE) discrete choice experiment that outlines different
packages of incentives which might be used to re-align interests in the sector and to design
new strategies that take account of company differences.
The feasibility of new strategies depends on policy-makers and practitioners having an in-
depth understanding of the different organisations and institutions involved in the sector, as
well as the flow of resources from collection to deployment and how these set up a specific
type of incentive structure. Therefore, after providing background information on the
composition of industry and skill sets in Tanzania (section 2) and introducing the VET system
(section 3), the paper presents new quantitative evidence and rent analyses of the Skills
Development Levy (SDL)-based VET model in Tanzania (sections 4 and 5). The paper
concludes by outlining a number of potential areas for strategic intervention (section 6).
9Skilling Tanzania: improving financing, governance and outputs of the skills development sector
2. Background: industry and skill sets
in Tanzania
2.1. Industry structure
The Tanzanian industrial sector is mainly composed of small establishments, accounting for
97.3% of a total of 49,243 establishments. There are only 1,322 large establishments with
more than 10 employees, of which 998 operate in the manufacturing sector. Disaggregated
analysis of 2013 firm census data for Tanzania (Andreoni, 2017b) reveals the high structural
heterogeneity of the country’s industrial sector, in particular the extreme differences in
industrial performance and capabilities across types of establishment. Tanzania’s production
system represents a dualist structure, with a high concentration of industrial activities in a
few industries (e.g. mining and quarrying, manufacturing, manufacturing of food products)
and regions (e.g. Morogoro and Dar es Salam), and a limited number of large- and major-
scale establishments. A vast group of micro- and small-scale firms remain largely excluded
from value-added processes, scaling-up opportunities and market access. Indeed, 80% of
manufacturing value addition (MVA) is generated by just 200 establishments employing at
least 100 employees, and the same group of companies accounts for 87% of the total value
exported. The limited number of medium-sized enterprises prevents any rebalancing of this
dualist structure.
Figure 1: Structural heterogeneity in manufacturing in Tanzania (2013)
MVA by industrial sector and major Total export by indusrial sectors and
manufacturing industries and by establishment size
establishment size
3,000,000 5,000,000
2,500,000 4,000,000
2,000,000
3,000,000
1,500,000
2,000,000
1,000,000
1,000,000
500,000
0 0
Manufacture of rubber and plastics products Manufacture of food products
Manufacture of other non-metallic mineral products Manufacture of tobacco products
Manufacturing
Manufacture of tobacco products
Mining and quarrying
Manufacture of beverages Total exports
Manufacture of food products Manufacture of rubber and plastics products
Manufacturing Manufacture of other non-metallic mineral products
Mining and Quarrying Manufacture of textiles
Source: Andreoni (2017a)
10Skilling Tanzania: improving financing, governance and outputs of the skills development sector
2.2. Skill levels and employment rates
In 2016 the total population of Tanzania was 51.1 million with an estimated working age
population of around 23.8 million (ILO KILM, 2016). The employment to population ratio in
Tanzania was 76% in 2016, slightly higher than the Eastern Africa ratio at 74%. On average,
across age groups, men are more actively engaged than women in the labour market (81%
against 71%). Young women between 15 and 24 years old are least engaged in the labour
market in Tanzania, at only 55%. A majority of people in employment are concentrated in
the agriculture sector (currently 67%, but 81% in 2001) followed by the service sector (27%,
with more than half in hotel and restaurants) and the industry sector (6.4%). Figure 2 shows
how the country’s total employment rate has been on a decreasing trajectory between 2007
and 2013. Since then it has followed the Eastern Africa average rate.
According to the LO/FTF Council Report 2016, based on ILO data, around 850,000 young
people enter the country’s job market annually, but only 50,000 to 60,000 formal-sector jobs
are created each year. With more than 66% of the population under age 25, this job
shortage poses a critical challenge to the economy and broader society. Moreover, given the
limited absorption capacity of the formal sector, underemployment and informal-sector
employment have been on a rising trend. Almost one out of five (22%) of the working-age
population and 35% of the youth population (15-24 years old) are inactive in the labour
market (Figure 2).
Figure 2: Labour force employment and inactivity trends 2007-2016
Source: LO/FTF Council (2016)
In 2012 a report by the United Nations Industrial Development Organization (MITI and
UNIDO, 2012) showed a dominance of low-skilled employees (53%) across small, medium
and large firms in Tanzania (Figure 3). Firms with an international market orientation had the
highest skilled workforce, with low-skilled workers at 40%, medium-skilled at 31% and high-
skilled at 28%. Extractive companies registered the highest proportion of medium-skilled
workers.
11Skilling Tanzania: improving financing, governance and outputs of the skills development sector
Figure 3: Workforce skill levels by type of firm (2012)
100%
11.6%
14.3%
14.4%
14.6%
15.2%
15.1%
15.2%
15.4%
15.5%
15.8%
16.3%
16.1%
16.1%
16.3%
16.4%
16.8%
17.3%
18.2%
18.5%
18.5%
90%
Skill levels of workforce by business group (%)
28.4%
80%
70%
26.4%
26.9%
26.9%
27.7%
28.6%
26.7%
26.9%
29.5%
28.9%
30.0%
35.4%
30.8%
32.0%
32.1%
33.1%
60%
33.1%
35.4%
35.4%
35.6%
41.1%
50%
31.4%
40%
30%
20%
10%
53.0%
52.4%
54.2%
44.5%
55.1%
53.2%
58.0%
45.1%
54.3%
58.6%
52.1%
50.7%
56.7%
49.8%
40.2%
53.0%
51.6%
54.2%
57.4%
58.2%
49.7%
0%
Foreign
Small (0-19)
Regional
Domestic
Medium (50-99)
Primary sector
LT
MHT
National-orientated
Small (20-49)
RB
Tertiary (+Util, Constr)
National
International
Large (100+)
Not involved
Regional-orientated
Somehow involved
Highly involved
Domestic-owned national-
orientated innovator
innovator
innovator
Overall Ownership Size Sector Market Innovation Selected
Orientation types
Low-skilled Medium-skilled High-Skilled
Source: Andreoni in MITI and UNIDO (2012)
The positive relationship between establishment size and the presence of skilled operative
workers is particularly pronounced in the manufacture of clothing, pharmaceutical products,
and the repair and installation of machinery and equipment. On the flip side, the ratio of
unskilled operatives is systematically higher among small and medium establishments and
decreases for larger ones. The lack of a large pool of companies with adequate technological
and organisational capabilities is a major demand constraint in the development of a skilled
workforce in Tanzania, and cases from other countries confirm this challenging reality (for an
example of skills development in the garment sector in Bangladesh, see Gereffi et al., 2011
and Khan, 2017).
According to the 2013 Census of Industrial Production (see Andreoni (2017b) for a
disaggregated analysis), in 2013 the industrial sector employed more unskilled operative
workers (55%) than skilled operative workers (45%). The study found that operative skilled
workers are largely concentrated in large establishments, especially in the mining and
quarrying industry (91%). There is a higher distribution of skilled workers among small and
medium establishments accounting for 30% and 11% of workers, respectively. This is
especially evident for small establishments involved in the manufacturing of clothing,
fabricated metal products (except machinery and equipment) and the furniture industry.
Operative unskilled workers are primarily concentrated in the food industry.
The ratio between operative skilled and operative unskilled workers in the total number of
employees for the different industries follows a consistent pattern. The operative skilled
12Skilling Tanzania: improving financing, governance and outputs of the skills development sector
ratio goes from 0.3 to 0.4 and 0.5, progressing, respectively, from small to medium and
finally to large establishments. The positive correlation between increased establishment
size and increased presence of operative skilled workers (in particular, in the progression
from medium to large establishments) is particularly strong in the manufacture of clothing,
pharmaceutical products, repair and installation of machinery and equipment and other
transport equipment. By contrast, the ratio of unskilled operatives is consistently higher
among small and medium establishments and decreases for large ones (from 0.8 to 0.3 for
mining and quarrying, and from 0.7 to 0.5 for manufacturing).
According to the LO/FTF Council Report 2016, based on ILO data, in Tanzania the skills
mismatch between labour supply and demand by educational attainment reached 28% in
2013 (with a noteworthy gap between men at 21% and women at 32%). However, the skills
mismatch between job requirements and qualifications was significantly higher and reached
40% in terms of incidence of under-education and 14% of over-education.
The most recent World Bank Economic Survey (2017) suggests that English and information
technology (IT) skills are the two specific types of skills that are lacking according to
employer assessments (Figure 4). Another type of skill set that has been widely reported as
lacking among the workforce in Tanzania is work ethics and loyalty to employers. Such ‘soft
skills’ have been identified in several interviews with the Association of Tanzania Employers
(ATE) and other private-sector organisations. Further investigations have revealed that
companies complain about lack of loyalty, especially with respect to the fact that workers
may leave a company for a better salary in another company/competitor. Companies feel
that they are thus not able to extract any value from any investments they make in terms of
VET for workers.
Figure 4: Type of skills needed in Tanzania (2017)
Source: World Bank Economic Survey (2017)
13Skilling Tanzania: improving financing, governance and outputs of the skills development sector
At lower skill levels lack of work ethics is also mentioned, but with reference to basic skills
and reliability of workers. Amongst this group, poor working conditions and salaries often
mean that even when workers have formal employment, they also often undertake several
other informal activities which implies that workers are not always reliable or fully
committed.
Among small and medium enterprises with limited foreign market exposure, references to
’soft skills’ are often made because employers themselves lack the organisational
capabilities to assess the specific types of skills that are required to reach certain products
and raise quality standards. This is one of the reasons why the World Bank Economic Survey
(2017) results do not appear to point to a skills crisis in Tanzania – on the contrary, in key
areas such as problem-solving and job-specific skills, a majority of firms reported that their
workers reach the required skill levels.
14Skilling Tanzania: improving financing, governance and outputs of the skills development sector
3. Tanzania’s vocational education
and training (VET) sector: activities,
outputs and emerging models
Despite several efforts to invest in the skills development sector in Tanzania over the last
decade, the sector has remained weak and presents a number of critical challenges for the
country (Tanzania Planning Commission, 2014; see Hong et al., 2016 for an analysis of the
impact of skills challenges on firms’ productivity).
First, as in other Southern and Eastern African countries, Tanzania needs to integrate and
create employment for large groups of young people every year, many of whom come from
the poorest segments of society. In this respect, VET schemes attempt to achieve a twofold
mandate of inclusiveness and skills development for productive organisations. While these
goals can go hand in hand, the limited financial resources may lead to trade-offs and impact
on the overall quality of VET. For example, VET programmes are affected by poor quality
primary education and the overall adverse environment in which young people operate.
The second challenge relates to the fact that the quality and type of skills developed in
Tanzania do not meet the requirements of productive organisations, while at the same time
there are very few firms capable of organising and deploying skills effectively. The existence
of skills gaps and mismatches has been widely documented in several developing countries
(Gereffi et al., 2011; ADEA, 2012; Ansu and Tan, 2012; Adams et al., 2013; AfDB and BMGF,
2015; Fox and Kaul, 2017). Less emphasis has been given to the fact that a lack of
competitive productive organisations can hamper the development of experience-based
technical skills, which is particularly the case in Tanzania, given its small productive sector
and the productivity challenges that the country faces (Andreoni, 2017b; Cti, 2018).
The third challenge that Tanzania faces relates to the financing and governance of the skills
development sector. Countries around the world have designed and deployed different
funding mechanisms for financing VET (for a review see Ziderman, 2016). In many countries in
Southern and Eastern Africa (including Tanzania, Kenya and South Africa), governments have
relied on dedicated levies to finance the skills development sector. The governance of these
schemes is made particularly difficult by the fact that private organisations hardly see the
results of their financial contribution on the ground. In some cases, this is because skills
development takes time and is sector-specific, in other cases it is because firms themselves do
not develop the organisational capabilities needed for them to be able to benefit from the
improved skills (see Higuchi et al., 2017 for an experiment on the impacts of management
training in Tanzania). As a result – and despite the fact that both governments and companies
have a strong joint interest in developing skills – more often the sector is affected by
conflicting dynamics and allegations of resource misallocations and tax avoidance. This is
particularly the case in Tanzania, as demonstrated by the continuous conflicting claims around
the Skills Development Levy (SDL) over the last decade (ATE, 2011; interviews in 2018 with Cti,
the Tanzania Private Sector Foundation (TPSF) and the CEO Roundtable).
15Skilling Tanzania: improving financing, governance and outputs of the skills development sector
3.1. Activities, capacity and outputs
In Tanzania, VET activities and services are run by around 520 providers and promoted under
more than 30 programmes operated by international organisations and partners (e.g. the
Employment and Skills for Eastern Africa programme (E4D) and Skills for Oil and Gas Africa
(SOGA)). VET providers include public VET centres (some owned by the VET Authority
(VETA), others by the central and local government), private VET centres, civil society
organisations (CSOs) and non-governmental organisations (NGOs), faith-based organisations
(FBOs) and private companies in the industrial sector.
VETA is both a provider of VET activities/services with its own 28 VET centres across all
regions of the mainland of Tanzania, as well as the regulatory body for the entire skills
sector. The National Council for Technical Education (NACTE) is the authority responsible for
regulating technical education in Tanzania,1 but unlike VETA, it does not provide any
technical education and training activities/services directly.
VET activities in Tanzania can be clustered into five main groups. The first four schemes are
formalised under VETA, while the final scheme is less formal and is work-based.
(a) Institutional-based VET activities:
VET activities are conducted in a VETA-owned VET centre or a registered, privately owned
VET centre. VET centres are supposed to be endowed with all the necessary facilities to
provide training, including classrooms and workshops fitted with basic practical training
equipment/machinery. The duration of VET is determined by the content of the curriculum
and ranges between one and three years for ‘long courses’ (LCs) and from three to nine
months for ‘short courses’ (SCs). During the training, trainees are scheduled to undergo
practical training sessions (‘field attachment’) in an industry for a period ranging between
four and eight weeks for the whole duration of long course training. Graduates receive a
formal certification from VETA following completion of their training.
(b) Skills Enhancement Programme (SEP):
The SEP scheme is meant to update and/or upgrade the skills of existing employees with a
view to upskilling individuals in the face of technical change. VETA collaborates with private
companies in identifying skills needs/gaps and designs the curriculum. VETA also delivers
trainings using both internal instructors or experts and those from other institutions or
companies. The cost of the training is equally shared between the company and VETA
(although contributions from VETA are often in the form of curriculum design). Graduates
receive formal certification from VETA.
1
NACTE was formed in 1997 as an autonomous public agency under the Ministry of Education (NACTE Act No. 9, 1997;
Amended in 2012).
16Skilling Tanzania: improving financing, governance and outputs of the skills development sector
(c) Dual Apprenticeship Training (DAT, pilot phase run by VETA):
DAT is an LC scheme (running 52 weeks per year for three years) which involves both VET
centres and specific industries providing structured training on an alternate basis (according
to a ‘block release system’ model). The industry is supposed to provide well-trained
supervisors who oversee on-the-job training, while VET centres are expected to complement
this training with theory and additional hands-on training. Currently, the DAT scheme is in a
pilot phase in VETA and covers the three sub-sectors of hospitality, electrical and motor-
vehicle mechanics. It is under the sponsorship of the German government through the
Hamburg Chamber of Skilled Craft.
(d) Integrated Training for Entrepreneurship Promotion (INTEP):
INTEP is an employment-oriented VET scheme focusing on unemployed people or people
working in the informal sector (micro/small enterprises) in both rural and urban areas. It
aims to improve employability and self-employment.
(e) Informal apprenticeships:2
In addition to the DAT scheme, there is also informal apprenticeship training where training
is work-based and there is no structured curriculum. Supervisors have experience in their
activities, but have limited pedagogical knowledge. No formal certification is issued to
graduates, however the majority of apprentices become employed/absorbed within the
organisation or enterprise where they have been trained. Such apprenticeships are common
practice in both the informal sector and in some industries.
The number of VETA-owned and private VET centres has fluctuated dramatically over the
last ten years and, with that, the overall VET enrolment capacity has varied too (see Table 1).
In 2009 there were 672 VET centres in Tanzania (of which 21 were VETA-owned), which
increased to over 1,000 in 2010. As a result of revisions to the licenses granted to private
VET providers, the total number of VET centres went down to 750 in 2011. Since then, the
total number of centres (especially privately owned ones) has increased up to 2015 to reach
almost 900 centres. In the following two years (2016-17), the numbers have started to
decline again and have stabilised at around 550 VET centres in total, 28 of which are VETA-
owned (VETA data and interviews).
Since 2000, the growing number of students enrolled in VET programmes has been driven by
the substantive increase in the number of students completing primary and lower secondary
education. In fact, most entrants to VET programmes are Form 4 graduates rather than
primary school leavers (B.E.S.T. various years, VET Data Handbook). According to VETA
(2018) (See Table 1), the total number of enrolled students in VET programmes has doubled
2
VETA also piloted a Recognition of Prior Learning (RPL) scheme to promote apprenticeship in the informal sector by
undertaking assessment and recognition of skills acquired informally at a workplace. Informal apprentices’ skills are
assessed, and targeted programmes are provided to fill the gaps towards examination and certification. During the pilot
period, 570 apprentices were identified, 487 were evaluated and 400 passed their examinations and received certification
(VETA, 2018).
17Skilling Tanzania: improving financing, governance and outputs of the skills development sector
from 2007 to 2015, reaching around 196,000 students in 2015 (together, SEP and INTEP
accounted for around 17,000 enrolled students in 2015). Almost one third of total enrolled
students are trained in public VET centres, including those owned by VETA. In 2015, VETA
reported that the average yearly drop-out rate was 8% over 2007-2015.
Table 1: Number of VET centres and enrolment rates in Tanzania (2007-2015)
Year Number of centres Enrolment Total
Public (incl. VETA) Private enrolment
Public Private Total M F Total M F Total M F Total
2007 49153 46613 95766
2008 36152 29646 65798
2009 40304 32634 72938
2010 52666 52154 104840
2011 109 641 750 64,449 56849 121348
2012 173 586 759 21811 15173 36984 63436 45091 108527 85247 60264 145511
2013 179 670 849 37986 12022 50008 54849 49496 104345 102559 61518 164077
2014 189 705 894 44573 14650 59223 64573 65891 130464 109146 80541 189687
2015 189 709 898 55595 15349 70944 65147 60000 125147 120742 75349 196091
Average 165 588 753 33309 12336 45646 54217 52110 106326 89147 64446 153592
Source: VETA (2018)
Note: Enrolment includes both LCs and SCs.
According to VETA (2018), in 2015 the VET centres in Tanzania had a total enrolment
capacity of around 190,000 students (see Table 2). More than half of students were enrolled
in VET programmes offered by privately owned centres (57,268) and VETA-owned centres
(54,000) combined. While the total number of enrolled students (196,091) was slightly
above the total VET capacity, utilisation capacity varied greatly among the different types of
VET institutions. VETA-owned centres operated significantly above their capacity at 126%,
alongside private VET centres (129%), CSOs (128%) and local government centres (120%). In
contrast, central government and FBOs were operating far below their capacity (42% and
78% respectively). According to VETA internal audits (personal interview), when
underutilisation was reported, this was due to lack of machineries, tools and materials.
The existing VET centres are extremely heterogenous with respect to their capacity and
training quality, but also with respect to the proportion of LCs and SCs they are able to
provide. Overall, 64% of reported VET capacity is for SCs rather than LCs. The former are not
only shorter in time, but also tend to have different offerings in terms of accommodation
and access to facilities.
In 2015 the Government of Tanzania set ambitious targets for the end of the Five-Year
Development Plan (FYDP 2020/21) of 700,000 VET graduates by 2020/21 (and one million by
2025/26), and an expected proportion of the working population with mid-level skills of
33.7% (and high-level skills of 12.1%). According to VETA (Table 2 and personal interviews)
the achievement of these ambitious goals will require a significant scaling up in the capacity
of existing VET centres in the country.
18Skilling Tanzania: improving financing, governance and outputs of the skills development sector
Table 2: Centre capacity and enrolment by centre ownership (2015)
Ownership of VET CAPACITY ENROLMENT %
institution Capacity Capacity Total Enrolment % Capacity
(LCs) (SCs) capacity Male Female Total in VET utilisation
Central government 11,507 16,806 28,313 8,279 3,565 11,844 6% 42%
CSO 4,264 3,127 7,391 5,217 4,218 9,435 5% 128%
FBO 16,387 9,074 25,461 11,078 8,876 19,954 10% 78%
Local government 2,419 1,122 3,541 2,497 1,754 4,251 2% 120%
Private company 9,192 20,544 29,736 19,222 19,268 38,490 20% 129%
Private individual 14,547 37,631 52,178 29,630 27,638 57,268 29% 110%
VETA 10,463 32,982 43,445 44,819 10,030 54,849 28% 126%
Grand total 68,779 121,286 190,065 120,742 75,349 196,091 100% 103%
Percent 36% 64% 100% 64% 40% 103%
Source: VETA (2018)
Note: Percentage capacity utilisation is the ratio of enrolment against capacity of VET institution.
VETA conducts labour market surveys every year and tracer studies every five years to make
sure that the skills provided as part of VET training address existing and future demand from
employers. The VETA tracer study conducted in 2010 involving 18- to 29-year-olds suggested
that as many as 66% of VET graduates were employed (Table 3) (VETA, 2010). Agriculture
and food processing, construction, and clothing and textiles emerged as the sectors with the
highest employment rates (above 90%). In terms of employment type, 43% of the employed
VET graduates had paid employment in 2010, 50% were self-employed and 7% were
employed without renumeration. These results confirm the twin goals of VET in Tanzania of
skills development and inclusiveness, as well as the limited absorption capacity in the formal
private sector (Moshi, 2014).
Table 3: Employability of VET trainees and reasons for unemployment/inactivity (2010)
Gender Employment type
Employment status Male Female Total Self-employed Paid employment Employed without pay
Employed 67.4% 63.5% 66.1% 50% 43% 7%
Unemployed 22.1% 27.4% 23.9% Reasons for unemployment or Male Female Total
inactivity
No demand for the trained skill 19.2% 13.7% 15.8%
area/trade/course
Not receiving expected 5.4% 2.7% 4.3%
salary/wages
Lack of resources to start self- 22.3% 32.1% 26.3%
Inactive 10.5% 9.1% 10.0% employment and confidence
Health reasons 0.5% 2.7% 1.4%
Attending training to fill 47.5% 33.6% 41.8%
gaps/upgrading
Housework 2.5% 11.8% 6.3%
Other external factors, including 2.6% 3.3% 2.9%
seasonality
Total 100% 100% 100%
Total 100% 100% 100%
Source: Author based on VETA (2010)
19Skilling Tanzania: improving financing, governance and outputs of the skills development sector
The proportion of VET graduates who reported being unemployed or inactive in 2010 was
23.9% and 10% respectively. Unemployment rates were notably higher among female
graduates than males and reached 27.4%. If we exclude the students who were still
attending training to fill skills gaps at the time of the tracer study (41.8%, of which 47.5%
males and 33.6% females), the two key reasons for unemployment/inactivity of VET
graduates were: lack of resources to start a business (26.3%) and no demand for the trained
skills (15.8%). Women seem to possess trained skills that are in relatively higher demand
than men (13.7% of females’ skills weren’t in demand compared to 19.2% of males’ skills).
Given that male enrolment in VET programmes is higher overall (see Table 1 and 2), this
proportion of men reporting no demand for their skills is highly problematic.
3.2. Emerging VET models: private- and public-led
partnerships
Over the last decade there have been several public–private partnership (PPP) initiatives in
Tanzania to promote skills development and bridge the gap between public providers and
industry. The first private-led PPPs have been implemented across the three VETA centres in
Moshi (Integrated Mining Technical Training – IMTT project), Lindi and Mtwara (Enhancing
Employability through Vocational Training– EEVT project), and Mtwara (Petrobras
programme). The IMTT project is the oldest and perhaps the most established initiative.
More recently, the government has also launched two new DAT and National Internship
schemes to be promoted by the Ministry of Labour under a new public-led PPP.
Private-led PPPs: the Moshi Centre
IMTT started in 2009 under the lead of the Tanzanian Chamber of Minerals and Energy
(TCME) in partnership with its members – African Barrick Gold and Anglo Gold Ashanti
initially, later joined by another six sponsors3 – and the VETA Moshi campus. A
Memorandum of Understanding (MOU) was signed between TCME and VETA to guide the
project through the different phases of planning and implementation through to monitoring,
evaluation and sustainability. TCME member companies made US$2.4 million available
towards project implementation with a focus on: a) converting/refurbishing some of the
existing VETA facilities; b) building a completely new training workshop and several
classrooms; c) retooling/upgrading of the existing welding, electrical and motor vehicle
mechanic workshops; d) training of trainees (six sent to South Africa to upgrade their skills
by attending three-month tailormade ‘Train the Trainer’ programmes); e) exposing trainers
to higher training standards by undergoing staff development at mines; f) recruiting a
project manager from an overseas partner organisation to oversee implementation of the
programme; and g) guaranteed maintenance of equipment by TCME.
The IMTT initiative started in response to the shortage of skills required by the highly
technical mining operations in Tanzania and the increasing salaries that qualified miners were
3
These are: Sandvik Mining, Kabanga Nickel, Pan African Mining Services, Shanta Mining, Mantra Resources (Uranium One)
and Atlas Copco.
20Skilling Tanzania: improving financing, governance and outputs of the skills development sector
managing to secure with the opening up of new mines. The programme provides a three-year
training course for students who have successfully passed lower secondary school as a
minimum. After a generic four-month skills course in the use of hand and measuring tools,
basic machine and drawing, students start on a continuous rotation between theoretical,
practical and on-the-job training, which continues until they qualify at the end of the third
year. Successful students receive a NACTE level four certificate at the end of the course in
their area of specialisation. Five areas are offered: electrical, fitting/fitter mechanics,
welding/plater welding, diesel mechanics/heavy moving equipment, and auto electrical.
TCME manages implementation of the programme and student scholarships. Companies
provide scholarships of US$1,500 for each student, of which US$600 is transferred to VETA
Moshi to cover full board and a small salary. The remaining resources are retained by TCME
to maintain and upgrade training equipment, to train trainers and to provide training
incentives. For 2013, the Voluntary Service Overseas (VSO) reported estimated costs of
US$2,500 per student for the IMTT three-year programme, which targets four occupations.
Annual enrolments were reported at 100 students per year (300 at any one time across the
three-year course), with 90% (140) of graduates in employment with sponsor companies as
at July 2013. Since then, the programme has increased its student enrolment numbers to
200 annually, and many graduates are in high demand in other sectors as well (IMTT, 2017).
Alongside these outcomes, the IMTT has reached a high level of efficiency by combining
targeted investment with a radical reform of its curriculum to deliver a huge increase in
capacity within its existing infrastructure. In 2013, the programme occupied 20% of the
physical footprint of the VETA Moshi Centre, and employed approximately 20% of its
teachers, but trained at least half of the total students on the site (VSO, 2014).
Several factors have contributed to the success of the IMTT initiative, including pre-
assessment students; the quality of trainers; efficient use of facilities, tools and rotational
system; and on-the-job experience provided by the various companies with high operational
and technical standards and organisational capabilities. The latter is perhaps the most
important factor and suggests the need to rethink the curriculum offered by VET centres for
LCs. The IMTT initiative demonstrates that even for medium-/high-level technical skills,
three years of mainly theoretical education is too much and ineffective, while more practical
training and industry exposure can increase trainees’ readiness and employability (ibid.). The
shortening of courses could also increase VETA capacity and potentially increase the number
of enrolled students.
3.2.1. Public-led PPPs: national apprenticeships and internship programmes
Over the last two years, the Prime Minister’s Office for Labour, Youth, Employment and
Persons with Disability has been assigned a share of the SDL to pilot two new national
apprenticeship and internship programmes. These pilots are supposed to be part of a five-
year skills development programme organised around three main activities:
21Skilling Tanzania: improving financing, governance and outputs of the skills development sector
(a) National apprenticeship (guidelines published in September 2017)
A scheme for the tourist industry already involves 200 employees and consists of 40%
formal training and 60% training in hotels
(b) National internship (guidelines published in September 2017)
Only for graduates
Interns receive a monthly salary of 300,000 Tanzanian Shillings (TShs): the money is
transferred directly to a personal bank account that they have to open when they begin
the scheme. Companies hosting interns sometimes top up this amount.
The Ministry of Labour approached the Association of Tanzanian Employers (ATE) and
the TPSF to identify possible companies willing to host interns but they found significant
resistance and diffidence (companies fear this is a way to add new taxes/levies and are
concerned about facing additional costs in hosting interns).
(c) Recognition of Prior Learning (RPL) (no guidelines produced so far)
The Ministry of Labour agreed with some private companies about the possibility of
obtaining a rebate if they want to invest in upskilling some of their worker.
The Skills Development Programme is run by a Steering Committee including: ATE, the Trade
Union Congress of Tanzania, TPSF, the Ministry of Finance, the Ministry of Industry, the
Tanzania National Business Council (TNBC), VETA and NACTE. The Department of
Employment hosts the programme and has a small Skills Development Unit of three people
to run the programme (at least during the two-year pilot phase, after which the programme
will be evaluated at the end of 2018). The Tanzania Employment Services Agency (TAESA) is
expected to implement some of these new programmes after the pilot phase. The first
pilots have focused on the leather sector and hotels in Arusha.
22Skilling Tanzania: improving financing, governance and outputs of the skills development sector
4. The Skills Development Levy (SDL):
financing and governance of the skills
sector
4.1. SDL regulatory framework and its recent development
The SDL is a levy collected by the Tanzania Revenue Authority (TRA) under the VET Act and
Income Tax Act to promote skills development in Tanzania.4
According to the VET Act (Revised edition 2006; Section 14, Act No. 14 of 2001), ‘the SDL is
charged based on the gross pay of all payments made by the employer to the employees
employed by such employer in the particular time. Where in any case an employer pays
emoluments to any employee at intervals of less than a month or at intervals of greater than
a month, such payments shall apply as if such employee was entitled to monthly payments
and the monthly chargeable emoluments of such employee in respect of any month shall be
deemed to be the chargeable emoluments that would have accrued to the employee had
the emoluments been payable monthly. The gross emoluments is the sum of amount from
salaries, wages, payments in lieu of leave, fees, commissions, bonuses, gratuity, any
subsistence travelling, entertainment or other allowance received by employee in respect of
employment or service rendered.’
Since the fiscal year 2016-17 (Finance Act 2016, Part XVI), the SDL rate has been charged at
4.5% of the total emoluments paid to all employees during the month. An ‘employee’ is
considered to be permanent employees, part-time employees, secondary employees and
casual laborers, etc. The SDL has to be deducted for the purpose of ascertaining the taxable
income in accordance with the Income Tax Act (section 11).
The SDL must be paid by any employer who employs four or more individuals on or before
the seventh day of the month following the month of payroll. The employer must calculate
the levy and pay this amount to the Commissioner’s account according to the tax region in
which the employer is registered.5 The employer is also expected to prepare and remit half-
year certificates which tally with the monthly returns submitted during that period.
4
In the 1995 VET Act the SDL was named the VET Levy. The levy was renamed the SDL in Act No.14 of 2001.
5
SDL payments should be made using form ITX 300.01.E - Employment Taxes Payment Credit Slip.
23Skilling Tanzania: improving financing, governance and outputs of the skills development sector
The SDL does not apply for the following institutions (see below references to exemptions
introduced in the Finance Acts 2014 and 2015):6
(a) government departments or public institutions that are wholly financed by the
government
(b) diplomatic missions
(c) the United Nations (UN) and its organisations
(d) international and other foreign institutions dealing with aid or technical assistance
(e) religious institutions whose employees are solely employed to (i) administer places of
worship; or (ii) give religious instructions or generally to administer religion
(f) charitable organisations7
(g) local government authority
(h) farm employers
(i) registered educational institutions (private schools including nurseries, primary and
secondary schools; VET schools; universities and higher learning institutions).
In response to significant lobbying from private companies and employers (see ATE Report,
2011), the Government of Tanzania has revised the SDL financing model. Some of these
changes were also triggered by the fact that other countries such as Kenya apply SDL at only
2% (see the Kenya case study in section 5.1). The changes mainly relate to the SDL rate,
while a number of provisions and exemptions are recognised in the regulatory framework.
In 2013, under the second Kikwete Presidency, the Finance Act amended sections 14 and 19
of the VET Act and reduced the SDL rate from 6% to 5%. Moreover, the SDL exemption
provision guaranteed to ‘any Government department and to any public institution which is
non-profit making and wholly financed by the Government’ was amended to include ‘any
Government department or public institution which is wholly finance by the Government’.
This first revision of SDL exemptions was followed by two other revisions in the following
two years. First, in 2014, the Finance Act extended the exemption from the SDL to
diplomatic missions, the UN and other international organisations, religious institutions,
charitable organisations and local government authority. Second, in 2015, the Finance Act
extended the exemption from the SDL to ‘farm employers whose employees are directly and
solely engaged in farming’ and made clear that this exemption ‘shall not include employees
who are engaged in the management of the farm or processing of farming products’.
Despite these reductions in the SDL rate and exemptions, between 2014 and 2015 the
Ministry of Labour introduced an Employee Compensation Fund, with contributions of 1%
from employers which effectively cancelled out the reduction in the SDL rate. Since this
6
Zanzibar is exempt from a-d and g.
7
Defined as ‘a resident entity of a public character registered as such and performs is functions solely for: (a) the relief of
poverty or distress of public; (b) provision of education or public health; and the Commissioner General is, upon due
diligence making, satisfied that the business conducted by such entity is for public good.’
24Skilling Tanzania: improving financing, governance and outputs of the skills development sector
time, public-sector employers in Tanzania have been required to contribute 0.5% to the
Fund while the private sector has been required to contribute 1%. This Employee
Compensation Fund levy applies to all employers and employees in Tanzania and employees
who ordinarily work outside Tanzania but who have been stationed in mainland Tanzania for
more than 12 months. Contributions for the Fund are determined on a calendar monthly
basis.
In 2016, the newly elected government approved a further reduction of the SDL rate from
5% to 4.5%, while the SDL base and exemptions remained unchanged (Finance Act 2016). In
the following year, however, the Finance Act 2017 introduced a new SDL exemption for the
registered education institutions listed in (i) above. In the 2017 Task Force for Tax Reform
Meeting, the Confederation of Tanzania Industries (Cti) proposed to reduce the SDL rate
further still to 4%, while ATE proposed to reduce it to 3.5%, closer to the Kenyan levy. The
government response was negative, and it was reported that a reduction of 0.5% would
have an impact of 30 billion TShs (personal interview with Cti and ATE).
4.2. SDL revenue and allocation: a quantitative assessment
According to the tax collection statistics provided by the TRA,8 the average total SDL
collected between 2010 and 2017 amounted to 191,490 million TShs per year, while for the
first two quarters (2Q) of 2017-18 it already amounted to142,418 million TShs suggesting a
significant upward trend. Since 2010, the amount collected as SDL has been growing at a
compound annual growth rate (CAGR) of 12.87%, registering significant peaks in 2014-15
(22% annual growth) and 2015-16 (17% annual growth). The SDL is reported under two main
departments: the Domestic Revenue Department (Direct Tax) and the Large Taxpayers
Department (Direct Tax). The latter was introduced in 2001 and includes around 475
companies with a threshold of 400 million TShs in revenue. 9
Figure 5 shows the total SDL revenue between fiscal years 2010-11 and 2017-18 (2Q), as well
as the annual growth registered in SDL collections. As previously discussed, the SDL went
through various revisions during this period, both with respect to the levy rate (decreasing)
and base (different employer exemptions). The figure also shows the SDL contributed by
small and medium employers (reported under domestic revenue direct tax) and that paid by
large employers (reported under large taxpayers direct tax). As discussed in section 2, given
the skewed industrial structure of the Tanzanian economy, large taxpayers contributed 66%
of all SDL collected in 2010.
8
The data is available quarterly from 1997-98 to 2017-18 (2Q). The analysis in this section can be expanded for 20 years.
9
See http://allafrica.com/stories/201801030440.html
25You can also read