THE STATE OF NATURAL RESOURCES REPORT (SONARR): ASSESSMENT OF THE SUSTAINABLE MANAGEMENT OF NATURAL RESOURCES. TECHNICAL REPORT. CHAPTER 3 ...
←
→
Page content transcription
If your browser does not render page correctly, please read the page content below
The State of Natural Resources
               Report (SoNaRR): Assessment
               of the Sustainable Management
               of Natural Resources.
               Technical Report.
               Chapter 3. Summary of extent,
               condition and trends of natural
               resources and ecosystems in
               Wales
               Natural Resources Wales

               Final Report
               Date

www.naturalresourceswales.gov.uk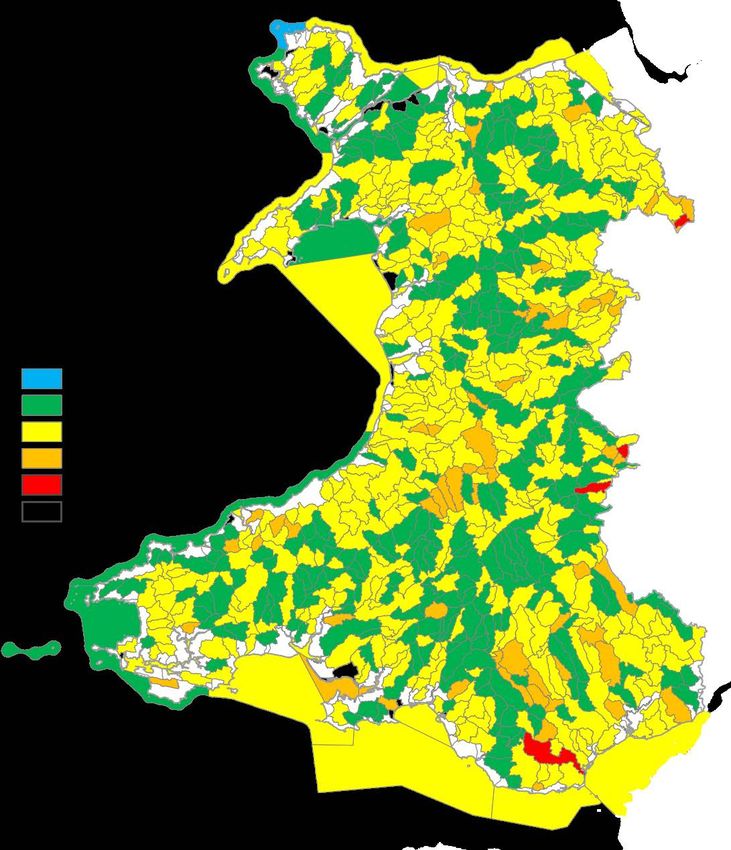
About Natural Resources Wales
   We look after Wales’ environment so that it can look after nature, people and the
   economy.

   Our air, land, water, wildlife, plants and soil – our natural resources - provide us with
   our basic needs, including food, energy, health and enjoyment.

   When cared for in the right way, they can help us to reduce flooding, improve air
   quality and provide materials for construction. They also provide a home for some
   rare and beautiful wildlife and iconic landscapes we can enjoy and which boost the
   economy.

   But they are coming under increasing pressure – from climate change, from a
   growing population and the need for energy production. We aim to find better
   solutions to these challenges and create a more successful, healthy and resilient
   Wales.

www.naturalresourceswales.gov.uk
Evidence at Natural Resources Wales
   Natural Resources Wales is an evidence based organisation. We seek to ensure that
   our strategy, decisions, operations and advice to Welsh Government and others are
   underpinned by sound and quality-assured evidence. We recognise that it is critically
   important to have a good understanding of our changing environment.

   We will realise this vision by:

   • Maintaining and developing the technical specialist skills of our staff;
   • Securing our data and information;
   • Having a well resourced proactive programme of evidence work;
   • Continuing to review and add to our evidence to ensure it is fit for the challenges
     facing us; and
   • Communicating our evidence in an open and transparent way.

                                                                                     Page 2
www.naturalresourceswales.gov.uk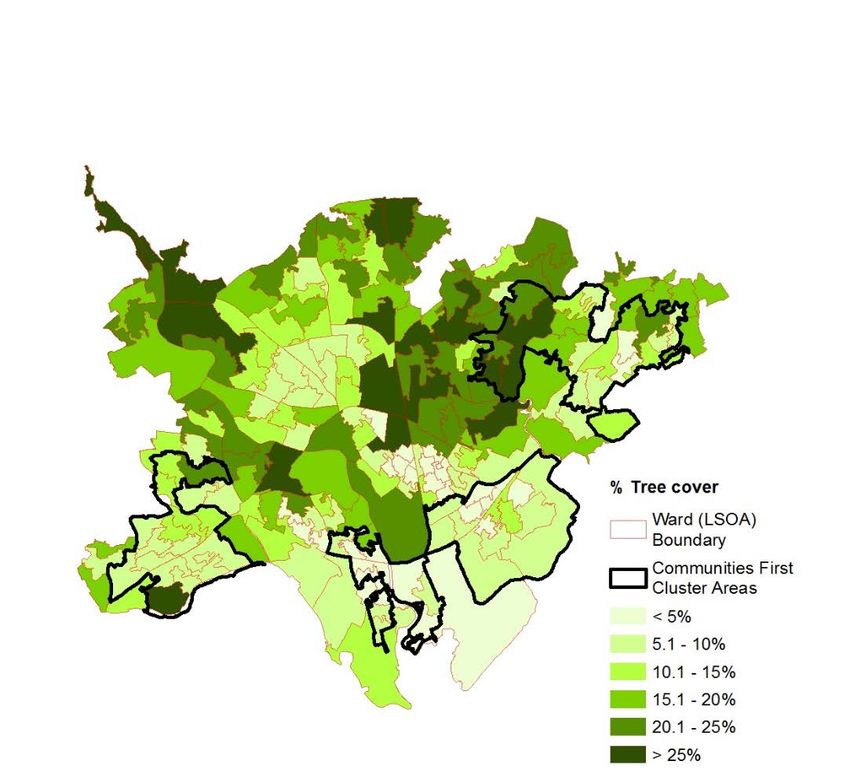
The State of Natural Resources Report (SoNaRR) Report Contents

   This document is one of eight chapters of the State of Natural Resources Report.

    Chapter 1          Introduction to the State of Natural Resources Report (SoNaRR):
                       An assessment of sustainable management of natural resources
    Chapter 2          Understanding drivers of change in natural resource use
    Chapter 3          Summary of extent, condition and trends of natural resources and
                       ecosystems in Wales
    Chapter 4          Resilient Ecosystems
    Chapter 5          Well-being in Wales
    Chapter 6          Identifying Unsustainable Management
    Chapter 7          Towards sustainable management of natural resources
    Chapter 8          Assessment of the sustainable management of natural resources
    Annex              Technical Annex for Chapter 3
    Annex              Technical Annex for Chapter 7 (Part 1)
    Annex              Technical Annex for Chapter 7 (Part 2)
    Annex              Method for assigning confidence to evidence presented
    Annex              Record of confidence assessments
    Annex              Acronyms and Glossary of terms

   All of the SoNaRR documents can be downloaded from the NRW website:
   www.naturalresources.wales/sonarr.

   Recommended citation for this report:

   Natural Resources Wales. 2016. State of Natural Resources Report (SoNaRR):
   Assessment of the Sustainable Management of Natural Resources. Technical
   Report. Natural Resources Wales.

   Copyrights

   All graphs, maps, tables and other images are © Natural Resources Wales unless
   otherwise stated.

   All maps containing the Wales boundary:
   © Crown Copyright and database right 2016. Ordnance Survey licence number
   100019741.

   All maps containing marine aspects:
   © British Crown and OceanWise Ltd, 2016. All rights reserved. License No. EK001-
   20120402. Not to be used for Navigation.

                                                                                    Page 3
www.naturalresourceswales.gov.uk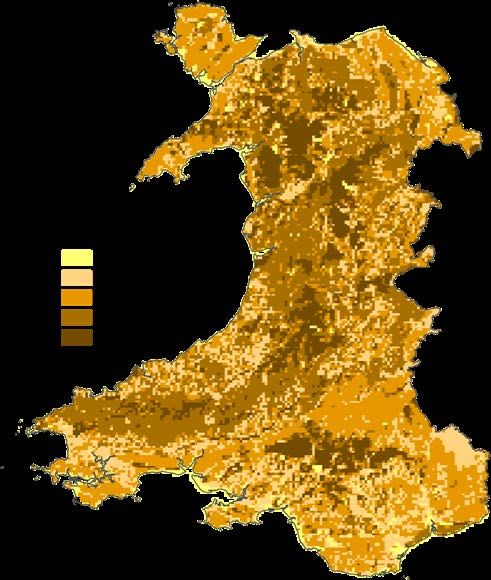
Contents

   3. Summary of Extent, Condition and Trends of Natural Resources and
   Ecosystems in Wales .................................................................................................. 8
      Introduction .............................................................................................................. 8
   PART A – NATURAL RESOURCES ......................................................................... 10
               Animals, Plants and other organisms ........................................................... 10
               Air Quality ..................................................................................................... 16
               Water resources and hydrological processes ............................................... 20
               Soils.............................................................................................................. 24
               Geodiversity, geological features and processes (including minerals) ......... 29
   PART B – WELSH ECOSYSTEMS ........................................................................... 32
      Overview ................................................................................................................ 32
      Habitats of principle importance ............................................................................. 34
      European and UK protected sites .......................................................................... 35
               Mountains, moors and heaths ...................................................................... 36
               Semi-natural grasslands ............................................................................... 41
      3.8. Enclosed farmland ........................................................................................ 44
               Woodland ..................................................................................................... 48
                  Freshwater ................................................................................................ 55
                  Urban Environments ................................................................................. 61
                  Coastal margins ........................................................................................ 65
                  Marine ....................................................................................................... 68
   PART C – PRESENTING INTEGRATED EVIDENCE AROUND PLACE .................. 78
                  Landscape information in Wales ............................................................... 78
                  Assessing extent, condition and trends at an area scale........................... 80
      References for Chapter 3 ....................................................................................... 82

                                                                                                                             Page 4
www.naturalresourceswales.gov.uk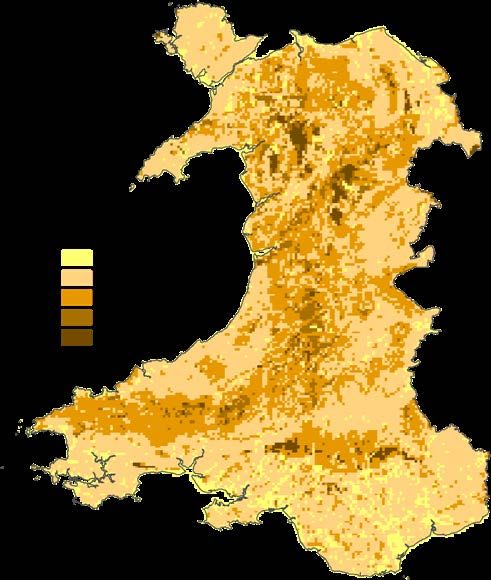
List of Figures
Figure 3.1 Overview of condition of Habitat and Bird Directive species features on
SACs and SPAs. Number of features in assessment shown in brackets. [H] .......... 12
Figure 3.2 Assessment of the state of some of the Welsh priority species at broad
taxonomic group level. [H] ....................................................................................... 13
Figure 3.3 Wales PM 10 emissions by source sector. [H] .......................................... 17
Figure 3.4 PM 2.5 concentrations in Wales. [H] ......................................................... 17
Figure 3.5 Nitrogen dioxide (NO 2 ) concentrations in Wales. [H] .............................. 17
Figure 3.6 Wales nitrogen oxides (NOx) emissions by source sector. [H] ............... 18
Figure 3.7 Number of days background ozone concentration was over target value in
2014. [M] .................................................................................................................. 18
Figure 3.8 Wales ammonia (NH 3 ) emissions by source sector. [H] ......................... 19
Figure 3.9 Water resource availability in Wales in 2014 (percentage of time), . [H] . 22
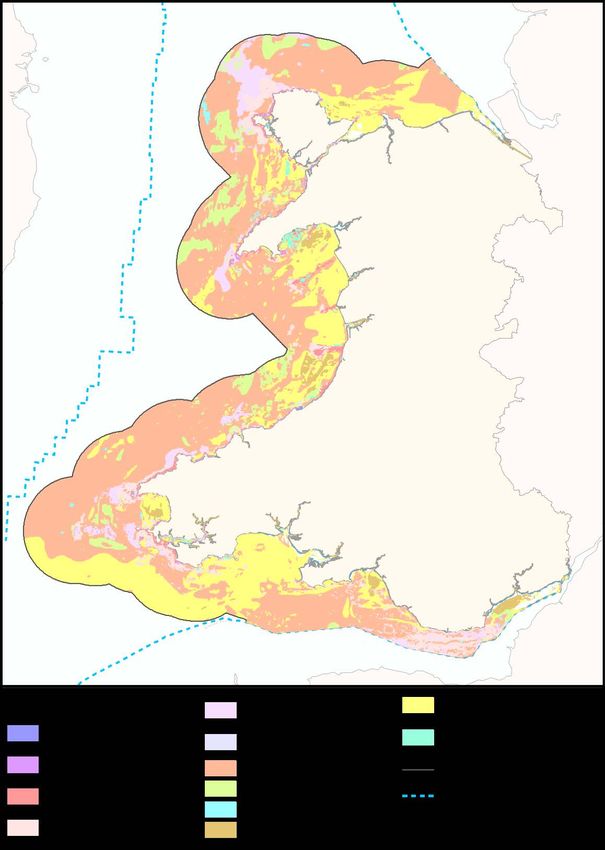
Figure 3.10 Map of peak spring tidal flow for Welsh waters reproduced from: Atlas of
UK Marine Renewable Energy Resources (2008). [H] ............................................. 23
Figure 3.11 Maps of wave height for Welsh waters reproduced from: Atlas of UK
Marine Renewable Energy Resources (2008). [H] ................................................... 23
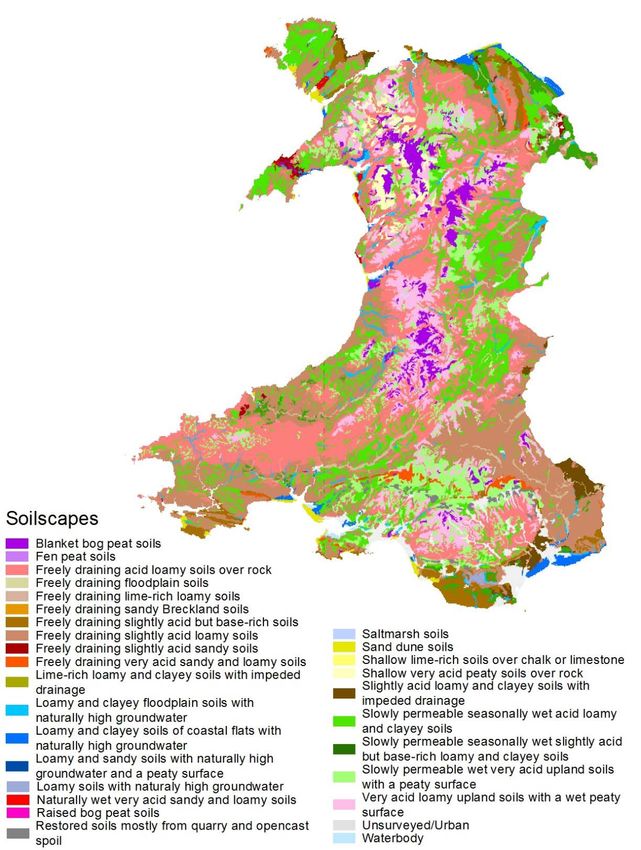
Figure 3.12 ‘Soilscapes’, the National Soil Map of Wales (UK Soil Observatory
(UKSO), 2016). [H]................................................................................................... 25
Figure 3.13 Distribution of soil carbon in Wales, shown as carbon density (t/ha): a)
depth 0-30 cm; b) depth 30-100 cm; c) depth 0-100 cm........................................... 26
Figure 3.14 Contaminated Land sites in Wales identified under the Part 2A regime of
the Environmental Protection Act 1990 (determinations reported by local authority).
[L] .......................................................................................................................... 27
Figure 3.15 Glastir Monitoring and Evaluation Programme (GMEP) data for topsoil:
(a) Long term trends in carbon concentration (1978 to 2013); (b) Long term trends in
topsoil pH; (c) Long term trends in topsoil phosphorus availability (Olsen-P); (d)
Trend in topsoil mesofauna abundance. Solid blue line = Countryside Survey data
(CS data); Dashed blue line = GMEP 2013 Wider Wales Survey. [M] ..................... 28
Figure 3.16 Welsh Geodiversity Sites [H]. ............................................................... 30
Figure 3.17 Potential unconventional gas resources in Wales. [H] .......................... 31
Figure 3.18 Summary of the representation of semi-natural habitats and modified
land-cover types in Wales [M]. ................................................................................. 32
Figure 3.19 Percentage of Special Area of Conservation (SAC) habitat features in
favourable and unfavourable condition. Number of habitat features in assessment
shown in brackets. [H].............................................................................................. 35
Figure 3.20 Breakdown of the component habitats of mountain, moorland and heath
in Wales. All numbers are in hectares (ha). [M] ....................................................... 37
Figure 3.21 Distribution map of (left) unimproved neutral grassland in Wales
compared with that of (right) improved grassland. The unimproved neutral grassland
includes only stands confirmed by thorough floristic survey (from Blackstock et al.
2010). ....................................................................................................................... 42
Page 5
www.naturalresourceswales.gov.uk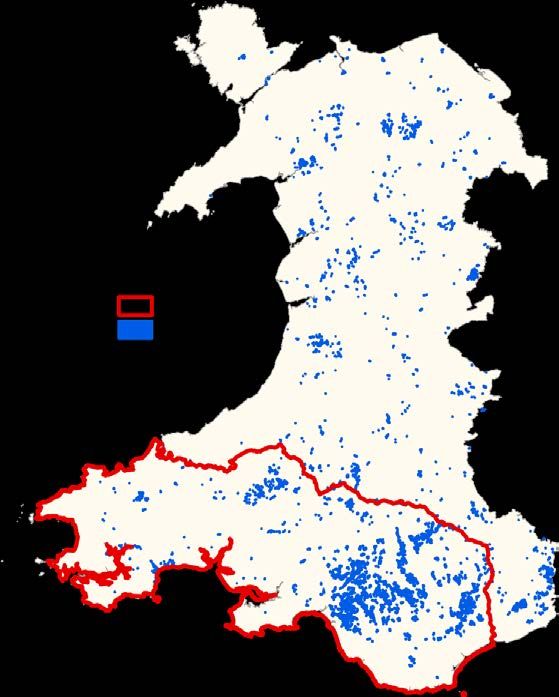
Figure 3.22 New planting in Wales (hectares, ha), by woodland type (broadleaves
   and conifers), 1971-2015. [H] .................................................................................. 51
   Figure 3.23 Distribution of Phytophthora ramorum in Wales in 2016. [H] ................ 52
   Figure 3.24 Modelled Suitability change in Sitka spruce and Sessile oak based on
   predicted climate change by 2080, based on UK Climate Change Projections 2002
   (UKCIP02) predictions (High scenario). [M] ............................................................. 53
   Figure 3.25 Water Framework Directive classification, overall status 2015: surface
   waters. [H] ................................................................................................................ 56
   Figure 3.26 Water Framework Directive classification, overall status 2015:
   groundwaters. [H]..................................................................................................... 57
   Figure 3.27 Water Framework Directive classification, element status, 2015: rivers.
   [H] .......................................................................................................................... 57
   Figure 3.28 Water Framework Directive classification, element status, 2015: lakes.
   [H] .......................................................................................................................... 58
   Figure 3.29 Hectares (ha) of accessible natural greenspace per 1,000 population by
   local authority (ha), July 2012. [M] ........................................................................... 62
   Figure 3.30 Distribution of land use classes across Wales’ urban areas (2013). [M] 62
   Figure 3.31 Distribution of tree canopy cover across Wales’ urban land use classes.
   [M] .......................................................................................................................... 63
   Figure 3.32 Cardiff ward by ward (Lower Super Output Area, LSOA) tree canopy
   cover distribution – Communities First Cluster Areas (most deprived areas in Cardiff)
   highlighted. [M] ........................................................................................................ 63
   Figure 3.33 Noise map for major roads, major railways and roads, railways and
   industry in agglomerations, 2012. [M] ...................................................................... 64
   Figure 3.34. Annex I SAC feature condition (% of total area ha) derived from Article
   17 reporting. Total hectares of each habitat in assessment shown in brackets. [H]. 67
   Figure 3.35 Water Framework Directive classifications for estuarine and coastal
   elements, 2015. [H] .................................................................................................. 70
   Figure 3.36 Percentage of designated bathing waters complying with the original
   Bathing Water Directive 1990 – 2014. [H] ................................................................ 70
   Figure 3.37 Bathing Water Directive classification 2015 (revised Directive). [H] ...... 71
   Figure 3.38 Marine (intertidal and subtidal) habitats listed under Annex I of the
   Habitats Directive. The 12 nautical mile limit of Welsh territorial waters is shown. [L-
   H] .......................................................................................................................... 73
   Figure 3.39 Broadscale subtidal habitats. The 12 nautical mile limit of Welsh
   territorial waters is shown. [L-H] .............................................................................. 76

   List of Tables
   Table 3.1 Mineral production for 2014 [H]. ............................................................... 30
   Table 3.2 What is included in each broad habitat..................................................... 33
   Table 3.3 Summary of the representation of mountain, moorland and heathland
   habitats within the SSSI series based on data up until 2010; data are rounded to the

                                                                                                                            Page 6
www.naturalresourceswales.gov.uk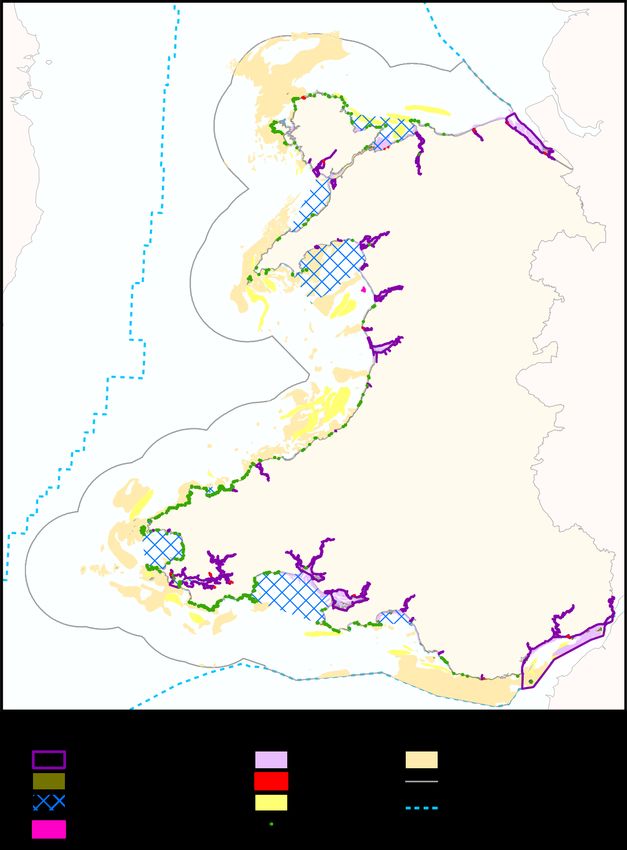
nearest 10 ha [M]. Data in the final column are based on Allen (2004) and in most
cases relate to a subset of the SSSI sites notified for each feature [L]. ................... 37
Table 3.4 Summary of the conservation status of Habitats and Species Directive
Annex I habitats associated with mountain, moorland and heath [H]. * Indicates
Habitats Directive priority status. Key: = stable; = decreasing less than 1% per
year; = decreasing more than 1% per year; = decreasing rate unknown; =
increasing; - = unknown. .......................................................................................... 38
Table 3.5 Extent of different semi-natural grasslands in Wales. Extent figures from
Blackstock et al (2010) except * Stevens et al (2010) and JNCC (2013). Note that
‘upland marshy grassland’ (29,204 ha) is included in the ‘mountain, moorland and
heath’ section. .......................................................................................................... 42
Table 3.6 Summary of lowland grassland SSSI feature condition assessments (from
Allen, 2004). * Includes calaminarian grassland. ...................................................... 43
Table 3.7 Recorded losses of semi-natural grasslands. ........................................... 43
Table 3.8 Classification of woodland in Wales, by type, including area in hectares
(ha). [H] .................................................................................................................... 49
Table 3.9 Forecast of timber availability in Wales (thousand m3 overbark standing –
000s m3 obs), 2017-2061. S = softwood, H = hardwood. [H] ................................... 52
Table 3.10 Summary of the representation of lowland terrestrial wetland habitats
within the SSSI series * in most cases relates to a subset of the SSSI sites notified
for each feature. ....................................................................................................... 58
Table 3.11 Status of Habitats Directive Annex I Freshwater Habitats in Wales Key:
= stable; = decreasing; = increasing; - = no information; greyed arrows = low. S
= short-term trend; L = long-term trend. ................................................................... 58
Table 3.12 Status of Habitats Directive Annex I Wetlands Habitats in Wales. Key:
= stable; = decreasing less than 1% per year; = decreasing more than 1% per
year; = decreasing rate unknown; = increasing; - = unknown. ......................... 59
Table 3.13 Short and long term trends in range and extent of Annex I coastal margin
habitats in Wales. All information from 2013 Article 17 reporting. Key: = stable;
= decreasing; = increasing; - = no information. [H]. * Vegetated Sea Cliffs of the
Atlantic to Baltic Coasts are composed of the following habitats; Coastal grassland,
Coastal heath and Vertical sea cliffs.1 Short term trend = in the last 12 years. 2 Long
term trend = in the last 24 years. .............................................................................. 65
List of Boxes
Box 1 How we chose the evidence and identified evidence gaps .............................. 9
Page 7
www.naturalresourceswales.gov.uk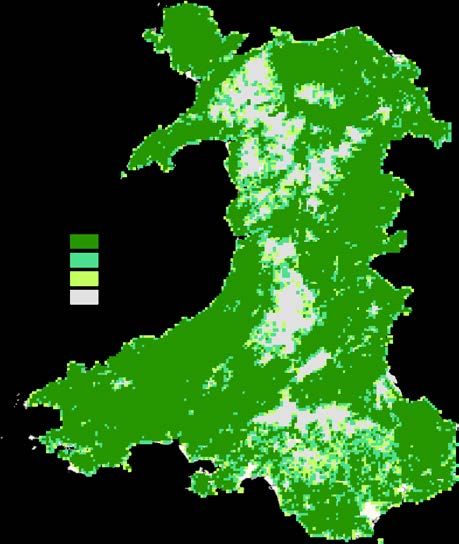
3. Summary of Extent, Condition and Trends of Natural
   Resources and Ecosystems in Wales
   Introduction

   In this Chapter we present a summary of the available evidence on the extent,
   condition and trends of natural resources and ecosystems in Wales. This is our
   assessment of biodiversity as required under section 6 of the Act.

   Part A presents a synthesis of the evidence we have analysed on the state of
   natural resources. This is presented as follows:

           1. Animals, plants and other organisms
           2. Air
           3. Water as a resource or hydrological system. Part B deals with freshwater
              and marine ecosystems
           4. Soil
           5. Geological features and processes
   Other climatic resources, such as flow resources (anything that replenishes itself
   without human intervention) and physiological features have not been separated out
   as they form part of all of the above.

   Part B presents a synthesis of the evidence we have analysed on the extent,
   condition and trends occurring within ecosystems or broad habitats. This is
   presented as follows:

           6. Mountains, moors and heaths (including upland marshy grassland,
               lowland heaths and fridd)
           7. Semi-natural grassland
           8. Enclosed Farmland (primarily intensively managed grasslands and arable,
               but also including orchards and field boundaries)
           9. Woodland (including semi-natural woodland and coniferous plantations);
           10. Freshwater (including groundwater, rivers and streams, lakes and standing
               water, and lowland fens and bogs)
           11. Urban environments (including previously developed land)
           12. Coastal margins (including saltmarsh, sand dunes and seacliffs)
           13. Marine (including coastal and estuarine, intertidal, inshore /subtidal)

   Table 3.2 in Part B explains what is included in each grouping, building on the NEA
   approach. Wherever possible we have tried to consider extent, condition and trends
   for each broad habitat and sub-habitats. We have also highlighted evidence gaps.
   Each section focuses on the key messages which have come out of a process of
   synthesising and analysing a broad spectrum of evidence. Evidence sources are
   presented as references as it is not possible to include all of the detail here. A
   technical Annex provides further information from which we have drawn out the key
   messages (See SoNaRR: Technical Annex for Chapter 3). Box 1 provides
   information about the methodology used in this chapter. The key messages and
   supporting evidence have a confidence level assigned to them – Low [L], Medium

                                                                                    Page 8
www.naturalresourceswales.gov.uk
[M] or High [H]. In some cases, L-H is used to show that confidence is variable
   (normally associated with maps using several different data sources). The full
   methodology used to assign confidence can be found in SoNaRR: Annex
   methodology for assigning confidence to evidence presented.

   Part C briefly explores ways in which evidence on the extent, condition and trends
   can be brought together in a place-based context. This part draws upon landscape
   information and evidence as well as the three natural resource ‘area trials’ that NRW
   ran between 2014 and 2016. This information begins to draw together the
   techniques that will be required to look at the interface between natural resources
   and human influences. In turn this can inform the development of area statements
   and the planning and management of land and sea at a national, regional and local
   scale.

    Box 1 How we chose the evidence and identified evidence gaps
    Method Statement
    This first SoNaRR was developed by NRW with input from NRW specialists and
    external experts. The methodology used to collate evidence follows the “Expert
    Consultation” methodology outlined in Tables 1 and 2 of Pullin et al. (2016) 1.
    Future SoNaRRs will draw on the other methodologies outlined by Pullin et al. to
    ensure the most appropriate methodology is adopted in the longer term.

    The specialists in NRW carried out a concise time-limited exercise to review the
    literature available and known to them based on their current knowledge as
    specialists. A full method statement for this exercise is provided in the Technical
    Annex for Chapter 3.

    The NRW specialists pulled out the main key messages that provided a good
    representation of the current extent, condition and trends of Wales’ natural
    resources based on the best available evidence. The key messages in this chapter
    are generally already well-known and widely published but part of the purpose of
    this exercise was to collate them to show the whole picture. Graphs, maps, tables
    and photographs were used where appropriate to illustrate the key messages.

    Baseline
    Chapter 3 is the evidence base of the state of Wales’ natural resources. It is
    recognised that whilst the key messages have associated references, it is not
    always clear to which year the evidence relates and therefore what the baseline is.
    We intend that future documents will show the specific date range of the evidence
    so wherever possible baselines are set and available for comparison.

    Evidence Gaps
    The evidence gaps highlighted in Chapter 3 are not a comprehensive list, are not
    all focussed at the same level, and do not necessarily reflect the priorities between
    subject areas. They are specific to the natural resources and broad habitats being
    discussed in the relevant section. In future, they will be reviewed, set out at similar
    levels and prioritised according to the outcomes of the National Natural Resources
    Policy (NNRP).

                                                                                       Page 9
www.naturalresourceswales.gov.uk
PART A – NATURAL RESOURCES
Animals, Plants and other organisms
(See section 3.1 of the Technical Annex for Chapter 3 for more information)
KEY MESSAGES
Extent:
• Wales has a wide representation of species across a broad range of
taxonomic groups with estimates varying from 25,000 to 50,000 different
species of animals, plants and other organisms 2, 3, 4 [H].
• There are 20 Special Protection Areas (SPAs) for internationally important
populations of birds and 92 Special Areas of Conservation (SACs) for other
threatened species and natural habitats 5.
• 562 of the total 1,016 Sites of Special Scientific Interest (SSSI) (as of 2010)
have individually qualifying species and 54 have species assemblages
which qualify 6. Many of the same species are also found on sites that
qualify for their habitat.
• The list of species and habitats of principal importance in Wales (the
interim Section 7 list) includes 557 species7.
Condition:
• The condition of SAC and SPA species features on sites in Wales, as
reported in 2013, remains mostly unfavourable (55%), with the exception of
birds and mammals of which 86% and 68% were in favourable condition,
respectively5 (Figure 3.1) [H].
• Between 2002 and 2008, fewer than half of the species on the interim
Section 7 list were considered to be stable or increasing 8 (Figure 3.2) [H].
• Wales (along with the UK as a whole) did not meet the 2010 international
and national biodiversity targets 9 [H].
Trend:
• Trends of extent and population for terrestrial, freshwater and marine
species vary enormously within taxonomic groups; with some species
increasing and some decreasing. For instance, both increases and
decreases can be seen in birds, bats and many pollinator species (e.g.
bees, butterflies) whilst for many species we do not have sufficient data on
which to base any conclusions8, 10, 11, 12, 13 [H].
• There has been a marked reduction in the abundance of salmon in recent
years, particularly in the southern regions of the species’ range which is
linked to increased mortality at sea 14, 15. Although stocks in many of our
industrial rivers have improved in the last 30 years, most stocks in Wales
are severely challenged [H].
• All species are directly affected by changes in habitat quantity and quality.
These changes are directly related to changes in the intensity of
management regimes. Fragmentation and eutrophication create particular
problems for many species (see sections 3.6-3.13 16) [H].
• The CCRA17 Evidence Report 17 has identified risks to species and
habitats due to their inability to respond to changing climatic conditions.
There may also be opportunities from new species colonisations.
Page 10
www.naturalresourceswales.gov.ukKEY MESSAGES
Conversely, native wildlife may be increasingly at risk from pests,
pathogens and invasive species. There are also risks from change in the
frequency and/or magnitude of extreme weather and wildfire events.
Climate change is influencing the expansion or contraction of some
species’ ranges and populations, and the increasing frequency of extreme
climatic events, predicted in many climate change scenarios, may have
serious implications 18 [H] .
Evidence gaps:
• Despite the long history of observing and recording animals and plants in
the UK and Wales, there are many significant gaps in the breadth and
quality of distribution, condition and trend data.
• Understanding the ecological interactions and dependencies between
many species, their habitats and the management of habitat is crucial, but
is a particular area where data is lacking.
• Although we have some very specific information for some Invasive Non-
Native Species (INNS) in Wales, it is patchy, particularly on a Wales-wide
scale.
Extent:
The suite of species in Wales reflects its position on a small island on the edge of the
Atlantic Ocean subject to influences from the European land mass with a generally
temperate climate. Many species reach the northern or southern limits of their
distribution here, and the generally mild conditions also attract summer and winter
migrants from many parts of the western Palearctic.
The diversity of habitats across Wales, from sea level to over 1000 m, has been
moulded by a long history of land management changes, and has resulted in a wide
representation of species across a broad range of taxonomic groups with estimates
varying from 25,000 to 50,000 species. Many rare species rely on small fragments of
scarce habitats; particularly important are the calcareous fens and raised bogs
alongside the more extensive dune systems and ancient oak woodland which
characterise Welsh habitat cover.
Where SSSIs are designated for their habitats, these act as extra protection for
species and vice versa.
Condition:
In a report such as this it would be impossible to provide information on the extent,
status and condition of even a fraction of our fauna and flora (even if the information
were available), but some examples where we have good long term and reliable
datasets are included in Annex 1 section 1.
The protected site network in Wales includes the Natura 2000 sites of Special Areas
of Conservation (SACs) and Special Protection Areas (SPAs) and RAMSAR sites in
addition to the national designations of National Nature Reserves, Marine
Page 11
www.naturalresourceswales.gov.ukConservation Zones and Sites of Special Scientific Interest (SSSI). All of these
designations provide protection for a wide variety of species and the habitats they
depend on.
The 2013 reports on the Annexes of the Habitats Directive (Article 17 report) and
Birds Directive (Article 12 report) summarise the UK status and trends of the
selected habitats and species and are important evidence resources 19, 20. A
summary of the Welsh results for species in Figure 3.1. For many of the freshwater
species, Water Framework Directive monitoring information in addition to SAC, SPA
and wider countryside data were used.
Figure 3.1 Overview of condition of Habitat and Bird Directive species features on SACs and
SPAs5. Number of features in assessment shown in brackets. [H]
From monitoring data collected for species features on Natura 2000 sites, we can
report that the overall condition of SAC and SPA species features on these sites in
Wales, as reported in 2013, was mostly unfavourable (55%) with the exception of
birds and mammals of which 86% and 68% were in favourable condition
respectively5.(Figure 3.1).
In Wales, the interim Section 7 list of the Environment (Wales) Act has 557 species
and 55 habitats of principle importance. These were originally selected for the
Section 42 list of the Natural Environment and Rural Communities Act 2006 for
prioritised action from the UK Biodiversity Action Plan using criteria based on the
Page 12
www.naturalresourceswales.gov.uklevel of threat they face, the level of responsibility in Wales for their populations and
whether remedial action could be taken to improve their status. The list includes
species as diverse as slow-worm (Anguis fragilis), hornet robber fly (Asilus
crabroniformis) and long-snouted seahorse (Hippocampus guttulatus).
The State of Nature Wales report3 includes an assessment of the status of some of
the interim Section 7 species in comparison to their condition at the time of the last
Biodiversity Action Plan report in 2008 (Figure 3.2).
Of the 104 invertebrate species listed as priorities, 67 were assessed. 21%
of these were declining, the outlook was improving for 25%, and the
remaining 54% showed little change in their status.
83 vertebrate species appear on the list of priority species and we assessed
78 of them. 37% of these were declining and the outlook was improving for
21%. The remaining 42% showed little change in their status.
Of the 87 fungi and lichens listed as priorities, 55 were assessed. 29% of
these were declining, the outlook was improving for 27% and the remaining
44% showed little change in their status.
52 bryophytes feature on the priority species list and we assessed 49 of
them. 47% of these were declining, the outlook was improving for 24% and
the remaining 29% showed little change in their status.
Figure 3.2 Assessment of the state of some of the Welsh priority species at broad taxonomic
group level3. [H]
Trend:
The extent, condition and trends of terrestrial species in Wales are influenced
primarily by habitat management and by climate change.
Habitat management directly influences plant community composition, amounts of
bare substrate, shading and vegetation structure. Shading due to scrub
encroachment, following changes in grazing regime, can be as damaging for
butterflies11 and many other species groups as overgrazing or agricultural
improvement. These effects are compounded by direct habitat loss which leads to
fragmentation of suitable habitat types or conditions and the increasing influence of
nutrient enrichment which leads to changes in plant communities and patterns of
growth. [H]
The latest studies (2015) suggest that climate change may pose more of a threat to
UK species than had been previously realised11 [H]. A study of the impact of the
1995 drought on butterfly abundance 21, 22 showed that some widespread species,
including large skipper (Ochlodes sylvanus) and green-veined white (Pieris napi),
Page 13
www.naturalresourceswales.gov.ukwere particularly drought-sensitive. The impact of extreme weather events is also
relevant to many invertebrates and birds on a yearly basis.
Climate change impacts such as acidification, sea temperature rises and extreme
weather events have the potential to affect marine species through a number of
factors including prey population dynamics, reproduction and distribution17, 23.
Evidence gaps:
Despite the long history of observing and recording animals and plants in the UK,
there are many significant gaps in the breadth and quality of distribution, condition
and trend data for our fauna and flora. The very specialised nature of identifying
some groups poses a challenge and this contributes to the often sporadic nature of
records. Monitoring data for many of the species listed in the Habitats Directive and
Birds Directive outside SACs and SPAs, and for many of the priority species across
Wales, is not available. Additionally, the ecological interactions and requirements
between many species, their habitats and habitat management are crucial to our
understanding, but this is an area where data is lacking.
Our evidence base is constantly improving through the efforts of dedicated volunteer
recorders and citizen scientists. The records created by these individuals are
collated by organisations such as Local Environmental Record Centres, Recording
Groups and Schemes and Societies and many of them are made publically available
through the NBN Gateway web portal (soon to be replaced with the NBN Atlas and
Atlas of Living Wales).
Limited data makes assessing the extent, condition and trends of commercially
targeted marine fish and shellfish species at a Welsh level challenging.
Commercially targeted fin fish, elasmobranchs and shellfish species are managed
through a combination of European, UK and Welsh legislation with a number of
Welsh initiatives in place to contribute valuable information on the sustainability of
marine fisheries activities and their locations in Welsh waters.
Although we have some very specific information for some Invasive Non-Native
Species (INNS) in Wales, it is patchy. We need more comprehensive distribution
data and also information on the likely rate or risk of INNS spread so that we can
develop better knowledge about anticipated economic and social impacts and
support more effective INNS management actions. The GB Non Native Species
Secretariat’s 24 Great Britain level risk assessments for new INNS will help, but we
need more data, tools or techniques, and research to fill the Wales-level information
gaps on INNS that we currently have.
KEY EVIDENCE SOURCES
• NBN-Gateway (to be replaced by the NBN Atlas) 25
• Local Environmental Records Centres (LERCs) 26
• UK Habitat Directive Reports (Article 17)19
• UK Birds Directive Reports (Article 12)20
• Wales Marine Evidence Report 27
• Wales Marine Planning Portal 28
Page 14
www.naturalresourceswales.gov.ukKEY EVIDENCE SOURCES
• UK Marine Strategy Part One: Initial Assessment and Good Environmental
Status29
• ICES Stock Condition Assessments30
• Marine Management Organisation Fisheries Statistics 31
• CEFAS Fisheries Reports 32
• Marine Environmental Data and Information Network (MEDIN) 33
• Pollinator indicator 34
• State of Nature report 20163
• Glastir Monitoring and Evaluation Programme (GMEP)13.
• Non-native species secretariat website24
Page 15
www.naturalresourceswales.gov.ukAir Quality
(See section 3.2 of the Technical Annex for Chapter 3 for more information)
• KEY MESSAGES
Condition and Trend:
• Targets for nitrogen dioxide, particulate matter, nickel and polycyclic
aromatic hydrocarbons are being breached in Wales35 thereby posing a
threat to human health and the natural environment 36 [H].
• The decline in heavy industry alongside regulation has resulted in a
reduction in emissions of some pollutants, such as particulate matter (PM)
Figure 3.3 and Figure 3.4). Other sources, that are subject to less or no
regulatory control, such as transport, agriculture and domestic heating,
have become more of a concern 37 [H].
• Particulate matter (PM) and nitrogen dioxide concentrations (Figure 3.3,
Figure 3.4, Figure 3.5 and Figure 3.6) in urban areas and adjacent to major
roads are an issue for health 38 [H].
• Peak ground level ozone concentrations have declined over the past 30
years. Over the same period, background concentrations have been
steadily increasing across northern Europe by about 0.2ppb annually38,
leading to damage to some plant species (Figure 3.7) [M].
• Ammonia remains an issue (Figure 3.8), both as a local air pollutant and as
a contributor to the formation of secondary particulate matter.
Concentrations of secondary particulate matter have risen in Wales in
recent years, largely due to changes in agricultural practice37 [H].
• 90% of semi-natural nitrogen sensitive Welsh habitats are subject to
nitrogen deposition in excess of critical load limits 39 [H].
• Since controls on air pollution were introduced in the 1980s there has been
a significant recovery in surface water quality from the effects of
acidification 40 [H].
Evidence gaps:
• The data on which we have based our evidence are collected for specific
legislative drivers such as the Air Quality Directive and Environmental
Noise Directive. The monitoring and modelling for these purposes is not
required to cover the whole of Wales. Therefore, there are likely to be
areas that are not being assessed where both air quality and noise are
having adverse impacts. Pollution from agricultural sources such as
ammonia is not specifically measured.
• Monitoring of PM 2.5 in air has been limited to date and there is insufficient
data to accurately assess the status of this fraction of particulate matter in
Wales.
Page 16
www.naturalresourceswales.gov.ukFigure 3.3 Wales PM 10 emissions by source sector37. [H]
Figure 3.4 PM 2.5 concentrations in Figure 3.5 Nitrogen dioxide (NO 2 ) concentrations in
Wales 41. [H] Wales41. [H]
Page 17
www.naturalresourceswales.gov.ukFigure 3.6 Wales nitrogen oxides (NOx) emissions by source sector37. [H]
Figure 3.7 Number of days background ozone concentration was over target value in 201441.
[M]
Page 18
www.naturalresourceswales.gov.ukFigure 3.8 Wales ammonia (NH 3 ) emissions by source sector37. [H]
• KEY EVIDENCE SOURCES
• National Air Emissions Inventory42
• Air Quality in Wales35
• Defra UK-Air 43
Page 19
www.naturalresourceswales.gov.ukWater resources and hydrological processes
(See section 3.3 of the Technical Annex for Chapter 3 for more information)
• KEY MESSAGES
Freshwater
Extent:
• The landscape and geology of Wales provide few natural stores of water
either in aquifers or soils 44 [H].
• This means that rainfall generally travels quickly to our rivers and streams
and little is held back to slowly pass through the ground to maintain river
flows (base flows) in drier periods. Rivers rise rapidly when it rains and
drop quickly afterwards. As a consequence, the flows in all Welsh rivers
can change particularly quickly leading to flood conditions, but also as
importantly, to very low flows whenever we have extended periods of dry
weather44 [H].
• The lack of natural water storage in Welsh catchments means that
reservoirs are useful to ensure reliable sources of water during drier
periods44 [H].
• Although Wales is perceived to be water rich, we are facing challenges. For
example, in 7% of our water bodies water is only reliable for people to
abstract 30% of the time for new consumptive abstractions. In
approximately 60% of water bodies, water is reliable for people to abstract
for at least 95% of the time for new consumptive abstractions45, 46 (Figure
3.9) [H].
• Changes to hydraulic conditions are identified as having an impact or likely
to have an impact on 45 of 112 (40%) Natura 2000 protected sites47.
Reduced flows caused by abstraction present risks to migratory fish and
wider biodiversity. Water Framework Directive (WFD) investigations have
identified 29 (3%) water bodies that have failed to meet objectives because
of changes to flows and water levels 48 [H].
Trend:
• Climate change is predicted to affect the amount and distribution of rainfall;
this has an impact on flows and water levels, drought and flood events 49
[H]. Work carried out in 2002 showed that by 2050 river flows in winter may
rise by 10-15% but in the summer and early autumn could reduce by over
50% and as much as 80% in some places44 [M]. Droughts and flood events
may become more common49 [H].
• Climate change may affect groundwater recharge. By 2025 it is likely that
groundwater recharge will decrease, resulting in decreased dry weather
river flows and a general lowering of groundwater levels. This may have
impacts on base-flow to rivers and wetlands in dry periods and affects
small domestic and agricultural water supplies44 [H]. The CCRA17
Evidence Report49 has identified risks to aquifers and habitats from salt
water intrusion.
Evidence gaps:
• Understanding of the impacts of land use change and climate change on
river flows and water levels needs to be improved.
Page 20
www.naturalresourceswales.gov.uk• KEY MESSAGES
Marine & coastal
Extent:
• Hydrological processes such as tides, waves and water temperature are
influenced primarily by large scale oceanographic processes but with the
potential for small to medium-scale effects from anthropogenic
influences 50. [H]
Trend:
• Climate change effects are the main broad scale driver of change for
coastal and marine hydrological processes51, 52 [H] and include changes to
tidal levels due to sea-level rise [H] and increased storminess [M] leading
to increases in wave energy. The CCRA17 Evidence Report has identified
risks to offshore infrastructure from storms and high waves.
• Climate change is also predicted to increase sea surface temperatures, to
affect salinity to a lesser degree and may increasingly affect mixing and
stratification over time51, 52 [H].
• Changes to hydrological processes from either climate change or, at a
smaller scale, from infrastructure development in the marine and coastal
environment can affect seabed and coastal geomorphology and associated
habitats and species 53, 54, 55, 56 [H].
• Hydrological processes provide an important resource for wave, tidal
stream and tidal range renewable energy 57 (Figure 3.10). [H]
Evidence gaps:
• There is insufficient understanding of hydrological processes (waves in
particular) for the nearshore environment which is partly because of the
lack of monitoring.
• Limited understanding of shoreline response (erosion and accretion) to
changes in hydrological conditions (e.g. sea level rise and wave activity
from storms).
Page 21
www.naturalresourceswales.gov.uk© Crown Copyright. Some features of
this map are based on digital spatial
data licensed from the Centre for
Ecology and Hydrology © CEH
Figure 3.9 Water resource availability in Wales in 2014 (percentage of time)45, 46. [H]
Page 22
www.naturalresourceswales.gov.uk© Crown Copyright © Crown Copyright
Figure 3.10 Map of peak spring tidal flow
Figure 3.11 Maps of wave height for Welsh
for Welsh waters reproduced from: Atlas of
waters reproduced from: Atlas of UK Marine
UK Marine Renewable Energy Resources
Renewable Energy Resources (2008)57. [H]
(2008)57. [H]
• KEY EVIDENCE SOURCES
• River Basin Management Plans58
• The case for change - current and future water availability 59
• LIFE Natura 2000 programme47
• Water Strategy for Wales 60
• Water Resources Strategy for Wales44
• Climate Change Risk Assessment for Wales49
• UK Climate Projections 2009 (UKCP09) 61
• Wales’ Marine Evidence Report50
• Charting Progress 2: The State of UK Seas62
• Marine Climate Change Impacts Annual Report Card52
• UK Climate Projections Science Report: Marine and Coastal Projections51
• Atlas of UK Marine Renewable Energy Resources57
• Shoreline Management Plans53, 54, 55, 5653
Page 23
www.naturalresourceswales.gov.ukSoils
(See section 3.4 of the Technical Annex for Chapter 3 for more information)
• KEY MESSAGES
Extent:
• Soils are diverse; over 400 different soil types found in Wales 63 are
contributing to, reflecting, and supporting our rich geodiversity and
biodiversity, landscapes and land uses (Figure 3.12) [H].
• Welsh soils contain 410 million tonnes of carbon 64 (Figure 3.13) [M].
Condition:
• The soils of best quality and most productive agricultural land are a scarce
and finite resource in Wales; accounting for less than 7% of land area 65
[H].
• Soil quality has deteriorated across all habitats apart from woodlands
where there has been some improvement 66 [M].
• The severity and spatial extent of soil erosion has not been directly
quantified in Wales 67. Around 10-15% of grassland fields in England and
Wales are thought to be affected by severe soil compaction and 50-60%
are in moderate condition 68 [L]. No data exists on compaction in grassland
and arable land across Wales specifically.
• Only 30% of the Welsh peat soil area is considered to be in ‘good
condition’ 69 [M]. It is estimated that 74% of acid sensitive habitat soils
receive acidic deposition in excess of their capacity to neutralize air
pollution 70 [H].
• Remediation has been completed at 97 of the 111 Contaminated Land
sites identified in Wales (Figure 3.14) [H], but around 9,330 potentially
contaminated sites have yet to be investigated 71 [L]. There is no evidence
that has collated land use change statistics at sufficient resolution to
identify the extent of soil sealing in Wales67.
Trend:
• Topsoil carbon concentrations are generally stable and there is ongoing
recovery from soil acidification 72 [M]. Although a significant decline in soil
phosphorus levels has been seen for Improved Land72 [H], it remains
above the optimum levels in many (44%) agricultural fields73 [M]. Soil
invertebrate (mesofauna) numbers indicate no overall trend72 [L]. There
has been little or no decline in elevated levels of soil contaminants from
industry and transport 74 [M] (Figure 3.15).
• The CCRA17 Evidence Report 75 has identified risks to soils from increased
seasonal aridity and wetness. Climate change related risks are threatening
the many services that soils provide, notably those that relate to soil biota,
soil organic matter, and soil erosion and compaction 76 [M].
Evidence Gaps:
• Compared to air and water, for example, there is a general lack of
information on the current state and trends of soils in Wales and their
vulnerability and resilience to land use, land management and changing
weather patterns and climate67, 77.
Page 24
www.naturalresourceswales.gov.uk© Cranfield University
Figure 3.12 ‘Soilscapes’, the National Soil Map of Wales (UK Soil Observatory (UKSO),
2016 78). [H]
Page 25
www.naturalresourceswales.gov.uka) b)
c)
Figure 3.13 Distribution of soil carbon in Wales, shown as carbon density (t/ha): a) depth 0-
30 cm; b) depth 30-100 cm; c) depth 0-100 cm 79.
Page 26
www.naturalresourceswales.gov.ukFigure 3.14 Contaminated Land sites in Wales identified under the Part 2A regime of the
Environmental Protection Act 1990 (determinations reported by local authority)71. [L]
Page 27
www.naturalresourceswales.gov.uk(a) (b)
(c) (d)
Figure 3.15 Glastir Monitoring and Evaluation Programme (GMEP) data for topsoil: (a) Long
term trends in carbon concentration (1978 to 2013); (b) Long term trends in topsoil pH; (c)
Long term trends in topsoil phosphorus availability (Olsen-P); (d) Trend in topsoil mesofauna
abundance. Solid blue line = Countryside Survey data (CS data); Dashed blue line = GMEP
2013 Wider Wales Survey72. [M]
• KEY EVIDENCE SOURCES
• Glastir Monitoring Evaluation Programme (GMEP) 80
• UK Soil Observatory (UKSO)78
Page 28
www.naturalresourceswales.gov.ukGeodiversity, geological features and processes (including minerals)
(See section 3.5 of the Technical Annex for Chapter 3 for more information)
• KEY MESSAGES
Extent:
• Wales has some of the most varied geology in the world representing all
geological periods and spanning 1.4 billion years of the Earth’s history.
This diverse geology not only underpins our biodiversity and landscape but
also provides important mineral resources 81 [H].
• Two UNESCO Global Geoparks, GeoMôn and Fforest Fawr, cover
1,483 km2 of Wales and are designated for the primary purpose of
promoting geotourism 82 (Figure 3.16) [H].
• 300 SSSIs in Wales, covering 48,815 ha 83 [H], contain some 500
geological features and 93% of these features are in favourable condition 84
(Figure 3.16) [L-H].
Trend:
• Following a long history, metal mining has ceased and there is only
localised coal mining and slate quarrying in Wales. The aggregates
industry is now the main mineral extraction industry in Wales, including
marine and terrestrially derived aggregates 85 (Table 3.1) [H].
• Geological hazards may change as a response to climate change. For
example, coastal erosion, landslides and pollution from former mine sites 86
[H]. The CCRA17 Evidence Report 87 has identified risks to transport
networks from slope and embankment failure. There is also a subsidence
risk to subterranean infrastructure caused by falling and rising moisture
levels – particularly in clay-rich soils.
• Exploration for conventional and unconventional sources of oil and gas
remains a possibility in Wales88 (Figure 3.17) [H].
Evidence Gaps:
• Some areas of Wales have no recent geological mapping carried out by the
British Geological Survey. This includes one area in mid-Wales where
there is no published 1:50,000 scale map.
• The British Geological Survey has identified a number of geological
formations in Wales that might potentially yield unconventional oil and gas
supplies. The extent of the potential unconventional oil and gas resources
remains unclear and can only be fully ascertained through exploratory
work.
Page 29
www.naturalresourceswales.gov.ukFigure 3.16 Welsh Geodiversity Sites 89 [H].
Table 3.1 Mineral production for 201485 [H].
Thousand Tonnes
Mineral
Extracted 2014
Coal (deep-mining) 91
Coal (opencast) 2,343
Igneous Rock 1,905
Limestone & Dolomite 8,934
Sand & Gravel (land) 673
Sand & Gravel (marine) 632
Sandstone 2,774
Total 17,352
Page 30
www.naturalresourceswales.gov.uk© Crown Copyright
Figure 3.17 Potential unconventional gas resources in Wales 90. [H]
• KEY EVIDENCE SOURCES
• British Geological Survey study of potential unconventional gas resources in
Wales88
• British Geological Survey (BGS) Geological Data81, 91
• Wider value of UNESCO to the UK report82
• UNESCO Global Geoparks Celebrating Earth Heritage, Sustaining local
Communities report 92
• Fforest Fawr Geopark website 93
• GeoMôn Geopark website 94
• The UK Mineral Extraction Industry Report 95
• British Geological Survey United Kingdom Minerals Yearbook 201485
• Information on the Geological Conservation Review 96
Page 31
www.naturalresourceswales.gov.ukPART B – WELSH ECOSYSTEMS
Overview
The land area of Wales covers 2,078,224 ha 97. The Welsh marine area extends out
to 12 nautical miles, covering just under 15,000 km2 or 41% of the territory of
Wales98.
The Habitat Survey of Wales 99 provides complete coverage of the country and was
undertaken between 1979 and 1997. Updates in survey coverage have resulted from
refined earth observation methods and the Glastir Monitoring and Evaluation
Programme 100. More detailed information for habitats which are a priority for
conservation measures is provided by NRWs ongoing Phase 2 Habitat Survey.
The land-cover of Wales can be divided broadly into semi-natural habitats and
modified land-cover types. Semi-natural habitats retain many of their characteristic
species. Modified land-cover types include the built environment as well as land
where ecological processes and species composition have been hugely altered, for
example, improved grassland, arable land and conifer plantations. The
representation of semi-natural habitat varies significantly across Wales. The Welsh
lowlands are highly modified (Figure 3.18). Of the lowlands 17.3% is semi-natural
habitat, whereas of the upland area 84% is semi-natural habitat. Semi-natural
habitats in Wales cover a total of 626,100 ha (30% of the Welsh land surface)99 [M].
Figure 3.18 Summary of the representation of semi-natural habitats and modified land-cover
types in Wales99 [M].
The marine environment includes 2,740 km of coastline 101 [H]. The marine
ecosystems in Wales form part of two wider biogeographic regions: the Irish Sea,
and the Western Channel and Celtic Sea. There is a high diversity of habitats and
species including sediment and biogenic habitats, sessile and highly mobile species.
A proportion of marine habitats are surveyed and mapped 102, but for some areas our
understanding only comes from modelling 103.
Page 32
www.naturalresourceswales.gov.ukThe way in which habitats are grouped in SoNaRR follows the system of the National
Ecosystem Assessment (NEA), which combines the separate habitat types of the
Habitats of Wales scheme into ‘broad habitats’. These are effectively broad
ecosystem units. Table 3.2 describes what is included in the remainder of this
Chapter in relation to the NEA groupings.
Table 3.2 What is included in each broad habitat.
NEA broad habitat Description (UK NEA, unless otherwise stated)
Mountains, Moors and
Heaths Mountainous habitats are those above the climatic tree-
line. Moorlands and heaths are predominantly open and
unenclosed. Includes: upland and lowland heathlands
(including dwarf shrub heath), moorlands, blanket bog,
montane habitats (including ffridd or the upland fringe
that encompasses land occurring between the
intensively managed lowlands and the open moor),
inland rock habitats (exposures) and stands of bracken
in the lowlands. Often interspersed with other habitats
such as semi-natural grasslands, woodlands and surface
water.
Semi-natural
grasslands
A mixture of grasses and herbaceous plants, along with
sedges, rushes, mosses and other low-growing species,
often created by low-intensity, traditional farming or
natural vegetation on poor soils or in exposed locations.
They often contain a rich variety of grasses and herbs.
Enclosed farmland Agricultural land surrounded by hedges, walls, fences
and other field boundaries. Includes: arable crops,
horticulture, orchards and temporary grasslands as well
as agriculturally improved permanent grasslands.
Excludes: the ffridd, areas of enclosed semi-natural
grassland, scrub and farm woodland.
Woodland
Land where the ecological condition is, or will be,
strongly influenced by the tree canopy. In terms of land
cover statistics (in the UK), woodland is currently defined
as land with trees where the mature trees would cover
more than 20% by area. Large tracts are generally called
forests, smaller units are described in a variety of terms
such as woodlands, woods, copses and shelterbelts, but
Page 33
www.naturalresourceswales.gov.ukthere is no minimum size for a woodland (UK Forestry
Standard).
Freshwaters Freshwater-habitats occur wherever rainfall, snowmelt or
groundwater collects into flowing channels (rivers and
streams), standing waters, or associated bogs, fens,
grazing marshes, wetlands and floodplains.
Groundwater is the water stored in soil and rocks. It
provides base flow to springs, rivers and wetlands. This
broad habitat includes groundwater, wetlands, rivers and
streams, and standing waters (lakes and ponds).
Urban
The built environment.
Includes: buildings, roads, gardens, parks and informal
green spaces, waste sites and any other structure or
space installed for human activities 104.
Coastal Margins
Habitats around the coastline of Wales.
Includes: sand dunes, saltmarsh, sea cliffs, saline or
coastal lagoons and shingle.
Marine
Includes: coastal and marine waters, the intertidal area
and the inshore subtidal area. The intertidal area covers
the shore from the high water mark down to the low
water mark. The marine inshore subtidal area is the area
of the sea bed that is always covered by water, from the
low water mark out to 12 nautical miles.
Habitats of principle importance
In Wales the interim Section 7 list has 55 habitats of principle importance which were
originally selected for the Section 42 list of the Natural Environment and Rural
Communities Act 2006. These habitats cover terrestrial, freshwater and marine.
They include blanket bog, ponds and seagrass beds and were selected for prioritised
action from the UK Biodiversity Action Plan (BAP) using criteria based on the level of
threat they face, their relative importance as habitat in Wales and whether remedial
action will be able to improve their status. Terrestrial habitats of principle importance
extend over a total area of 387,300 ha 105 [M]. The most extensive of these in Wales
(each with a resource of >30,000 ha) include upland heathland, blanket bog, upland
oak woodland, purple moor-grass and rush pasture, lowland dry acid grassland and
Page 34
www.naturalresourceswales.gov.ukYou can also read