Transboundary aerosol transport process and its impact on aerosol radiation cloud feedbacks in springtime over Northeast Asia
←
→
Page content transcription
If your browser does not render page correctly, please read the page content below
www.nature.com/scientificreports
OPEN Transboundary aerosol
transport process and its impact
on aerosol‑radiation‑cloud
feedbacks in springtime
over Northeast Asia
Hyo‑Jung Lee1, Yu‑Jin Jo2, Seungwoo Kim3, Daecheol Kim3, Jong‑Min Kim2, Daniel Choi4,
Hyun‑Young Jo2, Juseon Bak2, Shin‑Young Park5, Wonbae Jeon2 & Cheol‑Hee Kim1,2*
Northeast Asia has been suffering from dramatic increases of particulate matter (PM) since the late
1990s, and it still continues to undergo haze despite various abating regulations. In this study, we
investigated aerosol-cloud-precipitation (ACP) interactions with the varied PM, and the impact of
long-range transport (LRT) process on ACP in springtime was assessed in Northeast Asia. Our long-
term (1995–2019) analysis of PM10 exhibited the correlation with decreases of both sunshine duration
and drizzle occurrences that can be interpreted as direct and indirect aerosol effects, while cloud
cover induced by the varied PM10 was found only in more than 90% cloud cover (9/10–10/10 category).
The online WRF-Chem with wind-blown dust simulation indicated that cloud water was affected by
secondary inorganic aerosol (SIA) formation near the surface in upwind areas dominantly, whereas,
along the LRT pathway, cloud water perturbation altitudes were increased quasi-linearly toward
downward between 1 and 3 km. The gas-to-particle conversion ratios of sulfur ([SO42−]/[SO2 + SO42−])
and nitrogen ([NO3−]/[NO2 + NO3−]) both remain aloft long at the same vertical levels of most perturbed
cloud altitude enough to be transported over long distance in springtime. Formations of sulfate and
nitrate showed different ACP interaction timing; distinctive shifts in the ratios observed at the exit
(Shanghai-Yellow Sea) by nitrate, and entrance areas (Seoul-Tokyo) by sulfate along the LRT pathway,
respectively, with higher ratios of 0.8 or more in springtime. Our results indicate that ACP processes
have been enhanced at a LRT-related altitude with different SIA production timings that can be
considered in species-specific springtime PM abatements over Northeast Asia.
Northeast Asia is one of the fastest developing regions worldwide, receiving significant air pollution from vari-
ous sources1–3. Although fine particulate matter (PM) levels have decreased significantly in recent years due to
emission reduction policies, PM levels remain high with frequent and severe haze episodes in regions, especially
during the spring period4–6. In addition to natural and anthropogenic emissions, PM2.5 levels in the atmosphere
are affected by complex chemical transformations, including secondary formations and wet/dry deposition pro-
cesses. Correspondingly, Northeast Asia is an area of increasing scientific interest for investigating aerosol-cloud-
precipitation (ACP) feedbacks due to the complex aerosol-meteorology interactions occurring in this region.
Aerosols are affected directly and indirectly through ACP feedbacks. Previous studies indicate that aerosol
direct effects are mainly affected by meteorological variables such as temperature and p recipitation7–10, whereas
aerosol indirect effects can promote reduced cloud drop sizes by lowering the collision efficiency, thereby affecting
coalescence and collision p rocesses11,12. Several changes in ACP feedbacks occur owing to these effects, including
the suppression of weak rainfall (or drizzle)13,14, delaying precipitation t ime15–17, intensifying deep convective
clouds13,16, and the upsurging in the surface r ainfall18 over time. ACP interactions have been recognized to be
1
Institute of Environmental Research, Pusan National University, Busan 46241, South Korea. 2Department
of Atmospheric Sciences, Pusan National University, Busan 46241, South Korea. 3Korea Science Academy of
Korea Advanced Institute of Science and Technology, Busan 47162, South Korea. 4National Center for Fine Dust
Information, Ministry of Environment, Cheongju 28166, South Korea. 5Korea Institute of Atmospheric Prediction
System (KIAPS), Seoul 07071, South Korea. *email: chkim2@pusan.ac.kr
Scientific Reports | (2022) 12:4870 | https://doi.org/10.1038/s41598-022-08854-1 1
Vol.:(0123456789)
www.nature.com/scientificreports/
Figure 1. Schematic illustration of aerosol-cloud-precipitation interactions during the long-range transport
process.
complicated and exhibit regional and temporal variability u ncertainties16,17,19–22, depending on the regional vari-
ations in aerosol loadings in the atmosphere.
Northeast Asia is an area where many studies have investigated the long-range transport (LRT) of air pol-
lutants and the impact of transboundary transport of Chinese pollution on neighbouring countries through
modelling and intensive measurements23–26. Anthropogenic aerosols, natural dust, ozone and its precursors,
and carbon monoxide emitted from upwind areas, such as industrial areas in China, can be subjected to LRT to
neighbouring downwind areas, including the western United S tates27–37. They showed that the LRT of pollutants
plays an important role in modulating atmospheric composition and air quality. Thus, assessing the impacts of
pollutant LRT on ACP interactions is becoming important in Northeast Asia.
Secondary inorganic aerosol (SIA) and organic aerosol formations associated with the role of LRT on ACP
interactions, have been rarely studied over Northeast Asia. Some studies have focused on horizontal transport
pathways37–40 and vertical mixing structures31,33,41–43 over the belt area spanning the Yellow Sea in China and the
Korean Peninsula. However, most regional-scale studies on ACP feedbacks have been conducted in the sum-
mer when precipitation rates are h igh1,44–47. Furthermore, few studies have investigated ACP feedbacks in an
atmosphere with high aerosol loads (i.e., winter-spring season). For example, aerosol loadings in the spring are
on average higher than in the summer at the surface and higher altitudes over Northeast Asia. The high-pressure
systems that are accompanied by westerly and northwesterly winds move eastward frequently, and resulting
ACP interactions occur in downwind areas affected by both primary aerosols near sources and secondary aero-
sols along the LRT pathway in Northeast Asia (Fig. 1).
Increased SIA-related emissions, including fine particulate matter and gas phase precursors (e.g., SO2 and
NOx), originating from upwind source regions can modify cloud microphysics effectively when they are gen-
erated and subsequently move toward receptor regions. However, as quantitative measurements in the upper
atmosphere are not available, in-situ measurements, satellite data, and numerous numerical experiments can be
used to assess the impact of the LRT of pollutants on ACP interactions.
In the current measurement-simulation study, we first investigated the 25-year variation in cloud-precipitation
properties: cloud cover, precipitation intensity, radiation, and sunshine duration, particularly in association
with aerosol loadings: measured PM10. Next, an online WRF-Chem model including dust simulation was also
applied to interpret the interactive ACP feedback process by diagnosing the direct and indirect aerosol effects on
cloud invigoration and precipitation development during the LRT process. We carried out our study only in the
spring season when the aerosol ( PM2.5) concentrations are relatively higher and LRT processes occurred more
frequently. During the analysis of ACP interactions, we explore how the LRT process and SIA can contribute to
cloud precipitation and analyse their implications on regional weather.
Results
Long‑term trends in meteorological factors and PM10. Figure 2 shows the long-term trends in the
aerosol optical depth (AOD) over Northeast Asia, together with P M10 measurements in South Korea during
1995–2019. As a reference, the annual time series for PM10 concentrations in Seoul are also displayed in Fig-
ure S1. One thing to note is that there exist no adequate quantitative long-term aerosol (PM2.5) data, avail-
able PM10 measurements were used in this study for the long-term ACP interaction studies. In Fig. 2a, the
spatiotemporal trends for AOD show significant increases over the period from 1995 to 2014, especially in urban
and industrial areas near the Chinese inland (110–120° E, 25–40° N) such as Beijing-Tianjin-Hebei (BTH) in
East China. However, in recent years (2015–2019), the AOD in East China was noticeably lower than the previ-
Scientific Reports | (2022) 12:4870 | https://doi.org/10.1038/s41598-022-08854-1 2
Vol:.(1234567890)
www.nature.com/scientificreports/
Figure 2. Time series of 5-year averaged horizontal distributions of (a) aerosol optical depth using MERRA-2
data in Northeast Asia and (b) in situ PM10 surface measurements in South Korea. The blue circles indicate the
location of Seoul.
ous period, mainly due to the Atmospheric Pollution Prevention and Control Action Plan that has been strongly
enforced since 2013 by the Chinese government3,48.
Figure 2b shows that PM10 concentrations in the Seoul metropolitan area (SMA) in Korea increased from
1995 to 2009; however, it decreased since the beginning of 2010 (Figure S1) owing to the implementation of the
Special Air Quality Act in the Seoul metropolitan area by the Korean government in 2003 and 2010, which led to
significant declines in PM10 concentrations over South Korea, including the SMA36,49. It is interesting to note in
Figure S1 that the two starting years of abating policies (2003 and 2010) are consistent with the first and second
most significant P M10 declining trends, respectively (Figure S1). Despite the recent decline in the AOD in Seoul
and over Northeast Asia, the P M10 annual mean in Seoul remained high at 34 μg m−3 in 2019 compared to those
of other metropolitan cities in 2019 such as Los Angeles (29 μg m−3), Tokyo (16 μg m−3), Paris (20 μg m−3), and
London (18 μg m−3), as shown in Figure S1(a).
The observed trends for sunshine duration (SD), cloud cover (CC), drizzle occurrences (DO), and precipita-
tion amounts (PA) related to inter-annual AOD-PM10 changes provide insights into aerosol direct and indirect
effects in Seoul. We defined in this work the drizzle as precipitation with its amount of < 1 mm hr−1, conformed
to that in World Meteorological Organization (1975)50. Figure 3 shows that the SD decreased significantly dur-
ing the period when PM10 concentrations increased from 2000 to 2002, and then gradually increased when the
PM10 concentrations decreased from 2005 to the present (Figure S1, Fig. 3a), thereby indicating a strong inverse
correlation between P M10 and SD in Seoul with the correlation coefficient (r) of − 0.73. This observation can be
simply explained by the theory of direct and indirect aerosol effects, where the cloud formation process affected
by aerosols dimmed incoming solar radiation and increased the cloud lifetime.
A similar relationship was found between P M10 and DO (Fig. 3d). For instance, DO tended to decrease when
PM10 concentrations increased from 2000 to 2002, and it increased in 2003 when the PM10 reduction policy
began. However, the relationship between PM10 and PA is not clear in our study, as there are more complex
characteristics associated with PA relative to the other variables. The relationship between P M10 vs. CC showed
a positive correlation for the 9/10–10/10 category, whereas other CC categories showed no obvious correla-
tions. The occurrence of CC in the 9/10–10/10 category maintained higher during relatively higher PM10 period
(2000–2002), and decreased since 2005 (Fig. 3c); these results are broadly consistent with the timing of increased
AOD and P M10 over Northeastern Asia and in Seoul. We hypothesised that if the second aerosol indirect effect
increases the lifetime of clouds, then changes in the occurrence of clouds that concurrently suppress precipitation
should be limited to low-level non-precipitating clouds with precipitation just beginning to form.
It is challenging to establish a robust relationship between ACP processes and long-term observations of
CC and PM10 in highly polluted areas; this is because other influential factors, such as climatological factors
and large-scale meteorological circulation, contribute to the ACP process at larger and broader scales. In Seoul,
aerosol levels have been affected by both local emissions and the LRT process, during which aerosols can be
removed by dry or wet deposition at near surface, while SIA can be generated in the atmosphere aloft. As Fig. 1
Scientific Reports | (2022) 12:4870 | https://doi.org/10.1038/s41598-022-08854-1 3
Vol.:(0123456789)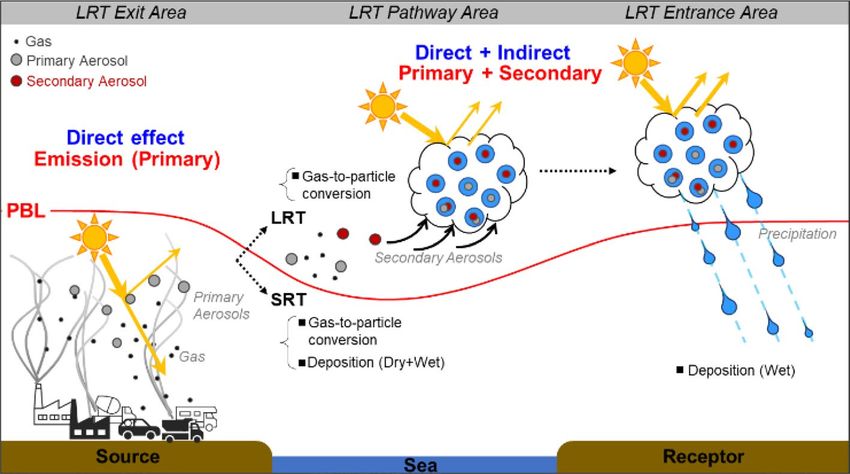
www.nature.com/scientificreports/
Figure 3. Long-term (1995–2019) springtime trends for (a) PM10 concentration, (b) sunshine duration, (c)
the frequency of cloud cover for each cloud cover interval, and (d) the occurrences of precipitation intensities
divided by hourly precipitation amounts in Seoul, South Korea.
indicated, aerosol precursors originating from the upwind areas of Seoul (i.e., urban and industrial regions in
China) formed SIA (and other secondary aerosols) during LRT, and that SIA-induced ACP feedbacks can newly
occur as they move toward receptor regions. Although there are no available chemical or physical measurement
data for higher altitudes at which clouds are present, potential ACP effects by LRT can be represented by online
and offline WRF-Chem simulations for the LRT dominant cases.
Aerosol‑induced changes in radiation, cloud, and precipitation properties for the LRT
cases. Our selection of LRT cases was based on the criteria described by Jo and Kim (2013)51, which dis-
tinguished LRT conditions by tracking consecutive 6-day synoptic weather charts and air trajectories. In our
study, the LRT cases during the 2018 spring season occurred on 10–11 March 2018, 23–24 March 2018, and 19
April 2018. In Figure S2, both model—MERRA2 reanalysis data, and model—surface PM2.5 measurements, are
compared for chosen periods, showing on-line model’s good capability in capturing the increasing and decreas-
ing trends for PM2.5 concentrations in Seoul. The index of agreement was 0.73 (Figure S2a) and the correlation
coefficient (r) of the spatial AOD distributions was also 0.67 in Northeast Asia (Figure S2b), thereby corroborat-
ing the representation of the ACP interactions by the online model. As for the model validation of cloud-pre-
cipitation properties, the simulated shortwave radiation (vs. observed SD), cloud water (vs. observed CC), and
precipitation amounts (vs. observed PA) were compared against observations (Figure S3). Note that the variable
in the modeling and measurement does not match. The online WRF-Chem model produced acceptable simula-
tions for SD and CC and captured long-term trends, facilitating interpretations of P M2.5–cloud interactions.
Figure 4 shows the online simulated PM2.5 and ACP variables such as shortwave radiation, cloud water,
and precipitation with and without ACP interactions for chosen LRT-dominant periods. Figure 4b reveals the
shortwave radiation differences (equivalent to the meaning of SD) near the BTH-Yellow Sea-SMA belt area on
24 March 2018 during the LRT process (i.e., areas with high PM2.5 concentrations). Shortwave radiation was
perturbed by ACP interactions up to ~ 70 W m−2 lower (the maximum bias was found at ~ 12 KST local time),
reflecting the aerosol direct effect (albedo changes) and the aerosol indirect effect (cloud cover increases). These
Scientific Reports | (2022) 12:4870 | https://doi.org/10.1038/s41598-022-08854-1 4
Vol:.(1234567890)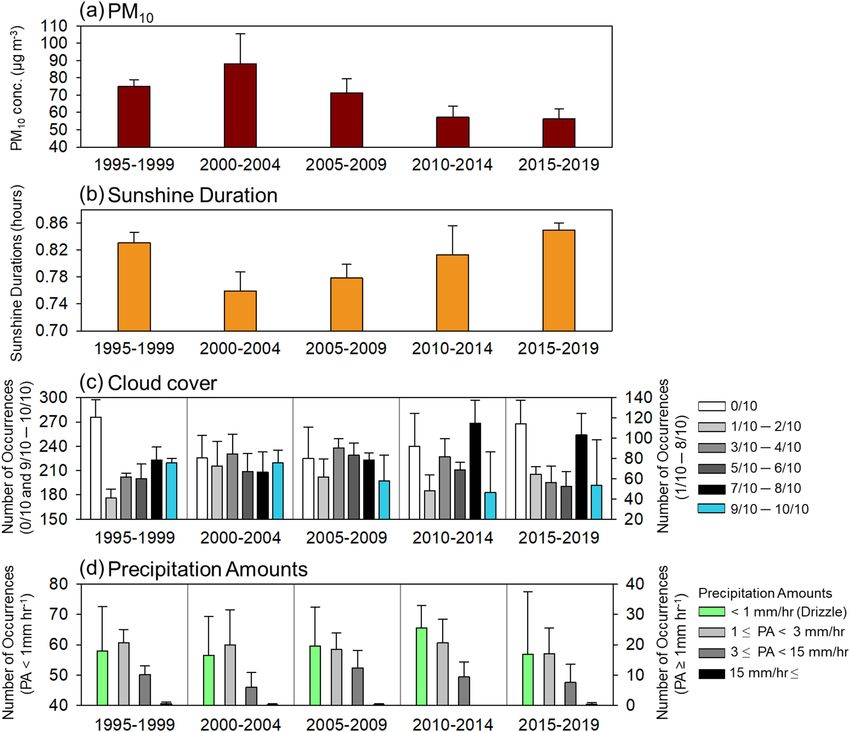
www.nature.com/scientificreports/
Figure 4. (a) Horizontal distributions of vertically integrated PM2.5 column concentrations during selected
high PM2.5 episodes from March to April 2018. The impact of aerosol-induced differences between online and
offline modelling results for (b) shortwave radiation at 0300 UTC, (c) daily cloud water mixing ratio vertically
integrated from the surface to 50 hPa (top of model vertical layers), and (d) daily accumulated precipitation
amounts for 10, 11, 23, and 24 March 2018 and 19 April 2018.
shortwave radiation differences have driven up to ~ 10% in our study at higher P M2.5 concentrations along the
belt area, during the LRT toward receptor regions (Figure S4).
There was also a more immediate change in cloud water from the aerosol-driven shortwave radiation dif-
ferences (Fig. 4c) during the LRT process. The cloud water was lower along the high cloud water regions at the
exit (i.e., coastal areas in East China) and entrance areas (i.e., coastal areas or the Yellow Sea ocean areas) of the
LRT pathway. These results are consistent with those of previous studies on the high sensitivity of cloud water
and CCN to relative humidity, as shown by Kang et al.47. Our results and those of Kang et al.47 show the overall
decrease in cloud water by the aerosol effect under high humidity over the Yellow Sea, while other studies report
opposite results44,47. A potential reason for this discrepancy is that only spring episodes were investigated in this
study, while previous studies are based on summer season with higher precipitation condition and relatively
lower aerosol loadings. In addition, these previous studies indicated that cloud water during the summer wet
periods is increasing because of ACP interactions. It should be also noted that although there might be more local
variations, ACP effects may produce different results depending on the cloud types such as non-precipitating
low-level clouds and/or deep convective cumulus c louds52.
However, daily PA showed no significant differences (or a small increase) over Northeast Asia, including the
belt area (Fig. 4d). This is because the high P M2.5 cases are not compatible with heavy precipitation days due to
the wet removal process by precipitation; instead, we confirmed that aerosols can affect the enhancement or sup-
pression of PA before and after the periods characterized by high P M2.5 concentrations by altering precipitation
development in highly polluted areas (Figure S5). In particular, a small increase by 3.5 mm on average (mostly
less than 10 mm) in daily PA was simulated over the non-LRT period during March–April over Southern China
near Shanghai and the Yellow Sea (Figure S5), which is consistent with previous r esults43.
Roles of aerosols in the vertical changes of clouds during LRT. Aerosols primarily can provide an
intermediate stage for ACP interactions and have high potential to be enhanced by SIA formation during LRT
pathways. These assumptions can be confirmed by online and offline numerical sensitivity experiments. We
Scientific Reports | (2022) 12:4870 | https://doi.org/10.1038/s41598-022-08854-1 5
Vol.:(0123456789)www.nature.com/scientificreports/
Figure 5. (a) Vertical profiles of online (red solid line) and offline (blue solid line) WRF-Chem-simulated
cloud water mixing ratios from the ground to 600 hPa isobaric surface in Shandong, Shanghai, the Yellow Sea,
Seoul, and Tokyo averaged from March to April 2018. The black squares and grey horizontal lines represent
the mean and standard deviation of cloud water differences between online and offline WRF-Chem modelling
results, respectively. (b) The ratio of standard deviations of cloud water differences between 850 and 1000 hPa
in Shandong, Shanghai, the Yellow Sea, Seoul, and Tokyo. (c) Vertical distributions of gas-to-particle conversion
ratios of sulfate and nitrate simulated by online WRF-Chem modelling. The separated sulfate and nitrate
oxidation ratios are also illustrated in Figure S6.
focused on the vertical profiles of cloud water perturbations from March to April 2018 during periods character-
ized by high PM2.5 concentrations in Shanghai, Shandong, Yellow Sea, Seoul, and Tokyo (Fig. 5).
The results showed that in Shandong and Shanghai, where P M2.5 concentrations were relatively high, the
cloud water was largely reduced by aerosol interactions by almost 50% near the surface (i.e., < 1000 hPa isobaric
altitude), while no differences were found at altitudes higher than 950 hPa (Fig. 5a). However, unlike upstream
area, cloud water perturbations over Seoul and Tokyo were found at much higher altitudes, such as 950–700 hPa
(Fig. 5a). The vertically averaged differences between 950 and 700 hPa are − 0.28, − 2.66, − 1.68, and − 7.08 μg kg−1
in Shandong, Shanghai, Seoul, and Tokyo, respectively. The estimated ratios of cloud water variance between
the surface (1000 hPa) and 850 hPa (= σ850hPa/σ1000 hPa) were 0.1, 0.3, 0.1, 4.9, and 81 at Shandong, Shanghai, Yel-
low Sea, Seoul, and Tokyo, respectively, indicating a clear increase as the aerosol moved from west (exit area) to
east (entrance area) (Fig. 5b). This trend strongly suggests that ACP interactions occurred during LRT, and it
Scientific Reports | (2022) 12:4870 | https://doi.org/10.1038/s41598-022-08854-1 6
Vol:.(1234567890)www.nature.com/scientificreports/
is worth paying special attention to the limited layers ranging from 900 to 700 hPa isobaric surface (equivalent
to 1–3 km above the surface) are related to atmospheric boundary layers or residual layers in the LRT entrance
areas over Northeast Asia.
Two chemical components were examined from gas-to-particle partitioning perspectives to confirm the
role of SIA. Figure 5c and S6 show the vertical distributions of the sulfur oxidation ratio (SOR) (= [SO42−]/
[SO2 + SO42−]) and nitrogen oxidation ratio (NOR) (= [NO3−]/[NO2 + NO3−]). The ratios both generally remain
aloft long enough to be transported over long distance with high values of 0.8 or more over the Yellow Sea and
Korean Peninsula. The distributions at altitudes of ~ 850 to 700 hPa (approximately 1.5–3 km) are consistent
with significant cloud water perturbations, thereby corroborating the representation by the model. Here, it is
also interesting to note the two distinctive significant jumps in the chemical composition ratios; (1) LRT exit
area (Shanghai-Yellow Sea), and (2) LRT-entrance areas (Seoul-Tokyo). The former was identified as nitrate and
the latter as sulfate (Figure S6).
Discussion
The main goals of this study were to investigate the influence of aerosol effects on cloud-precipitation in asso-
ciation with LRT over Northeast Asia. We first analysed the observed cloud variables over a long-term period
(1995–2019), and numerous numerical model simulations were performed to verify the observed characteristics.
The results showed that in Seoul and South Korea, P M10 and SD were negatively correlated while PM10 and CC
were positively correlated in the 9/10–10/10 cloud category. However, P M10 and PA did not show a significant
relationship overall. However, increased PA (i.e., drizzle) was found in springtime in Northeast Asia, while other
studies showed both increases in cloud water and suppression of rainfall during the strong precipitation period,
such as the summer monsoon season. This implies that aerosol-precipitation may contain considerable levels
of uncertainty, varying predominantly according to the moisture (humidity) levels (i.e., season), the vertical
depth of convection, and local variation of non-precipitating low-level clouds by aerosol characteristics. These
uncertainties can be traced to a number of assumptions made in more comprehensive model over the periods
of monsoon vs. non-monsoon season to better quantify ACP sensitivities over Northeast Asia.
The cloud water affected by aerosols was typically found near the surface level in the LRT exit areas (Shan-
dong and Shanghai) when PM2.5 plumes were moving; consequently, cloud water perturbations were observed at
approximately 1–3 km above the surface over receptor regions in Northeast Asia. As dominant aerosol sources are
mostly located at or near the surface, the aerosol properties decrease strongly with altitude. However, aerosol-led
evolutions of ACP interactions are possible during the LRT process, especially by loading secondary generated
aerosols. The online model simulation showed that ACP effects during LRT immediately reduced shortwave
radiation along the plumes characterized by high PM2.5 concentrations up to ~ 10% in Northeast Asia. The
cloud water perturbed by aerosols was found only near the surface level in the LRT exit areas (Shandong and
Shanghai), and the cloud water was largely reduced at a 1000 hPa isobaric altitude or lower. Cloud water was
often perturbed by aerosols at higher altitudes, particularly between 950 and 700 hPa, in downstream areas such
as Seoul and Tokyo. The estimated ratios of the cloud water perturbations between two layers (1000 hPa and
850 hPa) (= σ850 hPa/σ1000 hPa) are 0.1, 0.3, 0.1, 4.9, and 81, at Shandong, Shanghai, Yellow Sea, Seoul, and Tokyo,
respectively, showing quasi-linear increasing rate toward downward between 1000 hPa and 850 hPa.
The role of SIA was also examined. Sulfur and nitrogen oxidation ratios (= [SO42−]/[SO2 + SO42−], [NO3− ]/
[NO2 + NO3−]) both generally remain aloft long enough to be transported over long distance with high ratios of
0.8 over the Yellow Sea and Korean Peninsula at approximately 1.5–3 km; these results are consistent with the
altitude associated with significant cloud water perturbation. Nitrate induced aerosol effects more actively over
LRT exit area (Shanghai-the Yellow Sea), and by sulfate belatedly over LRT-entrance areas (Seoul-Tokyo). This
is due to the differences in chemical characteristics between nitrogen and sulfur oxidation in the atmosphere,
associated with its interaction with cloud water. An important oxidation process in sulfur chemistry is SO2 to
sulfuric acid which has very low vapor pressure and remains in the particle phase, and oxidation process is
taking place at large distances from the emission sources, except for the SO2 aqueous phase reaction process
where more rapid reactions can occur. Thus, these processes depend on the extent to which S O2-H2O2-O3-cloud
environments are a ctivated53,54. Nitrogen oxidation processes are relatively more complicated, involving the
O2-NOx-VOC cycle and N 2O5 night-time heterogeneous reactions. Our modeling and measurement analysis
of ACP effects were mainly focusing on secondary inorganic pollutants, particularly based on the high propor-
tion of SIA components in PM2.5 species over Seoul6. In recent studies, however, the roles of primary aerosol
components are also reported in association with LRT process. For example, the effects of primary aerosols (i.e.,
high BC) on meso-scale meteorological condition in North China Plain and Yangtze River delta in C hina55, and
56
also their association with secondary aerosol formations via heterogeneous reaction p rocess during the long-
range transport episodes in China. Such results are indicating the importance of aerosol chemical compositions
over the exit area of LRT process, and suggesting that the well-characterized components and its interaction via
radiative processes are together the key factors within clouds. Nevertheless, when we limiting the domain to the
Northeast Asia, the significant insights inferred from this study will give the reasons leading to the regulations
of SIA-ACP interactions in the atmosphere.
The current study provides significant insights into the roles of the LRT process for ACP interactions and spe-
cies-specific PM abatements. A more detailed study, including simultaneous and comprehensive, in-situ, aircraft,
and remote sensing measurements, is needed to improve the understanding of ACP interactions over Northeast
Asia. And the outcomes of aerosol effects from this study and related researches also need to be reflected to
operational air quality and meso-scale weather forecasting for better prediction capabilities over Northeast Asia.
Scientific Reports | (2022) 12:4870 | https://doi.org/10.1038/s41598-022-08854-1 7
Vol.:(0123456789)www.nature.com/scientificreports/
Methods
In situ observation. Long-term (1995–2019) trends for PM10 observed in South Korea were employed in
this study. PM10 measurements were collected from the entire area of the Korean Peninsula by using the National
Ambient Air Monitoring Information System (NAMIS) operated by the Korean Ministry of Environment
(KMOE) (https://www.airkorea.or.kr/, last accessed on 23 September 2021). Additional PM10 measurements in
Seoul (the capital city of South Korea), which is operated by Seoul Municipality (https://cleanair.seoul.go.kr/stati
stics/monthAverage, last access: 23 September 2021), were used for interpreting P M10 variations in Seoul. Sur-
face PM2.5 data were used for model verification over the upwind area obtained from the China National Envi-
ronmental Monitoring Center (CNEMC) available on its website (http://www.cnemc.cn, last access: 5 February
2022). We also used hourly measurements of sunshine duration (SD), cloud cover (CC), drizzle occurrences
(DO), and precipitation amounts (PA) over Korea, which have been provided by the Korea Meteorological
Administration (KMA, https://data.kma.go.kr/, last access: 24 June 2021), to analyse the long-term trends asso-
ciated with the cloud observational data. Here, the CC data were measured semiquantitatively in 3-h intervals on
a scale from 0/10 to 10/10, and the SD was measured on an hourly basis using a rotating-type EKO instrument
with an internal calibration system at all stations. The records of hourly PA were divided into four categories
of precipitation intensity following KMA g uidelines57: PA < 1 mm hr−1 (drizzle), 1 mm hr−1 ≤ PA < 3 mm hr−1,
3 mm hr−1 ≤ PA < 15 mm hr−1, and 15 mm hr−1 ≤ PA. The observed sunshine duration (SD) was used as a proxy
for atmospheric turbidity, which in turn was affected by aerosol-induced dimming and brightening phenom-
enon. As clouds and rainfall are mainly affected by the summer monsoon, we performed a model-measurement
study focusing on the spring season (March–April–May) when the atmospheric aerosol concentration was the
highest in Northeast Asia. The WRF-Chem evaluations are also made extensively by using the ‘hourly’ observed
SD, CC, and PA that were all of great importance, from the ACP perspectives.
Reanalysis data (MERRA‑2). We also employed satellite observations, the Modern-Era Retrospective
Analysis for Research and Applications, Version 2 (MERRA-2), to estimate and evaluate spatiotemporal trends
of simulated P M2.5 in Northeast Asia. MERRA-2 has a resolution of approximately 0.5° × 0.625° and 72 hybrid-
eta levels from the surface to 0.1 hPa55. The reanalysis data is computed on a latitude–longitude grid at the same
spatial resolution using a 3-D variation data assimilation (3DVAR) algorithm. The algorithm is based on the
Gridpoint Statistical Interpolation (GSI) with a 6-h update cycle using the Goddard Earth Observing System
Model, Version 5 (GEOS-5) with Atmospheric Data Assimilation System (ADAS), version 5.12.458,59. We used
the monthly mean aerosol optical depth (AOD) over the Northeast Asia domain since satellite data for PM10
was unavailable. The AOD is a parameter of the aerosol extinction coefficient integrated from the earth’s surface
to the top of the atmosphere, representing the attenuation of solar radiation caused by a erosols60. The AOD
reanalysis data were also used to indirectly verify the horizontal features of high P M2.5 plumes simulated by
WRF-Chem.
WRF‑Chem model data. The WRF-Chem (ver.3.9.1) model adopted here is a regional scale online mete-
orology-chemistry model, namely: Weather Research and Forecasting (WRF) model coupled with chemistry
modules61,62. In the WRF-Chem model, aerosol is acting as Cloud Condensation Nuclei (CCN), combined with
the cloud microphysics, and allows interactive feedbacks via two processes: (1) affecting cloud droplet number
and cloud radiative properties, and in turn (2) clouds alter aerosol size and composition via wet scavenging and
aqueous processes39. Natural dust from Mongolia and western China was considered by employing improved
dust scheme in WRF-Chem model. Details of WRF-Chem configuration together with employed dust scheme in
this study were found in Supplementary file. The model simulations were carried out from 1 March to 30 April
2018, when occurrence frequency of high PM events was relatively high. The horizontal and vertical configura-
tions over the WRF-Chem model domain (Figure S7) are as follows: (1) three nested domains with different
horizontal grid spacings of 27 km (d01), 9 km (d02), and 3 km (d03); and (2) vertical structures with 29 layers
in the terrain-following eta coordinate system. Meteorological initial boundary conditions were taken from the
6-hourly National Center for Environmental Prediction Final (NCEP/FNL) Operational Global Analysis data at
a horizontal resolution of 1° × 1°. The physical parameters of the WRF-Chem model used in this study are listed
in Table S1. Both online and offline simulations employed identical configurations including the horizontal and
vertical grids, microphysics option, and meteorological initial boundary conditions over the modelling domain.
In both simulations, a spin-up time of 5 days (1–5 March 2018) was applied. The characteristics of ACP pro-
cesses during the LRT of pollutants were explored by inferring the differences between with (online) and without
(offline) ACP interactions in two simulations. The online simulation considered aerosol-induced microphysics
for vertically integrated PM2.5, shortwave radiation, vertically integrated cloud water, and daily PA during the
LRT cases with high PM2.5 concentrations over Northeast Asia.
Graphics software. All contour plots were produced using Interactive Data Language (IDL, https://www.
harrisgeospatial.com/Software-Technology/IDL). All bar charts and scatter plots were plotted using the Sigma
Plot program (http://www.sigmaplot.co.uk/products/sigmaplot/sigmaplot-details.php).
Data availability
The MERRA-2 reanalysis data analysed during the current study are available at https://disc.sci.gsfc.nasa.gov.
All measured data and WRF-Chem results related to this paper are available from the corresponding author on
reasonable request.
Scientific Reports | (2022) 12:4870 | https://doi.org/10.1038/s41598-022-08854-1 8
Vol:.(1234567890)www.nature.com/scientificreports/
Received: 2 October 2021; Accepted: 4 March 2022
References
1. Guo, J. et al. Delaying precipitation and lightning by air pollution over the Pearl River Delta. Part I: Observational analyses. J.
Geophys. Res. Atmos. 121(11), 6472–6488 (2016).
2. Li, Z. et al. Aerosol and boundary-layer interactions and impact on air quality. Natl. Sci. Rev. 4(6), 810–833 (2017).
3. Li, M. et al. Anthropogenic emission inventories in China: A review. Natl. Sci. Rev. 4(6), 834–866 (2017).
4. Liu, M. et al. Fine particle pH during severe haze episodes in northern China. Geophys. Res. Lett. 44, 5213–5221 (2017).
5. Li, H. Y. et al. Nitrate-driven urban haze pollution during summertime over the North China Plain. Atmos. Chem. Phys. 18,
5293–5306 (2018).
6. Kim, H., Zhang, Q. & Sun, Y. Measurement report: Characterization of severe spring haze episodes and influences of long-range
transport in the Seoul metropolitan area in March 2019. Atmos. Chem. Phys. 20, 11527–11550 (2020).
7. Zhou, L. M., Dickinson, R. E., Dai, A. G. & Dirmeyer, P. Detection and attribution of anthropogenic forcing to diurnal temperature
range changes from 1950 to 1999: Comparing multi-model simulations with observations. Clim. Dyn. 35, 1289–1307 (2010).
8. Makar, P. A. et al. Feedbacks between air pollution and weather, Part 1: Effects on weather. Atmos. Environ. 115, 442–469 (2015).
9. Petaja, T. et al. Enhanced air pollution via aerosol-boundary layer feedback in China. Sci. Rep. 6, 18998 (2016).
10. Zhao, B. et al. Enhanced P M2.5 pollution in China due to aerosol-cloud interactions. Sci. Rep. 7, 4453 (2017).
11. Twomey, S., Piepgrass, M. & Wolfe, T. L. An assessment of the impact of pollution on global cloud albedo. Tellus Ser. B 36, 356–366
(1984).
12. Albrecht, B. A. Aerosols, cloud microphysics, and fractional cloudness. Science 245, 1227–1230 (1989).
13. Tao, W. K. et al. Role of atmospheric aerosol concentration on deep convective precipitation: Cloud-resolving model simulations.
J. Geophys. Res. 112, D24S18 (2007).
14. Sarangi, C., Tripathi, S. N., Tripathi, S. & Barth, M. C. Aerosol-cloud associations over Gangetic Basin during a typical monsoon
depression event using WRF-Chem simulation. J. Geophys. Res. 120(20), 10974–10995 (2015).
15. Rosenfeld, D. et al. Flood or drought: How do aerosols affect precipitation?. Science 321, 1309–1313 (2008).
16. Kant, S., Panda, J., Gautam, R., Wang, P. K. & Singh, S. P. Significance of aerosols influencing weather and climate over Indian
region. Int. J. Earth Atmos. Sci. 4(1), 1–20 (2017).
17. Kant, S., Panda, J. & Gautam, R. A seasonal analysis of aerosol-cloud-radiation interaction over Indian region during 2000–2017.
Atmos. Environ. 201, 212–222 (2019).
18. Koren, I., Kaufman, Y. J., Rosenfeld, D., Remer, L. A. & Rudich, Y. Aerosol invigoration and restructuring of Atlantic convective
clouds. Geophys. Res. Lett. 32, L14828 (2005).
19. Li, Z. et al. Aerosol and monsoon climate interactions over Asia. Rev. Geophys. 54(4), 866–929 (2016).
20. Fan, J., Wang, Y., Rosenfeld, D. & Liu, X. Review of aerosol-cloud interactions: Mechanisms, significance, and challenges. J. Atmos.
Sci. 73(11), 4221–4252 (2016).
21. Kant, S., Panda, J., Pani, S. K. & Wang, P. K. Long-term study of aerosol–cloud–precipitation interaction over the eastern part of
India using satellite observations during pre-monsoon season. Theor. Appl. Climatol. 136(1–2), 605–626 (2019).
22. Park, S. Y. & Kim, C. H. Interpretation of aerosol effects on precipitation susceptibility in warm clouds inferred from satellite
measurements and model evaluation over Northeast Asia. J. Atmos. Sci. 78, 1947–1963 (2020).
23. Kim, C. H. et al. Sulfur deposition simulations over China, Japan and Korea: A model intercomparison study for abating sulfur
emission. Environ. Sci. Pollut. Res. 19(9), 4073–4089 (2012).
24. Carmichael, G. R. et al. The MICS-Asia study: Model intercomparison of long-range transport and sulfur deposition in East Asia.
Atmos. Environ. 36(2), 175–199 (2002).
25. Liang, Q. et al. Long-range transport of Asian pollution to the northeast Pacific: Seasonal variations and transport pathways of
carbon monoxide. J. Geophys. Res. 109, D23S07 (2004).
26. Park, I. S. et al. Simulation of long-range transport of air pollutants over Northeast Asia using a comprehensive acid deposition
model. Atmos. Environ. 39(22), 4075–4085 (2005).
27. Uno, I. et al. Asian dust transported one full circuit around the globe. Nat. Geosci. 2(8), 557–560 (2009).
28. Liu, H. et al. Transport pathways for Asian pollution outflow over the Pacific: Interannual and seasonal variations. J. Geophys. Res.
108(D20), 8786 (2003).
29. Lin, C. et al. Long-range transport of aerosols and their impact on the air quality of Taiwan. Atmos. Environ. 39(33), 6066–6076
(2005).
30. Zhang, L. et al. Transpacific transport of ozone pollution and the effect of recent Asian emission increases on air quality in
North America: An integrated analysis using satellite, aircraft, ozonesonde, and surface observations. Atmos. Chem. Phys. 8(20),
6117–6136 (2008).
31. Li, C. et al. Transport and evolution of a pollution plume from northern China: A satellite-based case study. J. Geophys. Res. 115,
D00K03 (2010).
32. Li, C., Stehr, J. W., Marufu, L. T., Li, Z. Q. & Dickerson, R. R. Aircraft measurements of SO2 and aerosols over northeastern China:
Vertical profiles and the influence of weather on air quality. Atmos. Environ. 62, 492–501 (2012).
33. Lin, M. et al. Transport of Asian ozone pollution into surface air over the western United States in spring. J. Geophys. Res. 117,
D00V07 (2012).
34. Lee, H. J. et al. A case study of the transport/transformation of air pollutants over the Yellow Sea during the MAPS 2015 campaign.
J. Geophys. Res. Atmos. 124(12), 6532–6553 (2019).
35. Jo, Y. J. et al. Changes in inorganic aerosol compositions over the Yellow Sea area from impact of Chinese emissions mitigation.
Atmos. Res. 240, 104948 (2020).
36. Lee, H. J. et al. Ozone continues to increase in East Asia despite decreasing NO2: Causes and abatements. Remote Sens. 13(11),
2177 (2021).
37. Kim, C. H. et al. Comparative numerical study of P M2.5 in exit-and-entrance areas associated with transboundary transport over
China, Japan, and Korea. Atmosphere 12(11), 469 (2021).
38. Kim, C. H. et al. Long-term simulations of the sulfur concentrations over the China, Japan and Korea: A model comparison study.
Asia Pac. J. Atmos. Sci. 47(4), 399–411 (2011).
39. Kim, C. H. et al. A numerical study on indicators of long-range transport potential for anthropogenic particle matter over northeast
Asia. Atmos. Environ. 58, 35–44 (2012).
40. Kim, C.-H. et al. Meteorological overview and signatures of long-range transport processes during the MAPS-Seoul 2015 campaign.
Aerosol Air Qual. Res. 18(9), 2173–2184 (2018).
41. Dickerson, R. R. et al. Aircraft observations of dust and pollutants over northeast China: Insight into the meteorological mecha-
nisms of transport. J. Geophys. Res. 112, D24S90 (2007).
42. Miao, Y. et al. Impacts of synoptic condition and planetary boundary layer structure on the trans-boundary aerosol transport from
Beijing-Tianjin-Hebei region to northeast China. Atmos. Environ. 181, 1–11 (2018).
Scientific Reports | (2022) 12:4870 | https://doi.org/10.1038/s41598-022-08854-1 9
Vol.:(0123456789)www.nature.com/scientificreports/
43. Lee, H. J., Jo, H. Y., Kim, S. W., Park, M. S. & Kim, C. H. Impacts of atmospheric vertical structures on transboundary aerosol
transport from China to South Korea. Sci. Rep. 9(1), 13040 (2019).
44. Guo, X., Fu, D., Guo, X. & Zhang, C. A case study of aerosol impacts on summer convective clouds and precipitation over northern
China. Atmos. Res. 142, 142–157 (2014).
45. Park, S. Y., Lee, H. J., Kang, J. E., Lee, T. & Kim, C. H. Aerosol radiative effects on mesoscale cloud precipitation variables over
Northeast Asia during the MAPS-Seoul 2015 campaign. Atmos. Environ. 172, 109–123 (2018).
46. Zheng, Z. et al. Diurnal variation of summer precipitation modulated by air pollution: Observational evidences in the Beijing
Metropolitan Area. Environ. Res. Lett. 15(9), 094053 (2020).
47. Kang, J. Y., Bae, S. Y., Park, R. S. & Han, J. Y. Aerosol indirect effects on the predicted precipitation in a global weather forecasting
model. Atmosphere 10(7), 392 (2019).
48. Li, Z. et al. East Asian study of tropospheric aerosols and their impact on regional clouds, precipitation, and climate (EAST-
AIRCPC). J. Geophys. Res. Atmos. 124(23), 13026–13054 (2019).
49. Kim, Y. P. & Lee, G. Trend of air quality in Seoul: Policy and science. Aerosol Air Qual. Res. 18, 2141–2156 (2018).
50. World Meteorological Organization (WMO). Manual on the observation of clouds and other meteors. WMO Publ. 407, 111 pp
(1975). https://cloudatlas.wmo.int/en/drizzle.html.
51. Jo, H. Y. & Kim, C. H. Identification of long-range transported haze phenomena and their meteorological features over Northeast
Asia. J. Appl. Meteorol. Climatol. 52(6), 1318–1328 (2013).
52. Lee, H. J., Kang, J. E. & Kim, C. H. Forty-year (1971–2010) semiquantitative observations of visibility-cloud-precipitation in Korea
and its implication for aerosol effects on regional climate. J. Air Waste Manag. Assoc. 65(7), 788–799 (2015).
53. Kim, C. H., Kreidenweis, S. M., Feingold, G., Frost, G. J. & Trainer, M. K. Modeling cloud effects on hydrogen peroxide and meth-
ylhydroperoxide in the marine atmosphere. J. Geophys. Res. 107(D2), AAC7-1–14 (2002).
54. Kreidenweis, S. M. et al. Modification of aerosol mass and size distribution due to aqueous-phase S O2 oxidation in clouds: Com-
parisons of several models. J. Geophys. Res. 108(D7), AAC-1-12 (2003).
55. Zhang, J. et al. Trans-regional transport of haze particles from the north China Plain to Yangtze River Delta during winter. J.
Geophys. Res. Atmos. 126(8), e2020JD033778. https://doi.org/10.1029/2020JD033778 (2021).
56. Huang, X. et al. Amplified transboundary transport of haze by aerosol-boundary layer interaction in China. Nat. Geosci. 13(6),
428–434 (2020).
57. Korea Meteorological Administration (KMA). Guidance of surface meteorological observation (in Korean); 2002.
58. Gelaro, R. et al. The modern-era retrospective analysis for research and applications, version 2 (MERRA-2). J. Clim. 30, 5419–5454
(2017).
59. Yang, S. H., Jeong, J. I., Park, R. J. & Kim, M. J. Impact of meteorological changes on particulate matter and aerosol optical depth
in Seoul during the months of June over recent decades. Atmosphere 11(12), 1282 (2020).
60. Kong, L. B., Xin, J. Y., Zhang, W. Y. & Wang, Y. S. The empirical correlations between PM2.5, PM10 and AOD in the Beijing metro-
politan region and the PM2.5, PM10 distributions retrieved by MODIS. Environ. Pollut. 216, 350–360 (2016).
61. Grell, G. A. et al. Fully coupled “online” chemistry within the WRF model. Atmos. Environ. 39(37), 6957–6975 (2005).
62. Skamarock, W. C. et al. A description of the advanced research WRF version 3 Technical Note 475 + STR. Boulder, CO, USA:
National Center for Atmospheric Research (2008).
Acknowledgements
The study was supported by the Basic Science Research Program through the National Research Foundation
of Korea (NRF) funded by the Ministry of Education (2020R1A6A1A03044834 and 2019R1I1A1A01060445).
Authors acknowledge NASA for providing MERRA2 reanlaysis data through https://disc.gsfc.nasa.gov and all
staff of Air Korea for in situ Korean measurement data.
Author contributions
H.J.L. and C.H.K. contributed to the design of the research and the interpretation of the results. Y.J.J., S.K., D.K.,
J.M.K. and D.C. plotted the figures and analysed the results. H.J.L. and C.H.K. wrote the paper. Y.J.J., H.Y.J., J.B.,
S.Y.P. and W.B.J. discussed the results and commented on the manuscript.
Competing interests
The authors declare no competing interests.
Additional information
Supplementary Information The online version contains supplementary material available at https://doi.org/
10.1038/s41598-022-08854-1.
Correspondence and requests for materials should be addressed to C.-H.K.
Reprints and permissions information is available at www.nature.com/reprints.
Publisher’s note Springer Nature remains neutral with regard to jurisdictional claims in published maps and
institutional affiliations.
Open Access This article is licensed under a Creative Commons Attribution 4.0 International
License, which permits use, sharing, adaptation, distribution and reproduction in any medium or
format, as long as you give appropriate credit to the original author(s) and the source, provide a link to the
Creative Commons licence, and indicate if changes were made. The images or other third party material in this
article are included in the article’s Creative Commons licence, unless indicated otherwise in a credit line to the
material. If material is not included in the article’s Creative Commons licence and your intended use is not
permitted by statutory regulation or exceeds the permitted use, you will need to obtain permission directly from
the copyright holder. To view a copy of this licence, visit http://creativecommons.org/licenses/by/4.0/.
© The Author(s) 2022
Scientific Reports | (2022) 12:4870 | https://doi.org/10.1038/s41598-022-08854-1 10
Vol:.(1234567890)You can also read