USDA Projections to 2030 - UC Davis
←
→
Page content transcription
If your browser does not render page correctly, please read the page content below

The world’s GDP was $80 trillion in
Rural 2020 (2015 dollars), including $19
trillion in the US, $16.3 trillion in the
EU, $14.5 trillion in China, $4.3 trillion
Migration
in Japan, and $1.1 trillion in Mexico.
Per capita incomes in 2020 (2015
dollars) averaged $10,500 glob-
News
ally and were $56,600 in the US,
$31,300 in the EU, $10,400 in China,
$34,600 in Japan, and $8,600 in
Mexico. China’s GDP is expected
to increase by five percent a year
Blog 226 between 2021 and 2030, double the
2.5 percent economic growth rate of
JULY 2021 Mexico.
Crops
USDA Projections to 2030
The prices of corn, soybeans, and
USDA’s projections of agricultural The two major factors that deter- wheat are projected to remain at
production and trade during the mine the global demand for food about $10, $5, and $4 a bushel,
2020-30 decade anticipate stable are the number of people and their respectively, over the next decade,
production and prices of field crops incomes. USDA begins with a world with fewer year-to-year price fluctua-
such as corn and soybeans, and population of 7.6 billion in 2020, and tions than between 2011 and 2020.
slightly rising production and prices assumes that population growth
for milk and meat due to increased will slow from 1.1 percent a year The planted acreage of eight major
demand for these animal products between 2011 to 2020 to 0.9 per- US field crops is expected to remain
abroad. The US is expected to cent a year between 2021 and 2030. at about 250 million acres, led by
remain a net exporter of agricultural The ex-USSR is expected to have 90 million acres of corn, 90 million
commodities, but the agricultural a stable population, while Africa’s acres of soybeans, and 45 million
trade surplus is projected to decline population is expected to increase acres of wheat.
as fruit and vegetable imports rise by 2.5 percent a year.
faster than exports.
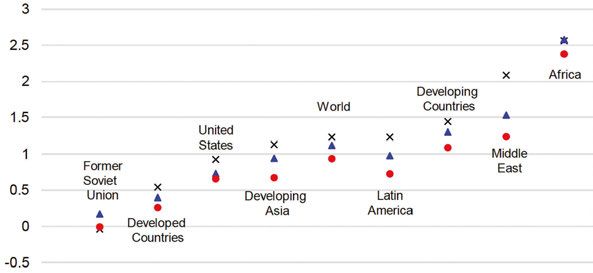
World Population Growth is Expected to Slow to Less than 1% a Year from 2021-30
World Population Growth Rates, 2001–30
Average annual growth rate (percent)
x 2001–2010 2011–2020 2021–2030(f)
Note: Developing Asia = Asia less Japan. Source: U.S. Department of Commerce. Bureau of the Census.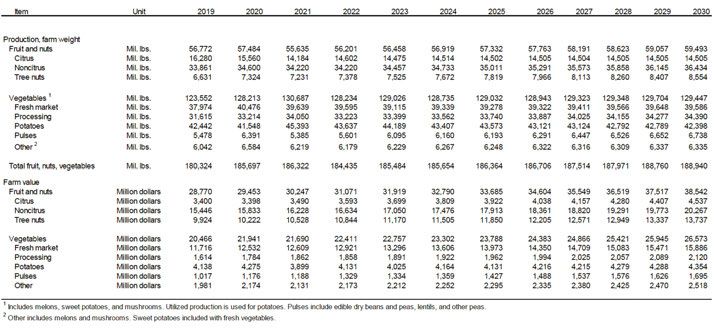
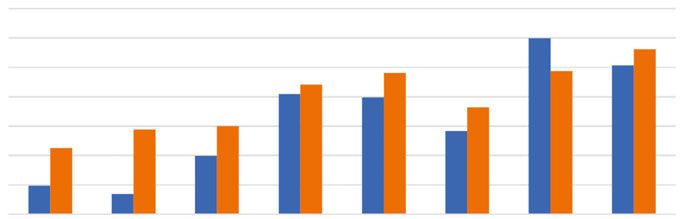
Economic Growth is Expected to be Faster from 2021-30 in All Regions Except East Asia

   Real gross domestic product growth by developed and developing country regions, 2011–30
   Average annual percent change
   7

   6

   5

   4

   3

   2

    1

   0
           All         Latin      Middle East      All       Southeast      Sub-Saharan    East Asia    South Asia
        developed     America      & North      developing     Asia            Africa      (-Japan)
                                    Africa
                                                 2011–20     2021–30

Corn, Soybean, and Wheat Prices are Expected to Remain Stable from 2021-30

  Corn, soybean, and wheat price, 2000–30
  Dollars per bushel

The value of US-produced fruit (38      nuts and less valuable vegetables        and three fourths of processed veg-
percent of total FNV value), tree       is projected to widen during the         etables involve tomatoes.
nuts (21 percent), and vegetables (41   2020s.                                   By weight, fruit is 27 percent of the
percent), is projected to increase 27                                            186 billion pounds of US fruits, nuts,
percent from $51 billion in 2020 to     About 60 percent of US vegetables        and vegetables produced in 2020,
$65 billion in 2030 for fruits, nuts,   by value are fresh, some of which        tree nuts five percent, and vegeta-
and vegetables. The value of fruit      come from greenhouses and other          bles 68 percent.
and nuts surpassed the value of         protected culture structures for
vegetables in 2010, and the gap         which USDA has limited data. A quar-
between more valuable fruit and         ter of US vegetables are processed,
Corn, Soybeans, and Wheat Account for 90 Percent of Field Crop Acreage
 Table 5: U.S. acreage for major field crops and Conservation Reserve Program (CRP) assumptions, long-term projections

 Fruits and Tree Nuts are 57% of the $51 Billion Value of FNV Crops
   Farm value of U.S. fruit, nut, and vegetable production, 2000–30
   Billion dollars

Livestock                                Trade

Average meat consumption is              The US has had an agricultural trade
expected to increase by a pound          surplus since 1960. The agricultural
a year to 228 pounds per person          trade surplus topped $25 billion in
by 2030, including 101 pounds of         1981, 1995-96, and 2008-14, but is
chicken, 58 pounds of beef, and 51       now less than $20 billion and shrink-
pounds of pork.                          ing because US farm exports are
                                         primarily relatively low value grain
The production of milk is expected       crops while imports include more
to increase by 1.1 percent a year to     valuable fresh fruits and vegetables.
248 billion pounds in 2030. The          The value of fresh fruit and vegeta-
number of cows is projected to           ble imports is projected to increase
remain stable at 9.4 million, but milk   from $24 billion in 2020 to $37
per cow is projected to increase to      billion in 2030.
an average 26,300 pounds a year.
Rising milk production could put
downward pressure on milk prices.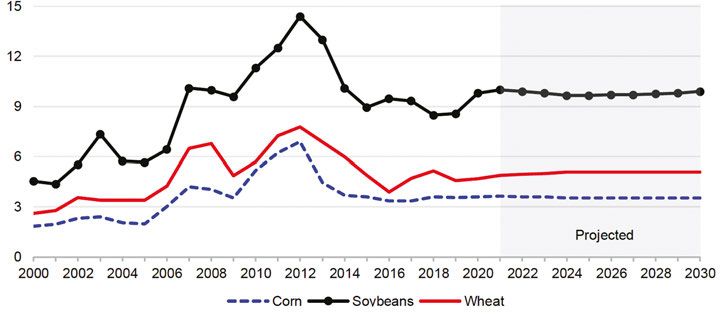
The $16 Billion Value of U.S. Noncitrus Fruit in 2020 Exceeded the $13 Billion Value of Fresh Vegetables

Table 17: Fruit, nuts, and vegetables long-term projections

Chicken Accounts for 44 Percent of U.S. Meat Consumption
  U.S. per capita meat disappearance, 2000–30
  Pounds per capita, retail weight

                                                        References
USDA Agricultural Projections to 2030. https://www.usda.gov/sites/default/files/documents/USDA-Agricultural-
Projections-to-2030.pdf

https://www.usda.gov/oce/commodity-markets/baseline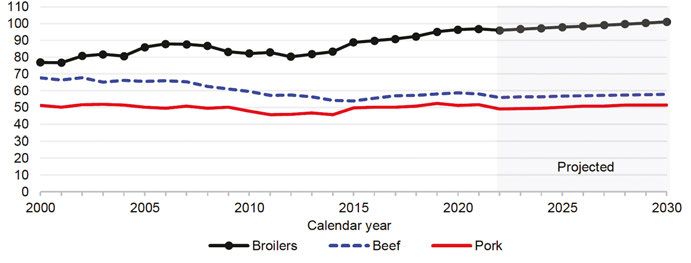
A Stable Number of Cows in Projected to Produce More Milk

 Table 24: Dairy long-term projections

 The U.S. Farm Trade Surplus is Projected to Shrink by 2030
  U.S. agricultural trade long-term projections
  Billion dollars
  200
   180
   160
   140
   120
  100
   80
   60
                                                                                           Projected
   40
   20
     0
     2000                2005                 2010           2015               2020         2025      2030
                                                           Fiscal Year
                                               Exports       Imports           Surplus

To subscribe to RMN blogs, send email to ruralmigrationnews-subscribe@primal.ucdavis.edu
More at: https://migration.ucdavis.edu/rmn/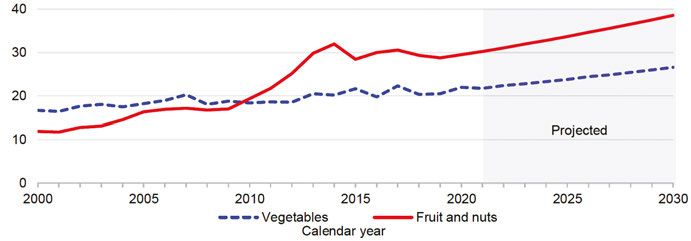
You can also read