W.E. (WINDSOR-ESSEX) CHILD CARE AND EARLY YEARS SERVICE SYSTEM PLAN - 2020-2025 WINDSOR-ESSEX COUNTY CHILD AND YOUTH PLANNING COMMITTEE
←
→
Page content transcription
If your browser does not render page correctly, please read the page content below

WINDSOR-ESSEX COUNTY CHILD AND YOUTH PLANNING COMMITTEE

    W.E. (WINDSOR-ESSEX)
CHILD CARE AND EARLY YEARS
    SERVICE SYSTEM PLAN
           2020-2025
THE PLAN

CONTENT
INTRODUCTION                                                           1

BACKGROUND                                                             3

WINDSOR-ESSEX COUNTY CHILDREN AND YOUTH COMMITTEE
                                                                       5
(CYPC)

CYPC: VISION AND MISSION                                               6

HIGHLIGHTS OF ONGOING PLANNING & PRIORITIES IN CHILD CARE
                                                                       7
& EARLY YEARS

BEST START NEIGHBOURHOODS (BSN)                                        9

POPULATION                                                             10

POPULATION PROJECTIONS                                                 12

POPULATION BEST START NEIGHBOURHOODS                                   13

EARLY DEVELOPMENT INSTRUMENT (EDI)                                     15

SOCIAL RISK INDEX                                                      21

EQAO RESULTS                                                           25

EARLYON HIGHLIGHTS                                                     29

EARLY YEARS PROGRAMS                                                   30

CHILD CARE HIGHLIGHTS                                                  33
THE PLAN

CONTENT
LICENSED CHILD CARE PROGRAMS                                34

CHILD CARE SUBSIDY                                          40

AUTHORIZED RECREATION AND SKILL BUILDING
                                                            43
PROGRAMS

LIBRARIES                                                   46

SPECIAL NEEDS RESOURCING HIGHLIGHTS                         47

INCLUSION                                                   48

EARLY YEARS INDIGENOUS LED HIGHLIGHTS                       51

APPROACH TO DEVELOPING THE SERVICE SYSTEM PLAN              52

PRIORITIES SERVICE SYSTEM PLAN                              54

APPENDIX A: SUMMARY OF COMMUNITY PLANS                      59

APPENDIX B: MAPS, BEST START NEIGHBOURHOODS                 64

APPENDIX C: MAPS, CYCLE 5 EDI                               66

APPENDIX D: TERMS OF REFERENCE                              74
WE BUILD

EXPERIENCES
“Early childhood programs provide environments and experiences
to engage children in active, creative, and meaningful exploration,
play and inquiry.”

- How Does Learning Happen

INTRODUCTION
The City of Windsor is the Consolidated Municipal Service Manager (CMSM) for Children’s Services in
Windsor and Essex County. As the CMSM, the City of Windsor, Children’s Services is responsible for
planning and managing licensed child care services in the region, ensuring an increasingly integrated, high‐
quality child care and early years system that is governed and funded by the Ministry of Education.
Section 56 of the Child Care and Early Years Act (CCEYA) 2014 states that:
“....a service system manager shall,
(a) develop and administer local policies respecting the operation of child care and early years programs
and services;
(b) administer the delivery of financial assistance provided by the Minister under clause 54 (1) (b), in
accordance with the regulations;
(c) coordinate the planning and operation of child care and early years programs and services with the
planning and provision of other human services delivered by the service system manager;
(d) assess the economic viability of the child care and early years programs and services in the service area
and, if necessary, make or facilitate changes to help make such programs and services economically viable;
(e) perform such other duties as may be prescribed by the regulations.
The City of Windsor, Children’s Services coordinates and manages child care and early years programs
and services guided by a Child Care and Early Years Service System Plan. The Windsor‐Essex Child Care
and Early Years Service System Plan 2020‐2025 highlights the progress made to date related to the
priorities set out in the previous community plan for the child care and early years system, and provides
a blueprint for the strategic focus and direction of Children’s Services in Windsor‐Essex County.
The Children’s Services sector has a strong focus on moving toward an increasingly integrated system of
services for families and children. The Windsor‐Essex Child Care and Early Years Service System Plan
2020‐2025 was developed based on community need that was determined through extensive
consultations with more than 4,000 individuals including:
Children Representatives from early
Parents years programs
Caregivers Representatives from the
Representatives from Indigenous Community
community agencies Representatives from the
Representatives from Francophone Community
school boards Recent Immigrants
Representatives from child
care agencies
W.E. Child Care and Early Years Service System Plan | 2020‐2025 1|Page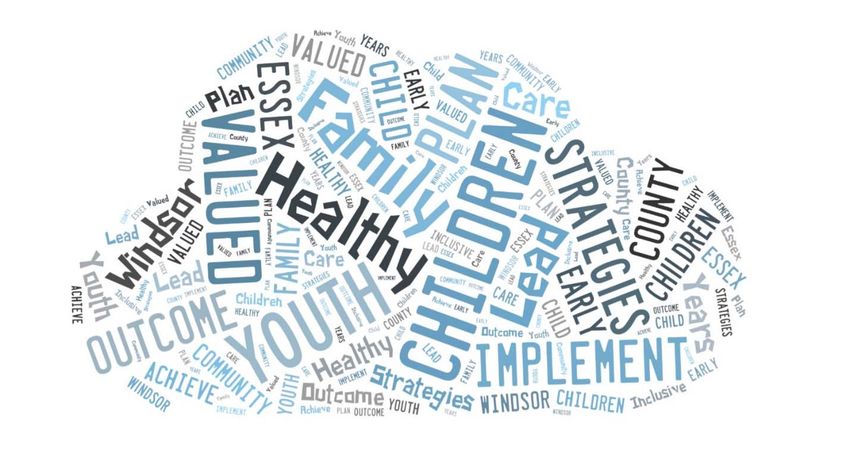
INTRODUCTION

  The Windsor‐Essex Child Care and Early Years Service System Plan 2020‐2025 has constructed
  the community priorities around the four components of Ontario’s Vision:

Four Components of Ontario's Vision for Child Care and Early Years

 Accessibility             Responsiveness                    Affordability        High‐Quality

  The Windsor‐Essex Child Care and Early Years Service System Plan 2020‐2025 is designed to
  support high‐quality child care and early learning experiences that are accessible for all
  children and families in a system that is coordinated to assist children and families. This will
  result in a community where all children, youth and families are healthy and valued.

  W.E. Child Care and Early Years Service System Plan | 2020‐2025                           2|Page
BACKGROUND
The child care and early years system in Ontario has experienced significant changes over the past 10
years.

In 2009, Dr. Charles Pascal was commissioned by the Province as a Special Advisor on Early Learning. He
authored the report With Our Best Future in Mind: Implementing Early Learning in Ontario. Based on
the recommendations in the report, the child care and early years system began experiencing some of
the biggest changes in a generation.

As a result of Dr. Pascal’s report, in 2010, Ontario saw the introduction of full‐day kindergarten with an
emphasis on play‐based learning and integrated before and after school programs.

                                                     In 2014, How Does Learning Happen? Ontario’s
                                                     Pedagogy for the Early Years was introduced. How
                                                     Does Learning Happen? was “designed to provoke
                                                     deeper thinking about the delivery of high‐quality
                                                     programs and services for children and families in
                                                     early years settings across Ontario.”

In April of 2014, the Provincial government also announced a new strategy for special needs services,
“Putting it All Together: A Strategy for Special Needs Services that Make Sense for Families.” This is
a four Ministry strategy (Ministries of Children and Youth Services, Community and Social Services,
Education, and Health and Long‐Term Care) designed to improve services for children and youth with
special needs and their families. This strategy identified three key areas where improvements will be
made. These include:
o Putting in place a new, voluntary standard developmental screen
o Establishing coordinated service planning processes for children with multiple and/or
    complex special needs in communities
o Implementing integrated delivery of children’s rehabilitation services

W.E. Child Care and Early Years Service System Plan | 2020‐2025                                3|Page
BACKGROUND
In August of 2015, the Child Care and Early Years Act 2014 replaced the Day Nurseries Act.
In 2017, the Provincial government released the Ontario Renewed Early Years and Child Care
Policy Framework. This policy document outlines the provincial government’s strategic
direction for the early years and child care system with a focus on seven areas:
Increasing access to early years and child care
programs and services
Ensuring a more affordable early years and child care
system
Establishing an early years workforce strategy
Determining a provincial definition of quality in the
early years
Developing an approach to promoting inclusion in early
years and child care settings
Creating an outcomes and measurement strategy
Increasing public awareness of Ontario’s early years
and child care system
Ontario’s vision for children and families as stated in Ontario’s
Renewed Early Years and Child Care Policy Framework:
“All children and families have access to a range of high‐
quality, inclusive and affordable early years and child care
programs and services that are child‐and family‐centred and
contribute to children’s learning, development
and well‐being.”
W.E. Child Care and Early Years Service System Plan | 2020‐2025 4|Page
WINDSOR‐ESSEX
COUNTY CHILDREN AND YOUTH PLANNING COMMITTEE (CYPC)
The Windsor‐Essex County Children and Youth Planning Committee (CYPC) is comprised of
representatives from a range of agencies and sectors that reflect the unique composition of our
communities. This committee is chaired by the City of Windsor, Manager of Children’s Services.

The CYPC has five networks or sub‐committees. Each network works to support the intent of the
committee with open communication and information brought forward and shared so all are aware of
the work in progress. Each network has its own Terms of Reference. The chair of each network is a
member of the CYPC. The network chairs provide updates to the CYPC on the work of the networks. In
some cases, the chair of the network brings a recommendation for approval and/or a document for
review and input.

The Windsor‐Essex County Children and Youth Planning Committee (CYPC) is working to build an
effective integrated system of services that supports children, youth and their families (see Appendix
for Membership & Terms of Reference). The committee provides leadership for this process in the
form of input, advice and recommendations. This serves to inform broader system planning in an effort
to integrate services into a system of seamless service experiences for children 0‐12. One approach in
moving towards achieving an integrated system of services in Windsor‐Essex County is collaborating on
the development of the Child Care and Early Years Service System Plan.

                                               Inclusion
                                               Network

                                                                          EarlyON Child
             Child Care            Windsor‐Essex                           and Family
              Network                                                         Centre
                                       County                               Network
                                    Children and
                                   Youth Planning
                                     Committee
                           Urban
                         Indigenous                               Professional
                         Early Child                              Development
                        Development                                 Network
                          Network

W.E. Child Care and Early Years Service System Plan | 2020‐2025                              5|Page
VISION & MISSION
  In 2019, the CYPC, as a collective reaffirmed the vision and mission statement as follows:

         Vision: All children, youth and families are healthy and valued.
Mission Statement: Through a collaborative, integrated approach, we plan,
  lead and implement strategies to achieve the best outcomes for children,
                youth and families in Windsor‐Essex County.

  This image is comprised of key words from the vision and mission statement of the CYPC. It was created
  as a reminder that this is what is important for building a foundation for children and their families in
  Windsor‐Essex County.

  The Windsor‐Essex County Children and Youth Planning Committee (CYPC) concur that the vision and
  mission statement will be revisited as we continue to revisit and update the Child Care and Early Years
  Service System Plan.

  W.E. Child Care and Early Years Service System Plan | 2020‐2025                               6|Page
HIGHLIGHTS OF
ONGOING PLANNING & PRIORITIES IN CHILD CARE & EARLY YEARS
Previous Community Plan: Priorities
Access System Hubs
Highlights of progress on previous community plan priorities for child care and early years as
identified by the CYPC.
Access to Services
The EarlyON Child and Family Centre (EarlyON CFC) Network works collaboratively to coordinate
programs and services across Best Start Neighbourhoods to ensure increased access for children
and families in Windsor‐Essex. This includes:
o evening and weekend programming
o pop‐up and mobile EarlyON CFC opportunities
o community outreach
As the Special Needs Resourcing stakeholder in Windsor‐Essex, Children First Resource
Consultants, regularly visit all licensed child care centres in Windsor‐Essex to provide
consultation, support and training for child care staff working with children who have special
needs.
Program Support funding has increased child care options for parents and has allowed more
children to attend programs throughout Windsor‐Essex. Options have expanded from licensed
child care to also include Recreation and Skills Building Programs. (Program Support funding is
used to reduce child:teacher ratios in age groupings that have a demonstrated need for
additional support.)
As the Indigenous Stakeholder, Ska:Na Family Learning Centre has hired a Cultural Language
Specialist to provide consultation for the child care and early years community in Windsor‐Essex
to increase awareness of Indigenous cultures and practices.
As a designated French Language community, a bilingual Early Literacy Specialist has been hired
to ensure that French programming is available across all EarlyON CFCs in Windsor‐Essex.
OneHSN ‐ Child Care Registry system is a one‐stop shop for families wanting to access child care
and apply for licensed child care/recreation programs from the comfort of their home, allowing
families to view a map of all licensed child care/recreation program options in Windsor‐Essex.
Child Care – since 2014, the number of elementary schools with before and after school
programs has increased allowing more school‐age children to access licensed child care.
Child Care – Capital Initiatives have increased licensed child care spaces for infant, toddler,
preschool and school‐age children.
Child Care – An Affordability Project was introduced because of the Child Care Environmental
Scan in order to respond to the needs of the community. The Affordability Project reduces daily
child care rates for families in Windsor‐Essex accessing licensed child care for infants, toddlers
and preschoolers.
W.E. Child Care and Early Years Service System Plan | 2020‐2025 7|PageHIGHLIGHTS OF
ONGOING PLANNING & PRIORITIES IN CHILD CARE & EARLY YEARS
Hubs/System Coordination
The EarlyON Child and Family Centre Network coordinates system wide initiatives such as:
o professional development for the EarlyON CFC Facilitators
o program promotion and advertising for all EarlyON CFCs in Windsor‐Essex
o consistent programs, services and materials at all EarlyON CFCs
o common visual identity for all EarlyON CFC Facilitators through branded shirts and
jackets
o use of EarlyON CFC flags to signal that centres are open
o Children First Resource Consultants are meeting families at all EarlyON CFCs for further
evaluations and connections to child care
OneHSN ‐ Child Care Registry System provides increased access for families and reduces the wait
times from initial application for child care and/or child care subsidy through a coordinated
system
OneHSN ‐ Child Care Registry System provides advertising for the licensed child care centres
Virtual Hub – To avoid creating a separate website that could cause possible confusion for
families, the City of Windsor ‐ Children’s Services website underwent changes to become more
reflective of a virtual hub. The Children’s Services website provides information for
parents/caregivers, child care providers, early learning professionals or any other person seeking
information regarding child care and early years programs and services in Windsor‐Essex. The
two domain names are:
o www.childrensserviceswindsoressex.ca
o www.earlyonwindsoressex.ca
Commercials were created and advertising was developed to promote licensed child care and
child care subsidy in Windsor‐Essex increasing visibility of the child care system
WEE Start Committee is a team of community partners collaborating to increase early
identification of children with special needs
in order to foster early intervention
Ontario Infant Hearing Program is promoting
EarlyON CFCs to all families in the program
Partnership with the Welcome Centre Shelter
for Women & Families, Hotel Dieu Grace ‐
Regional Children Centre (Triple P) and City of
Windsor directly operated EarlyON CFC to
provide parenting support programs and
community connections for families
experiencing homelessness
W.E. Child Care and Early Years Service System Plan | 2020‐2025 8|PageFAMILIES LIVING IN WINDSOR-ESSEX PROMOTE SENSE OF BELONGING “Every child has a sense of belonging when he or she is connected to others and contributes to his or her world” - How Does Learning Happen
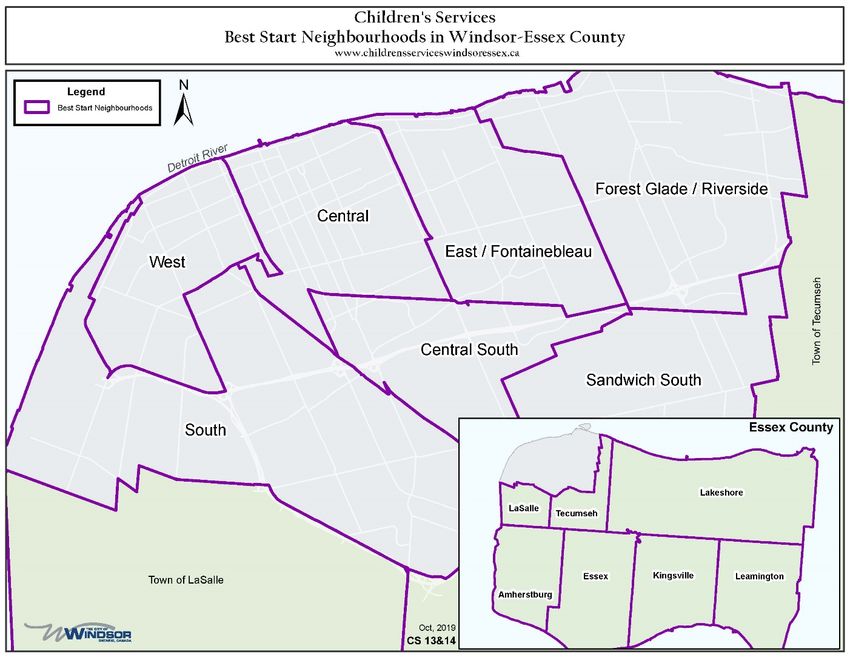
BEST START
NEIGHBOURHOODS (BSN)
Consistent usage of boundaries is critical in making comparisons of data over periods of time and in
making comparisons between neighbourhoods or other geographies. Best Start Neighbourhoods were
established in partnership with the former Best Start Network (now CYPC) in 2006. Best Start
Neighbourhoods are geographical areas in Windsor‐Essex used by the City of Windsor, Children’s
Services for planning purposes. The BSNs were established in line with the concept of schools first and
with the notion of a hub of child care and early years services that was accessible to children and
families living in Windsor‐Essex. Child care and early years Community Partners are encouraged to adopt
the same boundaries to facilitate planning, information sharing and collaboration.
A total of seven (7) BSNs have been established for the City of Windsor and seven (7) BSNs have been
established for Essex County.
Best Start Neighbourhoods
City of Windsor Essex County
Forest Glade/Riverside Amherstburg
East Windsor/Fontainebleau LaSalle
West Lakeshore
Central Essex
Central – South Leamington
Sandwich South & Industrial Area Kingsville
South Tecumseh
W.E. Child Care and Early Years Service System Plan | 2020‐2025 9|PagePOPULATION
WINDSOR‐ESSEX
The overall population in Windsor‐Essex has grown since 2001. The population of children 0 to 14
years of age in contrast to the overall population has declined slightly in Windsor‐Essex County since
2001. The overall decrease for 0 to 14 year olds has been approximately 11.7% during this time period.
The largest decrease was experienced between 2006 and 2011 and only a small decrease was seen
between 2011 and 2016. Data for this section on population has been sourced from Statistics Canada.
Total Population: Windsor‐Essex
2001 2006 2011 2016
0 to 4 Years 23,660 23,205 21,100 20,210
5 to 9 Years 24,810 22,930 22,710
51,925
10 to 14 Years 26,935 24,460 23,765
0 to 14 Years 75,585 74,950 68,490 66,685
Overall Population 374,975 393,405 388,785 398,730
Source: Statistics Canada, 2016
Population of Children 0 ‐ 14 Years Old:
Windsor‐Essex
2016
2011
2006
0 10,000 20,000 30,000 40,000 50,000 60,000 70,000 80,000
0 to 14 Years 10 to 14 Years 5 to 9 Years 0 to 4 Years
W.E. Child Care and Early Years Service System Plan | 2020‐2025 10 | P a g ePOPULATION
WINDSOR‐ESSEX
The population of 0 to 14 year olds in Windsor decrease by 10.9% from 2001 to 2016; again, with the
largest decrease occurring between 2006 and 2011. This is in contrast to the overall population in the
City, which experienced an increase in population by 4.2% during the same time period.
Population: Windsor‐Essex, City
Age 2001 2006 2011 2016
0 to 4 Years 13,155 12,795 11,855 11,170
5 to 9 Years 12,985 11,975 11,990
26,495
10 to 14 Years 13,700 12,455 12,165
0 to 14 Years 39,650 39,480 36,285 35,325
Overall Population 208,402 216,476 210,890 217,195
Source: Statistics Canada, 2016
Essex County Population Analysis for 0 to 14 Year Olds
The population of 0 to 14 year old in Essex County decreased by 12.7% from 2001 to 2016; again, with
the largest decrease occurring between 2006 and 2011. This is in contrast to the overall population in
the County, which increased 8.9% during the same time period.
Population: Windsor‐Essex, County
Age
2001 2006 2011 2016
0 to 4 Years 10,505 10,410 9,245 9,040
5 to 9 Years 11,825 10,955 10,720
25,430
10 to 14 Years 13,235 12,005 11,600
0 to 14 Years 35,935 35,470 32,205 31,360
Overall Population 166,573 176,929 177,895 181,535
Source: Statistics Canada, 2016
W.E. Child Care and Early Years Service System Plan | 2020‐2025 11 | P a g ePOPULATION
PROJECTIONS WINDSOR‐ESSEX
The overall population of 0 to 14 year olds in Windsor‐Essex is expected to grow over the years of
2017 to 2025. It is expected that the 0 to 4 year population will experience the greatest amount of
growth, followed by the 5 to 9 year olds. The 10 to 14 year olds will experience a slight decrease in
population over this time period. Overall, the population of 0 to 14 year olds is expected to be stable
with no spikes or decreases from 2017 to 2025.
The following table outlines the population projection for 0 to 14 year olds in Windsor‐ Essex for each
year from 2017 to 2025.
Population Projections 0‐14 Year Olds, 2017–2025
Year 0–4 5–9 10–14
2017 20,800 22,115 23,888
2018 20,832 21,927 23,964
2019 20,920 21,817 23,873
2020 21,025 21,812 23,696
2021 21,152 21,911 23,474
2022 21,270 22,054 23,237
2023 21,598 22,047 23,003
2024 21,870 22,114 22,865
2025 22,103 22,209 22,845
Source: Statistics Canada 2016
Population Projections 2017–2025: Windsor‐Essex
10–14
5–9
0–4
19,000 19,500 20,000 20,500 21,000 21,500 22,000 22,500 23,000 23,500 24,000 24,500
2025 2024 2023 2022 2021 2020 2019 2018 2017
W.E. Child Care and Early Years Service System Plan | 2020‐2025 12 | P a g ePOPULATION
BEST START NEIGHBOURHOODS
The following table below outlines where children 0 to 14 years old live, by Best Start Neighbourhood,
in Windsor and Essex County. Note that data is only available for all age groups in 2011 and 2016.
2001, 2006 and 2011 data are available for the 0 to 4 age group.
Population Based on Best Start Neighbourhood: City
BSN Age Group 2001 2006 2011 2016
0 to 4 2,945 2,473 2,343 2,295
Central 5 to 9 2,069 2,085
10 to 14 2,193 1,915
0 to 4 960 991 837 825
Central South 5 to 9 942 930
10 to 14 1,045 1,045
0 to 4 2,510 2,950 2,691 2,375
5 to 9 3,219 3,190
South
10 to 14 3,414 3,520
0 to 4 1,710 1,372 1,304 1,225
West 5 to 9 1,101 1,215
10 to 14 1,139 980
East/ 0 to 4 2,355 2,006 1,799 1,710
Fontainebleau 5 to 9 1,729 1,730
10 to 14 1,801 1,740
Sandwich South 0 to 4 90 30 20 20
& Industrial Zone 5 to 9 20 20
10 to 14 40 30
0 to 4 2,680 3,054 2,851 2,720
Forest Glade/ 5 to 9 2,901 2,820
Riverside
10 to 14 2,794 2,935
W.E. Child Care and Early Years Service System Plan | 2020‐2025 13 | P a g ePOPULATION
BEST START NEIGHBOURHOODS
Population Based on Best Start Neighbourhood: County
BSN Age Group 2001 2006 2011 2016
0 to 4 1,765 1,770 1,500 1,495
Lasalle 5 to 9 1,890 1,900
10 to 14 2,085 2,140
0 to 4 1,030 1,190 775 805
Tecumseh 5 to 9 1,115 985
10 to 14 1,305 1,240
0 to 4 2,377 2,170 2,240 2,020
Lakeshore 5 to 9 2,753 2,625
10 to 14 2,906 2,810
0 to 4 1,220 1,315 1,075 1,060
Amherstburg 5 to 9 1,235 1,230
10 to 14 1,480 1,310
0 to 4 1,030 1,180 890 895
Essex 5 to 9 1,105 1,045
10 to 14 1,215 1,150
0 to 4 1,095 1,075 1,135 1,135
Kingsville 5 to 9 1,210 1,250
10 to 14 1,270 1,270
0 to 4 1,934 1,880 1,764 1,630
Leamington 5 to 9 1,804 1,685
10 to 14 1,814 1,680
Source: Statistics Canada, 2016
W.E. Child Care and Early Years Service System Plan | 2020‐2025 14 | P a g ePOPULATION ANALYSIS: BEST
START NEIGHBOURHOODS (BSN)
OVERALL POPULATION AGE GROUP 0-4 AGE GROUP 5-9
Overall, the most highly The BSN with over 2,000 children The BSN with over 2,000 children
populated BSN: ages 0-4 are: ages 5-9 are:
• Central (2016 total 0-14 year • Central, South • Central
olds- 6,295) • Forest Glade/Riverside • South
• South (2016 total 0-14 year • Lakeshore • Forest Glade/Riverside
olds- 9,085) •Lakeshore
• Forest Glade/Riverside (2016 The BSN with less than 1,000 • South has the largest number of
total 0-14 year olds- 8,475) children ages 0-4 are: children (3,190)
• Lakeshore (2016 total 0-14 year • Central South
olds- 7,455) • Sandwich South and Industrial The BSN with less than 1,000
Zone children ages 5 to 9 are:
• Tecumseh • Central South
• Essex • Sandwich South and Industrial
Zone
• Tecumseh
AGE GROUP POPULATION POPULATION
10-14 GROWTH DECREASE
The BSN with over 2,000 children When looking specifically at the Those neighbourhoods
ages 10 to 14 are: 0 to 4 age group and changes in experiencing the highest
• South this population over time (from decrease in the 0 to 4 population
• Forest Glade/Riverside 2001 to 2016), the only from 2001 to 2016 are:
• LaSalle neighbourhood which has seen a • Central (22% decrease in 0 to 4
• Lakeshore growth is: population)
• South has the largest number of • Forest Glade/Riverside (1.5% • East/Fountainbleu (27.4%
children in this age group (3,520) increase in 0 to 4 population) decrease in 0 to 4 population).
The least populated BSN with less
than 100 children are:
• Sandwich South
• Industrial ZoneSCHOOL AND COMMUNITY MEASUREMENTS ENHANCING ENGAGEMENT “Children are competent, capable of complex thinking, curious, and rich in potential.” - How Does Learning Happen
BACKGROUND
          EARLY DEVELOPMENT INSTRUMENT (EDI)

          The Early Development Instrument (EDI) is a checklist completed by Senior Kindergarten teachers that
          measures a child’s developmental health as they enter Grade 1. The EDI tool is not used as a
          diagnostic tool for individual children, nor does it measure a school’s performance. Rather, the data is
          mapped by postal codes to provide information about groups of children within neighbourhoods and
          communities.

          The Offord Centre for Child Studies (McMaster University, Hamilton, Ontario) designed the EDI so that
          teachers could observe and "rate" competencies and behaviours of children within 5 domains of child
          development:

                    • Includes gross and fine motor skills and adequate energy levels for classroom activities.
Physical Health &
   Well Being

                    • Includes curiosity about the world, eagerness to try new experiences, knowledge of standards of
                      acceptable behaviour in a public place, ability to control own behaviour, cooperation with others,
      Social
                      following rules and ability to play and work with other children.
  Competence

                    • Includes ability to reflect before acting and ability to deal with feelings at the age appropriate
Emotional Health      level and empathic response to other people’s feelings.
      and
    Maturity

                    • Includes reading awareness, age appropriate reading, writing and numeracy skills, board games,
  Language and
                      and ability to understand similarities and differences and to recite back specific pieces of
    Cognitive         information from memory.
  Development

                    • Includes skills to communicate needs and wants in socially appropriate ways, symbolic use of
 Communication        language, story‐telling and age appropriate knowledge about life and world around.
  Skills/ General
   Knowledge

           W.E. Child Care and Early Years Service System Plan | 2020‐2025                            15 | P a g e
BACKGROUND
EARLY DEVELOPMENT INSTRUMENT (EDI)
These domains are further classified into sub‐domains (16 total).
Information is then reported at the macro‐level (national, provincial, or county level), or at the
micro‐level by community or neighbourhood. Neighbourhood analysis and mapping shows the
differences in vulnerability in populations of children and helps communities determine what kinds
of supports or programs should be offered to improve developmental health.
There is a strong relationship between poverty and literacy, and the EDI had been identified by the
Ontario Government as an important tool to monitor early years. Therefore, the EDI is being
implemented provincially every 3 years with 2004/2005 results providing the baseline for ongoing
comparisons. As results improve compared to the baseline, the expectation is that children will be
more successful in school and more successful later in life.
Since its launch in 2000, EDI has become recognized as a valuable and credible tool nationally and
internationally. It has been implemented in every province in Canada but not yet in every community
in some provinces.
EDI Scores and Vulnerability
The EDI outcomes for each of the 5 developmental areas or "domains" are divided into categories
representing the highest scores to the lowest scores in the community (distribution of scores). The
range of scores is then divided into four groups, each consisting of scores of a quarter or one fourth or
25 percent of the children in the site. These groups are called percentiles:
On track (Top)
The total group of children who score in the best 25th percentile of the site's distribution.
On track (Middle)
The total group of children who score between the 25th and 75th percentiles of the site's
distribution.
Not on track (At risk)
The total group of children who score between the lowest 10th and 25th percentile of the
site's distribution.
Not on track (Vulnerable)
The total group of children who score below the lowest 10th percentile of the site's
distribution.
Multiple Challenge Index: A child with scores below expectations on nine or more of the 16
subdomains is considered to have multiple challenges.
W.E. Child Care and Early Years Service System Plan | 2020‐2025 16 | P a g eANALYSIS
EARLY DEVELOPMENT INSTRUMENT (EDI)
EDI results allow communities to:
Identify neighbourhoods where there are strengths and vulnerabilities
Monitor populations over time
Predict how children will do in elementary school
The results obtained from the EDI can help local community planning groups and service providers
make evidence‐based decisions on programming for the early years.
Five cycles of EDI implementation have now been completed across Ontario. In Windsor and Essex
County Cycle 1 was completed between 2004‐2006, Cycle 2 in the 2007‐2008 school year and Cycle 3
in 2011‐2012, Cycle 4 in 2014‐2015, and Cycle 5 in 2017‐2018.
In all five cycles, the data provided a positive report for Windsor‐Essex; the percentage of children at
risk or vulnerable was lower than the Province with the exception of the Language & Cognitive
Development domain (Source: EDI Summary Report, Offord Centre)
Windsor‐ Essex County: Five Cycle EDI Results
Windsor‐ Windsor‐ Windsor‐ Windsor‐ Windsor‐
Vulnerability Summary Essex Essex Essex Essex Essex
Ontario Cycle 1: Cycle 2: Cycle 3: Cycle 4: Cycle 5:
Baseline (2005‐2006) (2007‐2008) (2011‐2012) (2014‐2015) (2017‐2018)
Low on at least 1 domain 29.6% 23.9% 23.2% 21.1% 24.9% 28.1%
Low on 2 or more domains 13.9% 11.6% 11.5% 9.9% 11.8% 13.5%
Multiple Challenge Index 3.5% 2.9% 2.4% 2.0% 2.8% 3.3%
Communication Skills & General Knowledge 10% 9.1% 9.2% 7.5% 7.4% 9.1%
Emotional Health & Maturity 11.3% 8.6% 8.4% 8.6% 10.7% 10.8%
Language & Cognitive Development 7.5% 9.4% 7.6% 6.2% 7.0% 8.9%
Physical Health & Well‐being 16.3% 10.9% 11.6% 9.7% 12.6% 15.1%
Social Knowledge & Competence 9.9% 7.1% 6.7% 6.4% 8.3% 8.7%
Windsor‐ Essex County: Cycle 5 EDI Results
35.0%
29.6%
30.0% 28.1%
25.0%
20.0%
16.3%
15.1%
13.9%13.5%
15.0%
11.3%10.8%
10% 9.9%
9.1% 8.9% 8.7%
10.0% 7.5%
5.0% 3.5%3.3%
0.0%
Low on at least 1 domain Mul ple Challenge Index Emo onal Health & Maturity Physical Health & Well‐being
Ontario Baseline Windsor Essex Cycle 5: (2017‐2018)
W.E. Child Care and Early Years Service System Plan | 2020‐2025 17 | P a g eANALYSIS, BSN
EARLY DEVELOPMENT INSTRUMENT (EDI)
Although as a whole Windsor‐Essex has scored better than the provincial average for the percentage of
children considered “at risk” or vulnerable, a look across the Best Start Neighbourhoods indicate that
there were increases in the percentage of children considered “at risk” or vulnerable.
Based on the 2014‐2015 EDI results, the Best Start Neighbourhood of East/Fontainebleau presents with
the most vulnerability (see table above for further details).
Windsor‐Essex County: Five Cycle Comparison EDI Results
Best Start Neighbourhoods with the highest count of children scoring low in each domain.
Domain 2004/05 2007/08 2011/12 2014/2015 2017/2018
Low on 1 or more domains Central Forest Glade/Riverside Forest Glade/Riverside East/ Fontainebleau West
Low on 2 or more domains Central Forest Glade/Riverside Forest Glade/Riverside East/ Fontainebleau West
Multiple Challenge Index Central East/ Fontainebleau Forest Glade/Riverside East/ Fontainebleau Central
Communication Skills Central East/ Fontainebleau Forest Glade/Riverside East/ Fontainebleau West
& General Knowledge
Emotional Health East/ Forest Glade/Riverside Forest Glade/Riverside East/Fontainebleau Central
& Maturity Fontainebleau
Language & Cognitive Central Forest Glade/Riverside Forest Glade/Riverside West West
Development
Physical Health Central Forest Glade/Riverside Forest Glade/Riverside East/ Fontainebleau Central
& Well Being
Social Knowledge Forest East/ Fontainebleau Forest Glade/ East/ Fontainebleau Central
& Competence Glade/Riverside Fontainebleau
Highest in most Central
Forest Glade/Riverside Forest Glade/Riverside East/Fontainebleau
areas/domains Central (6/8) (4/8),
(5/8) (8/8) (7/8)
West (4/8)
Low on at least 2 domains based on Best Start Neighbourhood Population
Best Start Cycle 1 Cycle 2 Cycle 3 Cycle 4 Cycle 5
Neighbourhoods (2004‐2005) (2007‐2008) (2011‐2012) (2014‐2015) (2017‐2018)
Central 15% 13% 12% 13% 22%
Central South 11% 14% 9% 13% 15%
East/ Fontainebleau 14% 17% 12% 20% 15%
Forest Glade/Riverside 12% 12% 14% 14% 15%
Sandwich South & Industrial Zone 0% 0% 0% 0% 6%
South 7% 7% 8% 11% 9%
West 13% 17% 13% 14% 27%
Amherstburg 11% 12% 10% 14% 15%
Essex 17% 12% 7% 11% 9%
Kingsville 14% 11% 9% 9% 12%
Lakeshore 8% 9% 6% 9% 10%
Lasalle 7% 9% 6% 6% 8%
Leamington 14% 17% 17% 10% 10%
Tecumseh 8% 9% 5% 7% 9%
W.E. Child Care and Early Years Service System Plan | 2020‐2025 18 | P a g eANALYSIS, BSN
EARLY DEVELOPMENT INSTRUMENT (EDI)
City Overview: 5 Cycles of EDI Data
% of Children in each Best Start Neighbourhood Scoring Low on 2 Domains
Cycle 1 (2004‐2005)
Cycle 2 (2007‐2008)
30%
Cycle 3 (2011‐2012)
Cycle 4 (2014‐2015)
25% Cycle 5 (2017‐2018)
Percentage
20%
15%
10%
5%
0%
Central Central South East/Fontainebleau Forest Sandwich South South West
Glade/Riverside
Best Start Neighbourhoods Cycle 1/2/3‐ Sandwich South & Industrial Zone‐
Less than 10 children, data not used
County Overview: 5 Cycles of EDI Data
% of Children in each Best Start Neighbourhood Scoring Low on 2 Domains
20%
Cycle 1 (2004‐2005)
18% Cycle 2 (2007‐2008)
16% Cycle 3 (2011‐2012)
14% Cycle 4 (2014‐2015)
Cycle 5 (2017‐2018)
Percentage
12%
10%
8%
6%
4%
2%
0%
Amherstburg Essex Kingsville Lakeshore Lasalle Leamington Tecumseh
Best Start Neighbourhoods Cycle 1/2/3‐ Sandwich South & Industrial Zone‐
Less than 10 children, data not used
W.E. Child Care and Early Years Service System Plan | 2020‐2025 19 | P a g eANALYSIS
EARLY DEVELOPMENT INSTRUMENT (EDI)
Total Windsor: Vulnerability
Cycle 1 Cycle 2 Cycle 3 Cycle 4 Cycle 5
Domains # % # % # % # % # %
of of of of of
Vulnerable Vulnerable Vulnerable Vulnerable Vulnerable
Children Children Children Children Children
Physical Health
& Well‐being
4299 10.9% 4049 11.6% 3929 9.7% 3748 12.6% 3902 15.1%
Social
Knowledge & 4320 7.1% 4050 6.7% 3934 6.4% 3749 8.3% 3903 8.7%
Competence
Emotional
Health & 4267 8.6% 4039 8.4% 3917 8.6% 3748 10.7% 3890 10.8%
Maturity
Language &
Cognitive 4295 9.4% 4044 7.6% 3932 6.2% 3747 7.0% 3903 8.90%
Development
Communication
Skills & General 4319 9.1% 4050 9.2% 3932 7.5% 3749 7.4% 3902 9.10%
Knowledge
Vulnerable on
at least one EDI 4321 23.9% 4051 23.2% 3934 21.0% 3749 24.9% 3903 28.10%
domain
Source: EDI Summary Report, Offord Centre
W.E. Child Care and Early Years Service System Plan | 2020‐2025 20 | P a g e“Children thrive in indoor and outdoor spaces that invite them to investigate, imagine, think, create, solve problems, and make meaning from their experiences.” - How Does Learning Happen
SOCIAL RISK INDEX

The conceptual model for the
Social Risk Index (SRI) was
developed by Human Resources
Development Canada (HRDC,
2003) as a tool for providing a
general picture of potential
community vulnerability and has
since been used extensively for
community planning across
multiple regions. Examples of SRI
use for planning can be seen for
school boards ¹ and
municipalities², and specifically
for early years planning ³.

The SRI uses variables that
profile the socio‐economic context of communities. It provides a simple, comprehensive picture of
socio‐economic challenges as a single measure of community risk. It should be noted that data for
the variable ‘percentage of government transfers’ was not available at the time of this report.

The SRI scoring key is shown in the graphic below. The SRI is derived by comparing social risk index
variable values for a smaller geographical unit with those for a larger geographical unit. A point is
added for all instances in which index variable values for the smaller geographic area exceed those of
the larger area for a maximum of 9 points. A score of 1‐2 is deemed low risk, 3‐4 somewhat low risk,
5‐6 somewhat high risk, and 7 or more high risk.

                                                                                                                          7‐9 High Risk

                                                                                                            5‐6 Somewhat High Risk

                                                                                                            3‐4 Somewhat Low Risk

                                                                                                                          1‐2 Low Risk

1 ‘A Blueprint for Addressing Poverty in Ontario School Boards’; ‘Social Risk Index: Elementary and Secondary Schools’.
2 ‘Greater Sudbury 2013 EDI Neighbourhood Reports’.
3 ‘Understanding the Early Years: Regina Community Mapping Report’.

 W.E. Child Care and Early Years Service System Plan | 2020‐2025                                                                          21 | P a g e
SOCIAL RISK INDEX
In comparing Windsor‐Essex County to Ontario as a whole, Windsor‐Essex shows higher rates of low
income, unemployment, lower education, lone‐parent families and NA/Aboriginal origins.
Windsor‐Essex
Social Risk Index Values Ontario
County
Prevalence of low income
in 2016 LIM‐AT % 16.5% 14.4%
Average of Unemployment Rate 8.3% 7.4%
% No certificate, diploma or degree 19.1% 17.5%
% Lone‐parent families 18.4% 17.1%
% NA/Aboriginal Origins 4.4% 2.8%
% Immigrating 2011‐2016 2.8% 3.6%
%Neither English or French 2.1% 2.5%
% of Renter 27.2% 30.2%
% of Movers 11.7% 12.4%
Social Risk Index: Windsor‐Essex
% of Movers, Prevalence of
11.7% low income
in 2016 LIM‐AT
%, 16.5%
Average of
Unemployment Rate,
8.3%
% of Renter, 27.2%
% No
certificate,
diploma or
degree, 19.1%
%Neither English or
French, 2.1%
% Lone‐parent families,
% Immigrating 2011‐2016, 18.4%
2.8%
% NA/Aboriginal Origins,
4.4%
W.E. Child Care and Early Years Service System Plan | 2020‐2025 22 | P a g eSOCIAL RISK INDEX
The SRI, is a useful tool for understanding risk associated with smaller geographical units as well. In this
case, values for Best Start Neighbourhoods were compared to a number of larger geographical
comparators, specifically Ontario, and Windsor‐Essex County. The table below shows the resulting SRI
scores for each Best Start Neighbourhood across the three comparators. While some variability appears
based on the comparator chosen, areas of high risk are Central, West and East/Fontainebleau.
It should be noted that many social and economic changes have happened in recent years within
specific neighbourhoods.
Social Risk Index
9 9
7
Score
5
4 4
2 2 2
0 1 1 1 1
Best Start Neighbourhoods
W.E. Child Care and Early Years Service System Plan | 2020‐2025 23 | P a g eSocial Risk Index Values by Best Start Neighbourhood
Sandwich South & Forest Glade/
Central Central South South West East/ Fontainebleau
Industrial Zone Riverside
Prevalence of low income
35.8% 18.2% 13.7% 43.9% 22.0% 7.8% 15.5%
in 2016 LIM‐AT %
Source: Census, 2016
Average of Unemployment Rate 11.5% 6.2% 7.7% 15.8% 9.5% 0.0% 7.3%
% No certificate, diploma or degree 21.7% 20.4% 15.5% 20.8% 22.2% 22.4% 16.4%
% Lone‐parent families 28.9% 22.4% 14.4% 32.4% 28.5% 12.2% 20.6%
SOCIAL RISK INDEX
% NA/Aboriginal Origins 5.8% 4.0% 2.0% 5.5% 6.4% 9.1% 4.0%
% Immigrating 2011‐2016 7.0% 3.6% 3.9% 6.6% 2.1% 0.0% 3.2%
%Neither English or French 5.2% 2.2% 2.6% 2.3% 1.3% 0.8% 1.5%
% of Renter 55.7% 18.9% 11.4% 60.3% 36.2% 23.5% 29.8%
% of Movers 18.4% 9.2% 9.4% 22.9% 12.6% 6.7% 12.1%
LaSalle Tecumseh Amherstburg Essex Kingsville Lakeshore Leamington
Prevalence of low income
W.E. Child Care and Early Years Service System Plan | 2020‐2025
5.6% 6.1% 8.1% 9.5% 9.2% 5.8% 16.0%
in 2016 LIM‐AT %
Average of Unemployment Rate 5.7% 5.2% 6.8% 6.4% 4.3% 5.1% 8.0%
% No certificate, diploma or degree 13.8% 13.6% 16.6% 19.2% 22.5% 15.4% 36.3%
% Lone‐parent families 13.0% 15.2% 13.9% 14.8% 10.4% 10.8% 16.1%
% NA/Aboriginal Origins 3.4% 4.5% 6.2% 5.8% 3.2% 4.6% 2.8%
% Immigrating 2011‐2016 1.2% 0.7% 0.4% 0.3% 0.6% 0.6% 2.0%
%Neither English or French 0.7% 0.8% 0.3% 0.3% 2.7% 0.4% 4.9%
% of Renter 6.5% 12.6% 14.5% 15.6% 15.5% 9.2% 31.0%
% of Movers 7.7% 7.7% 9.1% 8.8% 9.5% 8.6% 12.8%
24 | P a g eEDUCATION QUALITY AND ACCOUNTABILITY (EQAO) SUPPORT THE WELL-BEING “Early childhood programs nurture children’s healthy development and support their growing sense of self.” - How Does Learning Happen
EQAO RESULTS
Four publicly funded school boards operate in Windsor‐Essex County: Greater Essex County
District School Board, Windsor‐Essex Catholic District School Board, Conseil Scolaire Viamonde,
and Conseil Scolaire Catholique Providence. Together these boards serve children and
families in a total of 108 elementary schools located in Windsor‐Essex County.

The EQAO reports on assessments of reading, writing and mathematics for the primary division (Grades
1 to 3) and junior division (Grades 4 to 6). All school boards in Windsor‐Essex County measure this and
participate in the EQAO assessments.

                       Greater Essex County District School Board (GECDSB)
           Area                     2011‐2012                     2013‐2014             2017‐2018
          Grade 3             62% of students at or        65% of students at or   72% of students at or
          Reading             above the provincial         above the provincial    above the provincial
                              standard (66% in the         standard (70% in the    standard (75% in the
                              province)                    province)               province)
          Grade 3             70% of students at or        73% of students at or   70% of students at or
          Writing             above the provincial         above the provincial    above the provincial
                              standard (76% in the         standard (78% in the    standard (72% in the
                              province)                    province)               province)
         Grade 3              64% of students at or        64% of students at or   57% of students at or
        Mathematics           above the provincial         above the provincial    above the provincial
                              standard (68% in the         standard (67% in the    standard (61% in the
                              province)                    province)               province)

          Grade 6             73% of students at or        76% of students at or   80% of students at or
          Reading             above the provincial         above the provincial    above the provincial
                              standard (75% in the         standard (79% in the    standard (82% in the
                              province)                    province)               province)
          Grade 6             70% of students at or        74% of students at or   77% of students at or
          Writing             above the provincial         above the provincial    above the provincial
                              standard (74% in the         standard (78% in the    standard (80% in the
                              province)                    province)               province)
         Grade 6              56% of students at or        52% of students at or   47% of students at or
        Mathematics           above the provincial         above the provincial    above the provincial
                              standard (58% in the         standard (54% in the    standard (49% in the
                              province)                    province)               province)

The EQAO assessment results comparison from 2011‐2012 to 2017‐2018 for the GECDSB indicate an
increase in the number of children performing at or above the provincial standard across all areas with
the exception of mathematics at both the grade 3 and grade 6 level. The province as a whole also
experienced a decline in the number of children performing at or above the provincial standard in
mathematics. Although there have been gains with the percentage of children performing at or above the
provincial standard, it is still lower than the provincial percentage of children performing at or above the
provincial standard in all areas.

W.E. Child Care and Early Years Service System Plan | 2020‐2025                                  25 | P a g e
EQAO RESULTS
Windsor‐Essex Catholic District School Board (WECDSB)
Area 2011‐2012 2013‐2014 2017‐2018
Grade 3 65% of students at or 69% of students at or 76% of students at or
Reading above the provincial above the provincial above the provincial
standard (66% in the standard (70% in the standard (75% in the
province) province) province)
Grade 3 77% of students at or 81% of students at or 77% of students at or
Writing above the provincial above the provincial above the provincial
standard (76% in the standard (78% in the standard (72% in the
province) province) province)
Grade 3 68% of students at or 68% of students at or 63% of students at or
Mathematics above the provincial above the provincial above the provincial
standard (68% in the standard (67% in the standard (61% in the
province) province) province)
Grade 6 73% of students at or 79% of students at or 80% of students at or
Reading above the provincial above the provincial above the provincial
standard (75% in the standard (79% in the standard (82% in the
province) province) province)
Grade 6 74% of students at or 81% of students at or 83% of students at or
Writing above the provincial above the provincial above the provincial
standard (74% in the standard (78% in the standard (80% in the
province) province) province)
Grade 6 59% of students at or 60% of students at or 54% of students at or
Mathematics above the provincial above the provincial above the provincial
standard (58% in the standard (54% in the standard (49% in the
province) province) province)
The EQAO assessment results comparison from 2011‐2012 to 2017‐2018 for the WECDSB indicate an
increase in the number of children performing at or above the provincial standard across all areas with
the exception of mathematics at both the grade 3 and grade 6 level. The province as a whole also
experienced a decline in the number of children performing at or above the provincial standard in
mathematics. The EQAO comparison for the WECDSB indicates that in Grade 3 reading, writing and
mathematics the percentage of children performing at or above the provincial standard, is greater than
the provincial percentage of children performing at or above the provincial standard. In Grade 6 writing
and mathematics the percentage of children performing at or above the provincial standard, is greater
than the provincial percentage of children performing at or above the provincial standard.
W.E. Child Care and Early Years Service System Plan | 2020‐2025 26 | P a g eEQAO RESULTS
Conseil scolaire catholique Providence (Csc Providence)
Area 2011‐2012 2013‐2014 2017‐2018
Grade 3 74% of students at or 77% of students at or 83% of students at or
Reading above the provincial above the provincial above the provincial
standard (75% in the standard (80% in the standard (84% in the
province) province) province)
Grade 3 83% of students at or 81% of students at or 77% of students at or
Writing above the provincial above the provincial above the provincial
standard (83% in the standard (81% in the standard (76% in the
province) province) province)
Grade 3 77% of students at or 76% of students at or 74% of students at or
Mathematics above the provincial above the provincial above the provincial
standard (75% in the standard (79% in the standard (75% in the
province) province) province)
Grade 6 82% of students at or 90% of students at or 90% of students at or
Reading above the provincial above the provincial above the provincial
standard (86% in the standard (91% in the standard (92% in the
province) province) province)
Grade 6 81% of students at or 86% of students at or 76% of students at or
Writing above the provincial above the provincial above the provincial
standard (85% in the standard (89% in the standard (78% in the
province) province) province)
Grade 6 76% of students at or 82% of students at or 81% of students at or
Mathematics above the provincial above the provincial above the provincial
standard (82% in the standard (83% in the standard (83% in the
province) province) province)
The EQAO assessment results comparison from 2011‐2012 to 2017‐2018 for Csc Providence indicate an
increase in the number of children performing at or above the provincial standard in reading at the grade
3 level. Csc Providence experienced a decline in the percentage of children performing at or above the
provincial standard in the areas of writing and mathematics at the grade 3 level and the grade 6 level. As a
whole, the province also experienced a decline in the percentage of children performing at or above the
provincial standard in writing and mathematics at the grade 3 level and math at the grade 6 level.
W.E. Child Care and Early Years Service System Plan | 2020‐2025 27 | P a g eEQAO RESULTS
Conseil scolaire Viamonde
Area 2011‐2012 2013‐2014 2017‐2018
Grade 3 68% of students at or 73% of students at or 83% of students at or
Reading above the provincial above the provincial above the provincial
standard (75% in the standard (80% in the standard (84% in the
province) province) province)
Grade 3 74% of students at or 74% of students at or 73% of students at or
Writing above the provincial above the provincial above the provincial
standard (83% in the standard (81% in the standard (76% in the
province) province) province)
Grade 3 66% of students at or 76% of students at or 73% of students at or
Mathematics above the provincial above the provincial above the provincial
standard (75% in the standard (79% in the standard (75% in the
province) province) province)
Grade 6 87% of students at or 91% of students at or 92% of students at or
Reading above the provincial above the provincial above the provincial
standard (86% in the standard (91% in the standard (92% in the
province) province) province)
Grade 6 85% of students at or 90% of students at or 77% of students at or
Writing above the provincial above the provincial above the provincial
standard (85% in the standard (89% in the standard (78% in the
province) province) province)
Grade 6 82% of students at or 81% of students at or 81% of students at or
Mathematics above the provincial above the provincial above the provincial
standard (82% in the standard (83% in the standard (83% in the
province) province) province)
The EQAO assessment results comparison from 2011‐2012 to 2017‐2018 for CS Viamonde indicate an
increase in the percentage of children performing at or above the provincial standard in reading at the
grade 3 and grade 6 level. CSC Providence experienced a decline in the percentage of children performing
at or above the provincial standard in the areas of writing and mathematics at the grade 3 level and
writing at the grade 6 level. As a whole the province also experienced a decline in the percentage of
children performing at or above the provincial standard in writing and mathematics at the grade 3 level
and math at the grade 6 level.
W.E. Child Care and Early Years Service System Plan | 2020‐2025 28 | P a g eCHILD CARE AND EARLY
YEARS SUPPORT FOR
FAMILIES IN WINDSOR ESSEX
ENCOURAGING
EXPRESSION
“Early childhood programs foster communication and expression
in all forms.”
- How Does Learning Happen30 EarlyON Child and Family Centres located
14
x
throughout the best start neighbourhoods
in Windsor‐Essex
“Increasing access to early year’s programs to give families more opportunity
to benefit from high‐quality early childhood programs and services.”
Ontario’s Renewed Early Years and Child Care Policy Framework, 2017
KEY FINDINGS from the OEYCFC Initial Plan:
Building awareness Increasing system access System integration
Enhanced referral practices Increase diversity and inclusivity
This program offers my children and myself
an opportunity to make connections, as
well as the ability to participate in
enriching, educational activities, and
programs.
EarlyON Parent e‐Valuation Survey 2018
Included in the 30 EarlyON CFC across Windsor‐
Essex are:
10,258 UNIQUE children served in 2018 with
2 Indigenous‐Led EarlyON Child
and Family Centres
88,177
a total of total number of visits.
&
3 Francophone EarlyON Child and
Family Centres throughout
Windsor‐Essex
10,216 unique parents/caregivers served,
*Unique refers to each child/parent/caregiver only being counted once during
the reporting period
74,043
with a total of visits.
W.E. Child Care and Early Years Service System Plan | 2020‐2025 29 | P a g eEARLY YEARS
PROGRAMS
On February 19, 2016, the Minister of Education
announced the Ministry of Education’s provincial plan
for moving forward with the integration and
transformation of child and family programs to establish
Ontario Early Years Child and Family Centres (OEYCFCs)
by 2018. During the planning and transition period it
was determined that the Ontario Early Years Child and
Family Centres (OEYCFCs) would change to EarlyON
Child and Family Centres (EarlyON CFCs)
This transformation resulted in Ministry‐funded child
and family programs in Windsor‐Essex (Ontario Early Years Centres and Parenting and Family Literacy
Centres) becoming part of a cohesive system of services and supports guided by a provincial framework, a
common identity and a new funding approach. EarlyON CFCs are overseen by the City of Windsor’s
Children’s Services Department.
Making the transition to a coordinated system that aligned with the broader early years sector required a
carefully planned transition process that engaged all local partners and minimized service disruptions for
children and families.
The intent of this integration process was for the City of Windsor’s, Children’s Services Department to
make thoughtful and informed decisions about program and service delivery with the support of local
early years partners. The City of Windsor, Children’s Services wanted to build on the successful practices
that were already in place, and ensure that adjustments were made where required to be responsive to
the strengths and needs of children and families.
Meaningful engagement and joint planning and coordination between the City of Windsor’s, Children’s
Services Department and school boards, community planning tables, local public health, First Nations,
urban Indigenous, Métis and Inuit organizations, Francophone organizations, parents and caregivers was
essential to the planning of EarlyON CFCs services and sites. This collaborative approach was essential to
achieving early years system integration and supported the development and delivery of programs that
are responsive to the needs of the community.
In 2018 Windsor‐Essex began the transition to EarlyON CFCs. There are total of 30 EarlyON CFCs located
across Windsor‐Essex; ten located in Essex County and twenty in Windsor. The EarlyON Child and Family
Centres are operated by:
Access County Community Support Services
City of Windsor, Children’s Services
Connections Early Years Family Centre
Drouillard Place
Franco‐Sol Garderie et Centre de Ressources
Great Beginnings Child Centred Co‐operative Inc
Greater Essex County District School Board
Ska:Na Family Learning Centre
W.E. Child Care and Early Years Service System Plan | 2020‐2025 30 | P a g eEARLY YEARS
PROGRAMS
In Windsor‐Essex the EarlyON Child and Family Centres have continued to build on the momentum and
vision. The City of Windsor, Children’s Services continues to engage with the EarlyON Child and Family
Network for feedback that assists in local decision making to enrich programs, facilitate smooth
transitions and enhance integration between early years services, schools and specialized communities.
EarlyON Child and Family Centres offer free programs for families with children birth to 6 years of age.
They provide high‐quality, inclusive services that support early learning and development. They are
warm and welcoming. Children are able to learn, play, and engage in positive interactions with other
children and adults. Parents and caregivers are able to enjoy their children, play alongside them, meet
other parents, talk with professionals, learn about child development and make connections to other
services in the community.
EarlyON Child and Family Centre Usage in 2018
2018 EarlyON CFC System Attendance Report
Total number of unique (unduplicated) children served 10258
Total number of visits made by children 88177
Total number of unique (unduplicated) parent/caregivers served 10216
Total number of visits made by parents/caregivers 74043
Total number of referrals 2498
Note: 2018 was the first year that EarlyON CFCs were established so there is no prior data to compare
EarlyON Child and Family Centre Usage in 2019 (January to September 30, 2019)
2019 (Jan‐Sept 30): EarlyON CFC System Attendance Report
Total number of unique (unduplicated) children served 9777
Total number of visits made by children 71625
Total number of unique (unduplicated) parent/caregivers served 9387
Total number of visits made by parents/caregivers 59032
Total number of referrals 2483
Mandatory Core Services
All EarlyON Child and Family Centres provide mandatory core services to children and families. These
mandatory core services are:
Engaging parents and caregivers,
Supporting early learning and development, and
Making connections for families.
In the planning stages for the transition to EarlyON Child and Family Centres it was determined by
stakeholders, community partners and parents that it was important to provide programming at a
variety of times in order to reach as many children and families as possible. The attached charts with
programming hours show the wide range of times that services are offered including evenings and
weekends.
*Unique refers to each child/parent/caregiver only being counted once during the reporting period
W.E. Child Care and Early Years Service System Plan | 2020‐2025 31 | P a g eYou can also read