Wireless Mobile Spectrum Assignment in India: Issues and Challenges
←
→
Page content transcription
If your browser does not render page correctly, please read the page content below
Wireless Mobile Spectrum Assignment in India:
                Issues and Challenges
                              Hansikaa Chauhan1, Dr. Archana Sarma2
                          1
                            Research Scholar Ph.D., The NorthCap University, India.
     2
         Dr. Archana Sarma, Associate Professor & Head, School of Law, The NorthCap University, India

Abstract
The research paper discusses and analyzes the Wireless Mobile Spectrum Assignment in India
during the recent spectrum auction held in March 2021. India is today the second largest and
the fastest growing telecom industry in the world in terms of number of wireless connections
and is steering towards technological advancements in wireless mobile communications. With
the introduction of Digital India Programme, the Wireless Mobile Communications Industry
promises to place India on a strong footing with other developed economies of the world in the
near future. However, the Industry has been facing several roadblocks on its way to the future
growth due to inefficient spectrum management. In this paper, the Researchers have discussed
the significance and contribution of the Wireless Mobile Spectrum in the economic growth of
India and have critically analyzed the Wireless Spectrum Assignment process. The Researchers
have also highlighted the performance indicators of Wireless Cellular Mobile Communications
Industry in order to emphasize on the importance of spectrum management in the growth and
development of this industry. The researchers have highlighted the various issues and
challenges in Spectrum Allocation of India and have given suggestions for efficient spectrum
management before the next 5G Auction in the Year 2022 that can further accelerate India
towards ‘Digitalization’ and Globalization.

Keywords: Spectrum Auctions in India, 5G Spectrum Bands, Digital India, Mobile Economy,
Doing Business in India.

83
1. Introduction
 “It is precisely in places where no infrastructure exists that wireless can be particularly
effective, helping countries to leapfrog generations of telecommunications technology and
infrastructure and empower their people.”

                                                     -   (Mr. Kofi Annan, UN Secretary- General)

    The wireless cellular mobile communications industry has achieved an exemplary growth
in the last decade in India. With 1,153.77 million3 wireless mobile subscriptions at the end of
third quarter of the year 2020, India is today the second largest and the fastest growing telecom
industry in the world in terms of number of wireless connections. It is noteworthy that the
Indian Mobile Subscribers base has grown more than forty times from 28.50 million4
subscribers in December 2003 to 1,153.77 million in December 20205.
    Currently, India is steering towards technological advancements in wireless mobile
communications and is striving to create a suitable infrastructure for 5G technology. While 2G
technology was being used predominantly for voice services in the last decade, at present the
data intensive LTE technologies, has converted mobile handsets into a converged device which
is capable to provide all communication requirements of a smartphone user, which is- voice,
data, information, music and entertainment. Therefore, in order to further expand and improve
country’s wireless cellular mobile communication, it is imperative to use the spectrum
efficiently because data applications consume more bandwidth as compared to voice
communications.

    Radio Spectrum being a scarce and limited natural resource, futuristic spectrum planning
and policies play a significant role in ensuring the efficient use of spectrum that will not only
benefit the Government but also Network Operators as well as the consumers. The phenomenal
growth of the wireless mobile communication industry in the last decade was a result of policy
and regulatory reforms that paved the way for privatization, foreign direct investment, low
mobile- tariff costs, development of telecom infrastructure, unified licensing etc. thereby
enabling faster wireless mobile penetration in the country. Technological advancement and
evolution are completely dependent upon the availability of required spectrum at an affordable
price and therefore futuristic spectrum planning, appropriate spectrum pricing, efficient
spectrum allocation and utilization are necessary for a continuous growth of this industry.
There is no doubt that RF Spectrum is and has always been a crucial factor in the evolution of
Indian wireless mobile communication industry and is a significant contributor to National
Gross Domestic Product (GDP). It is RF Spectrum that infuses life to the wireless mobile
communication industry. According to a recent World Bank study that correlates GDP growth

3 The Telecom Regulatory Authority of India. (2021, April). The Indian Telecom Services Performance
Indicators Oct- Dec 2020 p. 13 https://trai.gov.in/sites/default/files/QPIR_27042021_0.pdf
4
  Telecom Regulatory Authority of India. (2005, March). Performance Indicator Report October- December
2003 http://www.trai.gov.in/WriteReadData/PIRReport/Documents/Report%20QE%20Dec-03-
%203rd%20march%202004.pdf
5
  Supra note 3.

84
with fixed, mobile, internet and broadband adoption a 10-percentage point increase in mobile
penetration could generate a 0.81 percentage point increase in GDP growth in low-to-middle
income countries, and a 0.60 percentage point increase in high-income countries6. The result
for broadband adoption is even more promising: a 10-percentage point increase in penetration
yields a 1.38 percentage point increase in GDP growth in low-to-middle income countries,
versus 1.21 percentage points in high-income countries7. That is the reason why French jurist
J.D. Bedin has defined the frequency spectrum as technology, industry, money, culture, and
power8.
2. Significance of spectrum in the economic growth of india
Globally, it took 113 years for the wireline tele density to reach 1/10th of the world’s
population whereas wireless mobile achieved the same tele density within first fifteen years9.
In developed as well as developing countries, wireline is being replaced by wireless mobile
communications service that has been recognised as a public utility. Similarly, in India, a weak
and inadequate fixed line infrastructure opened the doors for wireless mobile communication
services to streak ahead of wireline connections. As a result, the mobile subscriber base in India
crossed the wireline subscriber base in October 200410 and currently overshadows the wireline
industry by a ratio of around 58:111. From the above statistics, it is evident that in the present
scenario, growth of telecommunication sector is synonymous with growth of wireless mobile
communication services. Wireless is the driving force behind the growth of telecommunication
sector which is accelerated by RF Spectrum- ‘the heart and soul’ of wireless cellular mobile
communication.
The wireless mobile communication industry has become a significant contributor to
Indian economy in the past two decades. The share of telecommunication services (excluding
postal and miscellaneous services) to the country’s GDP has increased from 0.96% in 2000-01
to 6.5% at present with a total contribution of INR 9 lakh crore to the economy12. Currently,
6
Christine Zhen-Wei Qiang. (2009, November). Mobile Telephony - A Transformational Tool for Growth and
Development, PROPARCO’S MAGAZINE, Issue 4 November 2009, at 8. Available: https://blog.private-sector-
and-development.com/2009/12/21/mobile-phone-a-transformational-tool-for-growth-development/
7
Michael Minges. (2015). Exploring the Relationship between Broadband and Economic Growth. World Bank.
https://documents1.worldbank.org/curated/en/178701467988875888/pdf/102955-WP-Box394845B-PUBLIC-
WDR16-BP-Exploring-the-Relationship-between-Broadband-and-Economic-Growth-Minges.pdf
8
Centre for Strategic and International Studies. (1991, September 19). The New Spectrum Mudwrestle: WARC
1992 and Beyond (Washington D.C.: CSIS International Communications Studies, Symposium, 1992), (p. vi).
9
Telecom Regulatory Authority of India. Government of India. (2005, May 13). Recommendations on Spectrum
related Issues p. 22. https://www.trai.gov.in/sites/default/files/spectrumreco.pdf
10
Telecom Regulatory Authority of India. Government of India. (2005, March). Performance Indicator
Report October- December 2004
http://www.trai.gov.in/WriteReadData/PIRReport/Documents/report22mar05.pdf
11
Supra 3 at 24. Total Wireless subscriptions by Oct. 2020 is 1,153.77 million whereas wireline subscription
was 20.05 million.
12
Invest India- National Investment Promotion and Facilitation Agency. (2021, June). Telecom Sector
https://www.investindia.gov.in/sector/telecom
85the industry directly and indirectly has been supporting more than 4 million jobs 13 which is
likely to increase rapidly once the Covid- 19 situation subsides.
3. Wireless Spectrum Policy of India- A Critical Analysis
Effective Spectrum Management, Efficient Spectrum Utilization and Appropriate
Spectrum Pricing are the three key factors that can accelerate the growth of Indian Wireless
Cellular Mobile Communications Industry. If the Government handles these three factors
wisely then it can easily remove the uncertainties and ambiguities that have affected the growth
and foreign direct investment in this Sector
India requires more spectrum to capture the advantages of new opportunities for social and
economic development. With demands for mobile technology expected to rise rapidly in future
years, it is imperative that the country deploy spectrum for commercial utilization in order to
make possible the expansion of mobile broadband.
The National Telecom Policy- 201214 (hereinafter referred to as NTP- 2012) laid down the
following provisions related to Spectrum Assignment for faster adoption of advanced mobile
technologies-
i. To simplify the licensing framework,
ii. To create One Nation- One License across services and service areas
iii. To provide adequate spectrum and its allocation in a transparent manner and to de-
license additional spectrum for commercial use.
iv. To harmonize legal, regulatory and licensing framework for efficient converged
services.
v. To establish a unified licensing regime and de-link spectrum for all future licenses.
vi. To make spectrum technology- neutral and allow spectrum pooling, sharing and
trading.
vii. To enable spectrum refarming to make more spectrum available for newer
technologies and
viii. To provide adequate 1800 MHz, 1910 MHz, 2.1 GHz, 2.3 GHz, 2.5 GHz and 3.5
GHz bands for commercial mobile services.
Despite having such promising provisions, NTP- 2012 could not yield the desired results
due to the delay in implementation of policies related to its objectives.
With so many opportunities available in India, it is crucial to address the current barriers.
There have been a number of difficulties in terms of India’s spectrum policy which includes
challenges related to poor spectrum planning, availability and cost of spectrum, fragmented
13
Ibid.
14
Department of Telecommunications, National Telecom Policy- 2012. Ministry of Communications.
Government of India. https://dot.gov.in/sites/default/files/NTP-06.06.2012-final_0.pdf
86spectrum bands, and failed past auctions interalia. The following sections outline each of these
issues in greater detail.
3.1 Challenges in Efficient Allocation of Spectrum in India
Spectrum Management is the process of regulating the use of radio frequencies to promote
efficient use and gain a net social benefit15. As discussed above, Spectrum Management is an
amalgamation of administrative and technical procedures with legal regulations that are needed
to ensure an efficient working of radio communication services without causing any harmful
interference.
While managing spectrum, the Government deals with two types of efficiency- technical
and economic that are achieved in conformity with the principles of public policy. Technical
efficiency denotes an optimal use of spectrum with minimum interference within permissible
limits. It also aims to develop spectrum-saving technologies. Whereas, Economic efficiency is
achieved by developing methods which support spectrum assignment and allocation to uses
that are capable to gain highest economic return from it. At the same time, the regulatory
process of achieving the objectives of technical and economic efficiency has to be reasonably
flexible and adaptable to modifications that take place due to technological advancements and
change in market value of resources.
The process of Spectrum Management is multi-dimensional in nature which includes inter-
alia, a proper frequency and band planning before auctions, spectrum refarming, calculation of
resources before determining the reserve price of spectrum, efficient spectrum auctions,
effective policies with well-defined objectives, timely allocation of spectrum, spectrum
engineering, standardization of telecom equipment and control and monitoring of spectrum.
If the above- mentioned parameters claim to be the hallmark of efficient spectrum
management, then there is no doubt in the fact that the current state of the Indian Wireless
Cellular Mobile Communication Industry is a clear reflection of mismanagement of spectrum
by public as well as private sector. The problems faced by this industry have cropped up due
to the mismanagement of this limited resource. Spectrum engineering and management are the
heartbeats which infuse life into this Industry. Therefore, it is imperative that this heart
functions efficiently so as to avoid a myocardial infarction of the wireless cellular mobile
communication industry.
The various challenges of spectrum planning have been discussed in detail below in the
context of Wireless Cellular Mobile Communications Industry of India-
3.1.1 Uneven Spectrum Band Planning before Auctions
Spectrum Planning is the first step in the process of spectrum management which is very
crucial for efficient utilization of spectrum. To avoid wastage of spectrum, it is pertinent that
15
Martin Cave et al. (2007). Essentials of Modern Spectrum Management. Cambridge University Press.
87at the national level, spectrum bands are engineered in such a manner that they are harmonized
with international standards and are not fragmented so that advanced technologies like LTE
(4G) and 5G can be rolled out smoothly.
Table 1 given below shows the Frequency Bands in which the cellular operators provide
different mobile technologies. These bands are auctioned by the Government from time to time
as per the market requirement in various Licensed Service Areas (LSA’s).
However, the operators have not been able to use these bands to their full potential due to
fragmented possession of these bands that obstructed their optimum use.
Table 1: Wireless Cellular Mobile Communication Services have been allotted the following bands in India 16
Band Band Name Technology Frequency Allotted (in MHz)
800 MHz CDMA 2G/LTE- FDD 824- 844/ 869- 889
900 MHz GSM/ n8- 5G 2G/UMTS/ 890- 915/ 935- 960
NR Band HSPA/
WCDMA/ LTE
(4G)/ 5G
1800 MHz GSM/ 3GPP 2G/LTE- FDD 1710- 1785/ 1805- 1880
Band B3
2100 MHz 3GPP Band B1/ UMTS (3G)/ 1920- 1980/ 2110- 2170
UMTS LTE (4G)
2300 MHz 2.3 GHz Band TD- LTE (4G)/ 2300- 2400
5G
2500 MHz 3GPP B41 TD- LTE (4G) 2500- 2690
16
Wireless Planning and Coordination Wing. (2011, September). National Frequency Allocation Plan 2011 p.
194. Department of Telecommunications. Ministry of Communications and Information Technology.
Government of India.
https://www.coai.com/sites/default/files/National-Frequency-Allocation-Plan-NFAP-2011_0_0_0.pdf
88Source: Wireless Planning and Coordination Wing. Department of Telecommunications. Government of India.
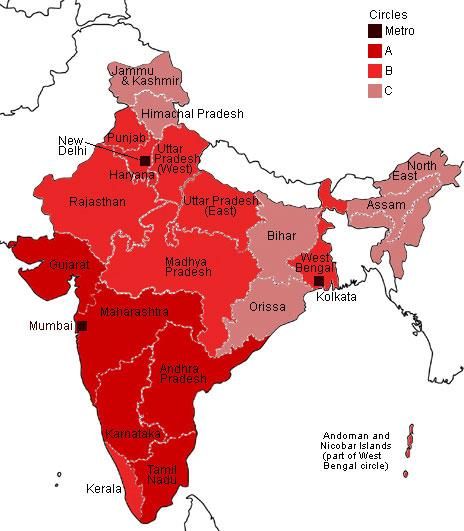
India has been divided into 22 Telecom Circles, wherein 3 circles cover the Metros,
namely, Delhi, Mumbai and Kolkata and the remaining 19 circles cover other States of India.
These Circles are further divided into A, B and C category based on economic parameters and
revenue potential. At present, India has three major private operators with pan- India networks
across different frequency bands.
Figure 1: Telecom Circles in India17
Due to uneven Frequency and Band planning for 2G, 3G and 4G technologies each operator
in a given band was allotted with different frequencies channels in all the circles for which he
obtained a license. This made active sharing as well as passive sharing a challenge thereby
increasing the cost of rolling out networks.
Before the introduction of unified licensing guidelines in India, each spectrum band used
to signify a specific technology that could be deployed only in that particular band. For
example, as shown in Table: 1 above, 800 MHz band was used for CDMA technology whereas
900/1800 MHz Bands were used only for 2G mobile communications. Similarly, 2100 MHz
Band was used for 3G mobile communication and 2300/2600 MHz Bands were used for 4G
technology. Before 2014, on an average, around 6-8 operators used to operate in each spectrum
17
Catherine Haslam. (2016, November 29). A Guide to India’s Telecom Market, India Calling Info.
http://www.indiacallinginfo.com/india-telecom-circles
89band in a specific technology in a given circle. For example, in December 2013 there were 8
Service Providers in the Delhi circle who were operating in the 1800 MHz Band namely, Airtel,
Vodafone, Idea, Aircel, R. Com, Tata Teleservices, Sistema Shyam and MTNL and till October
2014 they all were operating only 2G Technology in that band.
However, after the introduction of Unified Licensing Guidelines in November 2014, the
Indian Telecom Sector was made open to unified licensing under which any Telecom Service
Provider could operate any technology in a given Band in a given telecom circle. In other
words, spectrum was made technology- neutral but due to the fragmented spectrum in all the
prominent bands for LTE technology, 4G could not be used to its full capacity in India.
So, now under the Unified Licensing regime, some operators like Airtel, Vodafone Idea
Limited (VIL) had been successful in deploying 2G as well as LTE (4G) technologies in the
1800 MHz Band whereas there were some Service Providers who were limited to only 2G
technology in that Band due to unavailability of contiguous spectrum. Similarly in the 900
MHz band, 2G and UMTS (3G) technologies have been deployed by a few Service Providers
while some operators have been made bound to restrict themselves to just the 2G technology
due to fragmented spectrum in those bands.
It is pertinent to mention here, that 1800 MHz is the most suitable band for LTE (4G).
According to Global Mobile Suppliers Association (GSA), presently 1800 MHz Band covers
68% of the total LTE networks by being used by 811 network operators globally.18
The implications of improper spectrum planning can be further understood with the help of
following Cases wherein the current frequency allocation in the two metros has been
highlighted in the 900, 1800, 2100 and 2300 MHz band after the 2015 Spectrum Auction.
CASE 1- Delhi circle, 1800 MHz band–
The below given Table 2 shows the frequencies allotted to Airtel in the 1800 MHz Band in
Delhi in the Spectrum Auction, 2015.
After the spectrum allocation in February, 2015 auction, Airtel had 4 chunks of 0.2 MHz,
0.8 MHz, 0.4 MHz and 4.8 MHz frequency in the 1800 MHz band in Delhi. However, despite
having a total spectrum of 6.2 MHz in this circle, the Operator was unable to deploy LTE (4G)
technology in the 1800 MHz and was bound to roll out only the 2G technology in that band
due to fragmented spectrum. So, to roll- out LTE in Delhi, Airtel had to buy a contiguous block
of spectrum in the 2300 MHz band thereby increasing its debt burden.
18
Global Mobile Suppliers Association. (2021, June 30). Status of the LTE Ecosystem p. 5.
https://gsacom.com/reports/
90Table 2: Frequencies allotted to Airtel in the 1800 MHz Band in Delhi in Spectrum Auction 2015 19
Airtel Airtel Airtel Airtel
1719.8 1720 1730.6 1731.4 1745.8 1746.2 1753.4 1758.2
Source: Wireless Planning and Coordination Wing. (2015, January 31). Spectrum Holding of Telecom Service
Providers
The above case is a staunch example of poor spectrum planning which ultimately led to
misutilization of spectrum and an increase in network roll- out costs, to overcome which
Operators had to raise the consumer tariffs.
CASE 2- The 900 MHz Band in the Kolkata Circle-
Table 3 shows the frequency planning in the 900 MHz Band in the Kolkata Circle. In
Kolkata, total spectrum held by Airtel was 6.9 MHz which is fragmented into 4.9 MHz and 2
MHz while Vodafone has three chunks of 4.9 MHz, 2 MHz and 0.6 MHz which makes it a
total 7.5 MHz of spectrum. Here both the Operators are able to roll- out 2G and UMTS (3G)
technology but both the Service Providers had to work on technical configurations in their
networks because they had not been allotted contiguous blocks of spectrum in the 900 MHz
band.
Table 3: Frequencies allotted to Airtel & Vodafone in the 900 MHz Band in Kolkata 20
Vodafone Airtel Vodafone Vodafone Airtel
890.1 895.0 895.1 900 900.1 902.1 906.6 907.2 909.5 911.5
0.1 0.1 4.5 2.3
Source: Wireless Planning and Coordination Wing. (2015, January 31). Spectrum Holding of Telecom Service
Providers
CASE 3 – Delhi Circle, 900, 1800, 2100 & 2300
19
Wireless Planning and Coordination Wing. (2015, January 31). Spectrum Holding of Telecom Service
Providers
http://www.wpc.gov.in/WriteReadData/Orders/spectrum%20holding%20as%20on%20January%2031_%20201
5.pdf
20 Ibid.
91Table 4 below, shows spectrum held by Airtel in the 900 MHz, 1800 MHz, 2100 MHz and
2300 MHz band in the Delhi Circle.
Table 4: Spectrum held by Airtel in the 900 MHz, 1800 MHz, 2100 MHz and 2300 MHz band in Delhi Circle21
Airtel Airtel Airtel Airtel
900 1800 2100 2300
Source: Wireless Planning and Coordination Wing. (2015, January 31). Spectrum Holding of Telecom Service
Providers
The spectrum in all the above-mentioned bands was acquired by Airtel before 2014 i.e.,
before the unified licensing was allowed in India. Before 2014, Airtel had been using 900/1800
MHz for 2G, 2100 MHz band for UMTS (3G) and 2300 MHz band for LTE technology. Before
the unified licensing regime, the Service Provider had to buy spectrum in different bands in
order to deploy different technologies that were compatible with a specific band.
However, after the introduction of unified licensing guidelines in the year 2014, Airtel had
to roll-out 2G/ 3G in 900 MHz band, 2G/ 4G in 1800 MHz Band, 3G in 2100 MHz band and
4G in 2300 MHz band since contiguous block of spectrum was unavailable in the 1800 MHz
band.
The above discussed cases explain the significance of proper spectrum band planning and
how dispersed spectrum restricts operators from deploying multiple technologies in a given
band which results in under-utilization and misutilization of spectrum which is a valuable and
a limited resource.
3.1.2 Inadequate Availability of Spectrum
Availability of required spectrum is another constraint as there are insufficient bands for
the ever- increasing wireless mobile demands in India. As shown in Table 5, the availability of
licensed spectrum in India is much lower than the U.S. and Europe, and also significantly lower
than other developing countries like Brazil and China.
21 Ibid.
92Table 5: Total Licensed Spectrum in Various Countries (in MHz)22
Country Current Pipeline Hz/
Subscriber
USA 608 55 2.1
Germany 615 0 6.2
France 555 50 9.3
Brazil 554 0 2.0
Japan 500 10 3.3
Australia 478 230 22.8
UK 353 265 7.9
China 227 360 0.5
India23 221 10 0.2
Source: Wireless Telecommunications Bureau. Federal Communications Commission.
While spectrum availability is a larger global problem, it is particularly acute in India.
According to the COAI Annual Report24, operators in India possess significantly smaller
amount of spectrum, approximately 31 MHz on average, compared to international standards.
This is low even in comparison to other Asian countries, such as Bangladesh (37.4 MHz) and
Malaysia (75 MHz).
What is notable from Table 5 is the near absence of a pipeline for future growth of spectrum
in India. Despite having extremely low levels of licensed spectrum, there is no effort to catch
22
Wireless Telecommunications Bureau. (2013, February 26). White Paper: The Mobile Broadband Spectrum
Challenge: International Comparisons, p. 2. Office of Engineering and Technology. Federal Communications
Commission. file:///C:/Users/HP/Downloads/DOC-318485A1.pdf
23
Cellular Operators Association of India. Annual Report 2015- 16.
24
Ibid
93up. This is in stark contrast to China which is at a comparably low level of spectrum availability
as India, but has a significant pipeline. The advanced economies too have serious expansion
plans, despite higher spectrum availability today. One measure of spectrum capacity in a
country is the amount of spectrum per subscriber. As Table 5 highlights, India has very low
capacity at 0.2 Hz per subscriber.
3.1.3 Unreasonably High Spectrum Costs
Spectrum cost in India is one of the highest in the world. Price of spectrum in India runs
around “25 times costlier than the countries such as U.S., France, Singapore, Germany, Spain
and Sweden.”25 By issuing spectrum licenses to Network Operators for 20 years, government
policies force them to bear heavy network roll-out costs without providing them sufficient time
to earn revenue from the capex and opex costs.
Table 6: Spectrum Price in Various Bands in India 26
700 MHz 800 900MH 1800 2100M 2300M 2500M Total
MHz z MHz Hz Hz Hz
Pricing 57,425 29,095 45,583 14,365 18,730 16,340 16,340 1,97,8
(in Cr) 78
Source: COAI Annual Report 2015-16
India faces another big challenge from high telecommunications costs. According to the
Herfindahl-Hirschman Index (HHI)27, India ranks lowest in market concentration at 0.0628.
Figure 2: Herfindahl-Hirschman Index (HHI)29
25
Gary Kim. 2000 MHz of India Mobile Spectrum up for Auction in 2016. http://spectrumfutures.org/2000-mhz-
of-india-mobile-spectrum-up-for-auction-in-2016/
26
Cellular Operators Association of India, COAI Annual Report 2015-16, at 14
27
Measure of Market Concentration and indicates Competition. HHI Index below 0.01 indicates a highly
competitive index, between 0.01- 0.15 depicts unconcentrated index, between 0.15- 0.25 depicts moderate
concentration and above 0.25 indicates moderate concentration. It is calculated over Subscriber Market Share
28
The World Bank. TCdata360. HH Market Concentration Index.
https://tcdata360.worldbank.org/indicators/hh.mkt?indicator=2370&viz=line_chart&years=1988,2015#table-
link.
29
Ibid.
940.12 0.11
0.1 0.09 0.09
0.08 0.07 0.07
0.06 0.06 0.06
0.06 0.05
0.04
0.02
0
Source: The World Bank, TCdata360, HH Market Concentration Index
The low market concentration is the result of high competition, low tariffs and less revenue.
The Average Revenue per Minute for an outgoing call in India is 0.05 INR only30. This is probably
the reason why Indian consumers report one of the highest average minutes of usage per
subscriber per month, at 785 minutes31 while the Average Revenue Per User amounts to only
Rs 101.6532 which is quite low as per global statistics.
While low tariffs and high usage reflect high number of subscribers, the cost structure in
the Indian wireless mobile communications industry predicts that these benefits will be short
lived. With roadblocks in convergence of networks and inadequate spectrum, there is likely to
be a serious plunge in quality of wireless mobile services in India.
From 2010 to 2021 the Indian government has earned around INR 4, 34,015 crores through
seven spectrum auctions. However, the high cost of spectrum in India has led to a digital divide
between urban and rural India thereby affecting the wireless mobile penetration in the country
as the operators are reluctant to invest in network deployment resulting in underutilization as
well as misutilization of the valuable spectrum.
Figure 3: Income from Spectrum Auctions (INR Crore)33
30
Supra 3 at 58.
31
Ibid.
32
Ibid.
33
Supra 7 at 19.
95Income from Spectrum Auctions (INR Crore)
434,015
May-10
Nov-12
Mar-13
Feb-14
Mar-15
106300 109900
61,200 65,800 77,815 Oct-16
9,400 3,600 Mar-21
Total
May-10 Nov-12 Mar-13 Feb-14 Mar-15 Oct-16 Mar-21 Total
Source: World Bank Report 2015
In a highly competitive telecom market such as India, the Regulatory body is facing a
challenge in creating harmony between the Network Operators who wants to generate revenue
while continuing to invest in infrastructure and technology and the public sector’s interest in
earning revenue for the Government through spectrum auctions. High spectrum costs and
unreasonably exorbitant penalties have reduced the profit-earning capacity of the wireless
network operators thereby restraining their investment ability. In order to survive the cut-throat
competition in spectrum auctions, the Operators bid aggressively to acquire heavily- priced
spectrum through financial assistance from banks. The Operators have come under huge debts
and therefore are reluctant to invest in infrastructure in rural areas. Figure 4 shows that the
Indian telecom sector is under a huge debt of INR 7.64 Lakh Crore in the Financial year 2018-
1934.
Figure 4: Debt of Telecom Industry (in ‘000 Cr)35
Figure 4: Debt of Telecom Industry (in '000 Cr)
1000
764
800
600 460
381
400 241 270 283 Debt of Telecom Industry
200 83 124 160 186
0
Yr Yr Yr Yr Yr Yr Yr Yr Yr Yr
2009 2010 2011 2012 2013 2014 2015 2016 2017 2018
Source: KPMG and ASSOCHAM India’s Joint Study on “Accelerating Growth and Ease of Doing Business:
Telecommunications
34
Cellular Operator Association of India. (2020). Annual Report 2018- 19- “5G in India: When and How?” p.
5, https://www.coai.com/sites/default/files/COAI%20Annual%20Report_2018-19.pdf
35 KPMG and ASSOCHAM India’s Joint Study on “Accelerating Growth and Ease of Doing Business:
Telecommunications. August 2017. https://assets.kpmg/content/dam/kpmg/in/pdf/2017/08/Accelerating-
growth.PDF.
96The telecom sector in India also pays huge taxes and levies which amount to 30 percent of
revenues in the sector, which is significantly higher than most other emerging economies.
Table: 7 shows various taxes and levies charged from Wireless Telecom Service Providers in India
and its neighbouring countries.
Table 7: Taxes and Levies in Telecom Sector in India and its Neighbouring Countries36
Regulatory Pakistan Sri Lanka China Malaysia Bangladesh India
Charges
Service 18- 19.5% 25.51% 11% 6% (GST) 19.45% 14%
37
Tax, GST (Sales Telecom (VAT) (Supplementary (Service
Tax) Levy38 (VAT + duty+VAT+ Tax) +0.5%
MSL39+ Surcharge) (Swachh
NBT40+ECL41) Bharat
cess) +
0.5% Krishi
Kalyan
Cess42
License 0.5% LF + 2.04% _ 0.5% 5.5% AGR + 8%
Fee 0.5% R&D BDT 50mn
(per 2G &3G
license
SUC Cost _ _ _ _ 2- 6%
recovery
USO Fund 1.5% of _ _ 6% of 1% of AGR 5%
gross weighted included in
revenue net license fee
revenue
Other Sales tax of LKR 3/Min _ _ SIM Tax of _
Taxes PKR 250 on IDD Levy43 BDT 100 on
new or New or
replacement Replacement
SIM SIM
36
Supra 28 at 40
37
Varies across province
38
For voice / SMS / VAS, only 10.2% for data related services
39
Mobile & fixed subscribers levy
40
Nation Building Tax levied in various sectors
41
Environment conservation levy applicable to multiple sectors;
42
Effective from June 1, 2016
43
Levy on international voice and video calls
97Telecom 20.5%- 22% 27.55% + IDD 11% 12.5% 25.95% + BDT 25- 29%
Levy + Cost Levy 50 Min per
recovery+ License + SIM
SIM Tax Tax
Telecom 2.5% + Cost 12.04%44 + _ 0.5% 6.5% + BDT 50 10- 14%
Specific Recovery + IDD Levy Min Per
Levy SIM Tax License+ SIM
Tax
Source: The World Bank. TCdata360. HH Market Concentration Index.
Despite this situation, total Foreign Direct Investment in Telecommunications sector as in
March 2019 has been around USD 3.28 million.45 The impact of these high costs has also
affected the quality of service which is evident from the growing number of call- drops and
interruptions. There is a need for Telecom Operators to find innovative methods of passive
network sharing and to further invest in cellular infrastructure such as mobile towers.
3.1.4 Inefficient Spectrum Auctions
Inefficient spectrum allocation or utilization can aggravate network congestion. This is not
just a nuisance: it has an economic cost. Smooth access to information and quick transactions
accelerates economic productivity of a country whereas obstructed communications lead to
inefficiency. To use an analogy, a very bad road between two cities might not block the transfer
of goods between the two, but it may lead to costly delays. Network congestion also reduces
Consumer Surplus (CS): demand is then constrained by capacity rather than just by price. The
cost of inefficient spectrum allocation in India is in the order of $3.6 billion per annum on
foregone Economic Surplus46.
A successful spectrum auction must fulfill the following two objectives:
i. Efficient spectrum auction that enables optimal use of spectrum,
ii. Earn maximum government revenue
However, an analysis of spectrum planning and management procedure of India reveals
that so far, the focus has been more on the second objective only. The 2G Scam in 2008
followed by two failed auctions in 2012 and 2013 raises a serious question on the spectrum
planning and management in India.
44
Telecom levy includes 10% MSL; 8. 0.5% or RM 50,000 whichever is higher
45
Department of Industrial Policy and Promotion. Quarterly Factsheet on Foreign Direct Investment January –
March 2019, Ministry of Commerce and Industry. Government of India.
https://dipp.gov.in/sites/default/files/FDI_Factsheet_27May2019.pdf.
46
Global System for Mobile Association. (2014, October). The Cost of Spectrum Auction Distortions. 3.
https://www.gsma.com/spectrum/wp-content/uploads/2014/11/The-Cost-of-Spectrum-Auction-Distortions.-
GSMA-Coleago-report.-Nov14.pdf.
98The Hon’ble Supreme Court of India through its judgment in the 2G Case, dated 2nd
February 2012, quashed the licenses granted on or after 10th January 2008 and ordered to issue
fresh licenses by auctions. After examining the government’s decisions, the Indian Supreme
Court condemned them as “arbitrary,” “unconstitutional,” and “illegal.”47 This decision of the
Hon’ble Supreme Court had a major effect on spectrum allotment procedure. Since then, six
spectrum auctions have been held, two of which had failed (November 2012 and March 2013
Auctions) as there was no bidder due to exorbitantly high spectrum costs. These spectrum
auctions have contributed to unreasonably high spectrum costs by creating an artificial scarcity
of spectrum.
3.1.4.1 First 3G Spectrum Auction (In 2010)- India organized 3G spectrum auctions that
generated 677.1 billion rupees from bidders. Among the successful firms were Bharti Airtel,
which spent 122.95 billion rupees on 13 circles, Vodafone, which spent 116.18 billion rupees
in nine circles, Reliance Communications (85.85 billion rupees) on 13 regions, Aircel (65
billion rupees) on 13 circles, and Idea Cellular (57.69 billion) on 11 areas48.
But wireless operators complained that the government auction raised prices to
unreasonable levels and forced them to take on high debt levels. According to Bharti Airtel,
“the auction format and severe spectrum shortage along with ensuing policy uncertainty drove
the prices beyond reasonable levels. As a result, we could not achieve our objective of a pan-
India 3G footprint in this round49.”
Later auctions also sold spectrum at unreasonably high prices. According to a report by
Coleago Consulting, 15 percent of the 850MHz and 1800MHz bandwidth auctioned between
2012 and 2014 was “unutilized,” despite pressing industry needs. The auctions suffered from
“high reserve prices, technology bias, regulatory uncertainty and historic spectrum
fragmentation.50”
3.1.4.2 Second Spectrum Auction (November 2012)- Following the directions of the Hon’ble
Supreme Court in 2G Case, the first auction was held for spectrum in the 1800 MHz and 800
MHz bands in November 2012. Due to high reserve price of spectrum, there was no bidder for
the spectrum in the 800 MHz band. However, in 1800 MHz, except in the Licensed Service
Areas of Delhi, Mumbai, Karnataka and Rajasthan, some spectrum was sold in all the other
service areas and 40% of spectrum remained unsold51.
3.1.4.3 Third Auction (March 2013)- In the 2013 spectrum auction, the Government planned
to auction 50 MHz of airwaves in the 1800 MHz band and 76.25 MHz of spectrum in the
47
Centre for Public Interest Litigation & Others v. Union of India & Others. Writ Petition (Civil) No. 423 of
2010. http://www.indiaenvironmentportal.org.in/files/2G%20spectrum.pdf
48
Nicole McCormick. (2010, May 20). India’s 3G Auction Raises $15b. TELECOMASIA.NET.
http://www.telecomasia.net/content/indias-3g-auction-raises-15b.
49
Ibid
50
Supra 46.
51
Telecom Regulatory Authority of India. Consultation Paper No. 06/2015, (2015, November 26). Consultation
Paper on Valuation and Reserve Price of Spectrum in 700, 800, 900, 1800, 2100, 2300 and 2500 MHz Bands. 4.
99800 MHz band.52 The Government put CDMA spectrum worth ₹64 billion up for auction53 and
fixed the price of 900 MHz, two times higher than 1800 MHz.54
No Operator tendered bids for spectrum in 1800 MHz and 900 MHz bands due to high
reserve prices, and the sole bidder in the auction was Sistema Shyam Teleservices Limited
(SSTL), under the brand name MTS India who bid for spectrum in the 800 MHz band. Around
70% of Spectrum in 850 MHz Band remained unsold.
3.1.4.4 Fourth Auction (February 2014) - In 2014, the Department of Telecom (DoT)
auctioned 2G spectrum in 900 MHz and 1800 MHz Bands. The Government earned 612
billion INR from the spectrum auction. The most expensive telecom circle in both 900 &
1800 MHz Bands55 was Delhi at a price of 7409.6 million INR and 728 million INR per
operator. Delhi and Mumbai together accounted for 57% of the total bids.56 From these figures,
it can be easily assessed that irrational spectrum pricing is one of the biggest reason in creating
a digital divide between urban and rural India as after acquiring expensive spectrum, Operators
prefer to invest in Metropolitan and Class A circles, for which they already have spectrum and
avoid investing in spectrum for rural parts of India in order to cut down on network roll-out
costs.
In India, three consecutive failures in fully allocating the available 1800MHz spectrum
between 2012 and 2014 has decelerated the speed of network deployment. Spectrum policy in
India is similar to a descending ‘Dutch auction57’, whereby the reserve price is reduced
gradually over repeated iterations. But each failed attempt of efficient allocation of spectrum
postpones the economic benefits associated with the commercial use of this resource. This
problem could have been avoided if spectrum could have been priced reasonably, allowing the
market to determine the final prices paid.
3.1.4.5 Fifth Auction (March 2015) – In 2015, the government auctioned spectrum in the 800,
900, 1800, and 2100 MHz Bands which are suitable for mobile broadband services. Cellular
Operators bid aggressively for these Bands in the auction because acquiring spectrum in these Bands was
crucial for their future roll-out plans. In the case of Aditya Birla Group’s Idea, the company’s
“900 MHz spectrum in nine circles accounts for a whopping 72 percent of its revenue.58” With
so much of its revenue dependent on a relatively small number of geographic areas, it put the
52
Sounak Mitra. Telecom spectrum auction application process ends today. Business Standard.
http://www.business-standard.com/article/companies/telecom-spectrum-auction-application-process-ends-today-
113022500105_1.html
53
Press Trust of India. (2013, March 10). Second round of spectrum auction from tomorrow, SSTL lone bidder,
THE ECONOMIC TIMES. http://articles.economictimes.indiatimes.com/2013-03-
10/news/37598162_1_spectrum-auction-bwa-spectrum-megahertz-spectrum.
54
Ibid.
55
Sunny Sen. Searching for a Voice. Business Today.http://www.businesstoday.in/magazine/focus/why-
reliance-jio-is-bidding-aggressively-for-2g-spectrum/story/203172.html.
56
Nikhil Pahwa, Medianama, India’s 2014 2G Auction Ends: Operator & Circle Results,
http://www.medianama.com/2014/02/223-india-2g-auction-2014-results-operator-circle-winners/
57
a method of selling in which the price is reduced until a buyer is found
58
Nevin John. Paying the Price. Business Today. http://www.businesstoday.in/magazine/focus/spectrum-bids-
to-add-to-telecos-debt-burden-cause-high-tariff/story/217164.html.
100company (and many other Operators) in a vulnerable position as it moved into the future. In
the 1800 MHz band only three circles had a minimum of 5MHz of contiguous spectrum as a
result this band was allocated to a limited extent only.
3.1.4.6 Sixth Auction (October 2016)- The latest auction of 2016 is a staunch example of poor
spectrum planning and short-sighted approach in deciding reserve price before auctions in India
wherein 40% of the airwaves remained unsold due to unrealistically high spectrum pricing.
A total of 2354.55 MHz59 of spectrum ranging across the 7 bands of 700 MHz, 850 MHz,
900 MHz, 1800 MHz, 2100 MHz, 2300 MHz and 2500 MHz was put up for sale across 22
different circles. This was the first auction in India in which 700 MHz band spectrum was put
on auction despite repeated requests from cellular operators for postponing the auction of this
Band. Due to high pricing, no one bid for 700 MHz Band, offered for the first time in an
auction. It was auctioned at a reserve or base price of Rs 11,485 crore per MHz.
For buying pan-India 5 MHz spectrum in this band, a telecom operator would have to pay
a minimum of Rs 57,425 crore if no counter bids came in. This band alone had the potential to
fetch bids worth over Rs 4 lakh crore. The telecom operators, who have a debt of Rs 3.80 lakh
crore60, stayed away from 700 MHz spectrum and mostly submitted bids in 2500 MHz, 2300
MHz, 800 MHz and 1800 MHz bands.
3.1.4.7 Seventh Auction (March 2021)- The recent 4G spectrum auction was also
unsuccessful as only 37 percent of spectrum was sold. The 700 MHz Band which is considered
to be the most crucial band for 5G technology also remained unsold due to its high price. The
spectrum acquired by the operators in this auction will definitely augment 4G penetration in
India but India is way behind other countries in adopting 5G technology and in order to fulfil
the objectives set- out in the National Digital Communications Policy 2018, India has to create
an ecosystem for faster deployment of advanced technologies.
The above analysis of spectrum auctions in India clearly reveals that the government has
concentrated more on short term maximization of profits through auctions, penalties, taxes etc.
at the cost of long- term economic as well as technological growth of the sector. Unreasonably
high spectrum prices overwhelmingly increase the fixed cost for network operators thereby
becoming a hindrance in infrastructure investments which eventually leads to poor quality of
service which adversely affects the end- users. Government policies must be futuristic that
allows smooth adoption of new technologies and developments thereby enabling accelerated
growth of the sector and consumer satisfaction.
3.2 Recommendations For Future Action:
A comparative analysis of Indian telecom sector with other developed countries as
discussed in preceding paras reveal investments in telecom infrastructure and futuristic
59
Pawan Bali. (2016, October 7). Higher Prices Fail Spectrum Auctions. DECCAN CHRONICLE.
http://www.deccanchronicle.com/business/in-other-news/071016/higher-prices-fail-spectrum-auction.html
60
Ibid.
101spectrum policies are strong enablers of economic growth. Clear policies, affordable devices,
harmonized spectrum bands, convergence of networks, efficient spectrum pricing and planning
have a huge potential to drive the overall economy. According to a McKinsey Global Institute
Study, with efficient spectrum planning and execution, India could boost Mobile Internet
Penetration from its current 8- 10% up to 50- 60% by 202561. The report further claims that
with the adoption of other technological advancements, the country’s Gross National Product
can rise from $ 550 Billion to $ 1 Trillion by 2025.62 These objectives can only be achieved
when the Government does not kill the goose that lays the golden eggs due to its greed to earn
short- term revenues through high pricing, penalties and taxes.
3.2.1 Efficient spectrum planning before auctions-
The long lead time needed for the introduction of new services and new spectrum
bands requires long-term planning. India should start planning now for its spectrum
needs in 2020–2025. At WRC-15 additional spectrum bands were identified for mobile
broadband, particularly the L band (1427–1518 MHz), part of the C band (3.3–3.4 GHz)
and supporting sub-700 MHz band (470–698 MHz). The Indian government should
now commit to these bands at the national level and prepare a roadmap for the largely
unused bands. The National Digital Communications Policy- 2018 should be revised to
include newer bands for 5G technology in India. At the same time, use of any
unlicensed services in the 470-698 MHz band should not compromise licensing the
band for mobile broadband and opportunities for mobile operators to introduce new
services envisaged over 5G.
3.2.2 There should be a Time- Table for future Spectrum Auctions-
Operators should be pre- informed about the availability of spectrum in all the bands
well in advance before the auctions. This step would enable them to take bidding
decisions based on facts and information and not desperation.
3.2.3 Harmonization of Spectrum at National as well as International level-
Harmonization of spectrum at International, National and Regional level is
imperative to avoid wastage of spectrum and can further free up a good amount of
spectrum. For example, in India, Telecom Service Providers have been allotted
different spectrum frequencies in the same band for cities within a circle for which they
have obtained a license. This raises network roll- out costs and leads to spectrum
misutilization. Similarly, when 1800 MHz and 2100 MHz bands were the most popular
bands globally for 4G and 3G respectively, in India Operators had been using 2300
MHz band to deploy LTE technology due to unavailability of contiguous spectrum in
the 1800 MHz band resulting in higher network roll- out costs that slowed down the
penetration of 4G in the country. Although the government has successfully harmonised
61
Noshir Kaka Et Al. (2014, October). India’s Technology Opportunity: Transforming work, empowering people.
McKinsey Global Institute. 5.
62
Id at 6.
102and made available additional spectrum in the 1800 MHz and 2100 MHz bands for the
2016 auctions but new uses of mobile technology will require greater access to
spectrum mid- band and mm- wave spectrum for 5G technology.
3.2.4 Spectrum Trading and Sharing should be encouraged-
Spectrum band planning should be compatible with the policies related to unified
licensing, spectrum sharing and trading which would enable faster penetration of
broadband services in India. Clear and transparent policies on spectrum sharing and
trading will also allow efficient utilisation of spectrum which is a limited resource.
3.2.5 Spectrum renewal and Spectrum Usage Charges to be made simple-
Equally, the government must lower revenue-share-linked spectrum usage charges
that were put in place prior to the policy of market-linked spectrum costs discovered
through auctions. This will allow the industry to invest precious capital in rolling out
networks, benefiting society rather than pouring money behind just acquiring
spectrum—a benefit that leads only to short-term gain for the exchequer.
3.2.6 An Artificial Scarcity of Spectrum should be eliminated to reduce the cost of doing
business-
The cost of spectrum in India is extremely high. This is because of the artificial
spectrum scarcity that has been created by putting only very limited spectrum up for
auction with much of it remaining with defence and government operators who are
immersed in debt and are sitting on unused spectrum. The government must make
efforts to free up this spectrum and put it for auction in the near future which would
help in meeting up the demands of the telecom service providers
3.2.7 More spectrum should be made available in MHz bands-
Operators cannot provide high- speed data services without adequate spectrum.
Much of the spectrum in India is with the defence and what is available is fragmented
because there are too many players. As a result, the average holding of Indian
companies is 31 MHz compared to 50 MHz in western countries63. The result of these
inadequate holdings is the inefficient use of spectrum by operators with fewer
customers on the one hand and congested networks and poor customer experience on
the other. Additionally, it results in the need for more towers and more energy—an
outcome that is good for no one.
63
BusinessToday.in. (2021, January 25). 5G Spectrum ‘Reasonable’ Pricing Critical for Future of Telecom
https://www.businesstoday.in/industry/telecom/story/5g-spectrums-reasonable-pricing-critical-for-future-of-
telecom-285417-2021-01-25
1033.2.8 Reforming policies and regulations to achieve the objective of ‘Digital India’-
While market dynamics can shift quickly, regulations and policies have failed to
catch up with the pace of technological developments and market demands, and this is
creating uncertainties and ambiguities that becomes a hindrance in meeting policy
objectives which in turn leads to customer dissatisfaction. Cellular operators are subject
to regulatory and public policy obligations that other players in the digital ecosystem
are not, giving the latter more flexibility and competitive advantage therefore
obligations placed on Telecom service providers should be reduced. The current
licensing framework therefore needs reforms which are in conformity with
technological developments and market demands.
3.2.9 The cost of doing business be reduced-
Mobile operators in India are under huge debts due to high spectrum pricing,
administrative fees and levies. Quick and successful deployment of networks calls for
smooth approval processes and practical tax and fee structures that encourage
investments in infrastructure. In the recently concluded auctions in March 2021, the
government failed to sell any spectrum in the 700 MHz band. The entire spectrum in
this sought-after band went unsold due to an unrealistically high reserve price. This
could have a negative impact on investment in next-generation networks at a time when
demand for mobile data is growing rapidly. Reserve prices should be set conservatively
so as not to undermine the price-discovery function of the auction that is central to the
market-based approach to spectrum management The Universal Service Obligation
Fund (USOF) levy is also an area that merits review. The current state of mobile
coverage in India does not warrant the 5% USOF levy, particularly compared to
universal service rates in other countries.64 The state of connectivity in India would be
well served by a review of the effectiveness of the USOF in supporting broadband
deployment.
3.2.10 Ease of doing Business be Improved-
Although the Government has allowed 100% Foreign Direct Investment in Telecom
Sector, yet the foreign investors are reluctant in investing further in India due to delay
in policies and uncertain and ambiguous market environment. Furthermore, the process
of establishing business in India is highly complicated with multiple windows and
taxation compliances, as discussed in preceding paras. The government must provide
smooth approval processes. Similarly, introduction of single window clearance will
reduce unnecessary administrative costs. In November 2016, the government has issued
the Right of Way Policy to enable faster deployment of network that has been
welcomed by Telecom Service Providers but regulatory obstacles such as overly
restrictive electromagnetic field (EMF) exposure slow the rollout of networks and
discourage investment. Updates in 2017 to the World Health Organization’s EMF
64
Global Mobile Suppliers Association. (2013, April). Universal Service Fund Study p.146.
104health risk assessment and the opening of the forthcoming EMF Portal provide an
opportunity for India to adopt globally accepted technical standards, removing a barrier
to efficient mobile network deployment.
4. CONCLUSION
The Global Economic Prospects Report by World Bank forecasts Indian economy to grow
at a rate of 8.3 percent in the Year 202165 and despite facing the economic challenges due to
the second wave of pandemic, it is likely to be the fastest-growing economy in the world by
2022 according to the United Nations report66. The socio-economic landscape of Asia's third-
largest economy has seen many ups and downs after British rule. The economic growth has
accelerated significantly in the last two decades to reach a GDP of USD 3.04 trillion67 and the
foreign exchange reserves have touched the record high of USD 608 Billion68 by June 18, 2021
enabling India to face external shocks. Amidst all these positive developments, there is one
factor, i.e., ‘Corruption’ which is posing a major challenge in the growth and development of
the Indian economy. The Corruption Perceptions Index 2020 puts India on the 86th position
among 180 countries in the survey69.
Trust is a fundamental element while doing business and though India provides a
favourable platform, still it ranks 63 amongst 190 countries surveyed in the World Bank's Ease-
of-Doing Business Report 202070 due to unfair business practices in financial dealings,
government spending, banking policies, credit policies, tax and trading, etc. prevalent since
independence. It is expected that with demonetization and digitalization initiatives by the
government, the level of corruption will decelerate in India. Transparency, Accountability and
Accessible Information are the three pillars of good governance in any country. Therefore, it
is imperative to take significant steps in this direction to put India on a better footing on global
platform.
The evolving digital and communication technologies are providing innovative ways to
counter corruption faced by the country on a large scale. The government through its Digital
India program has set an ambitious goal of addressing these challenges using 5G Technology,
ICT (Information and Communications Technology) and SMAC (Social, Mobile, Analytics,
Cloud) technologies.
65
Global Economic Prospects, World Bank, June 2021, p. 4
https://openknowledge.worldbank.org/bitstream/handle/10986/35647/9781464816659.pdf
66
World Economic Situation and Prospects as of mid- 2021. (2021, May 11). p. 3
https://www.un.org/development/desa/dpad/wp-content/uploads/sites/45/publication/WESP2021_UPDATE.pdf
67
Statistics Times. (2021). GDP of India. https://www.statista.com/statistics/263771/gross-domestic-product-
gdp-in-india/
68
The Reserve Bank of India. (2021, June 18). Weekly Statistical Supplement
https://rbidocs.rbi.org.in/rdocs/Wss/PDFs/2T_18062021C2AB02D74E124275A1720C1883E77980.PDF
69
Transparency International. (2020). Global Perceptions Index 2020,
https://www.transparency.org/en/cpi/2020/index/nzl#
70
The World Bank. (2020). Doing Business https://www.doingbusiness.org/en/data/exploreeconomies/india
105Today, only ‘Technology’ has the potential to ensure good governance and transparency in any country. With the evolution of wireless mobile communications and broadband penetration in India, Technology has become a powerful instrument to reinforce the ‘Era of Truth’ (Satyuga). With the introduction of ‘Digital India Programme’, Technology can lead India from Untruth to Truth, from darkness to light and from Death (corruption) to Immortality thereby achieving the national motto of ‘Satyamev Jayate’ (“Truth Alone Triumphs”) in its true letter and spirit. 106
References

BusinessToday.in. (2021, January 25). 5G Spectrum ‘Reasonable’ Pricing Critical for Future

  of Telecom https://www.businesstoday.in/industry/telecom/story/5g-spectrums-reasonable-

  pricing-critical-for-future-of-telecom-285417-2021-01-25

Catherine Haslam. (2016, November 29). A Guide to India’s Telecom Market, India Calling

  Info. http://www.indiacallinginfo.com/india-telecom-circles

Cellular Operator Association of India. (2020). Annual Report 2018- 19- “5G in India:

  When and How?” p. 5,

  https://www.coai.com/sites/default/files/COAI%20Annual%20Report_2018-19.pdf

Cellular Operators Association of India, COAI Annual Report 2015-16, at 14

Centre for Public Interest Litigation & Others v. Union of India & Others. Writ Petition

  (Civil) No. 423 of 2010.

  http://www.indiaenvironmentportal.org.in/files/2G%20spectrum.pdf

Centre for Strategic and International Studies. (1991, September 19). The New Spectrum

  Mudwrestle: WARC 1992 and Beyond (Washington D.C.: CSIS International

  Communications Studies, Symposium, 1992), (p. vi).

107
You can also read