1957, 2020 Big Pandemics and their Economic, Social and Political Consequences - Niall Ferguson, Hoover Institution, May 20, 2020
←
→
Page content transcription
If your browser does not render page correctly, please read the page content below
1918, 1957, 2020
Big Pandemics and their Economic,
Social and Political Consequences
Niall Ferguson, Hoover Institution, May 20, 2020
Taking you back in time … to August 1957

                              • “I wanna squeeze her but I’m
                                way too low / I would be runnin’
                                but my feet’s too slow / Young
                                man rhythm’s got a hold of me
                                too / I got a rockin’ pneumonia
                                and a boogie woogie flu. / I want
                                to scream ….”—Huey “Piano”
                                Smith and His Clowns.
                              • The single sold over one million
                                copies, achieving gold disc
                                status, and got to No. 52 in the
                                Billboard chart.
                                                                1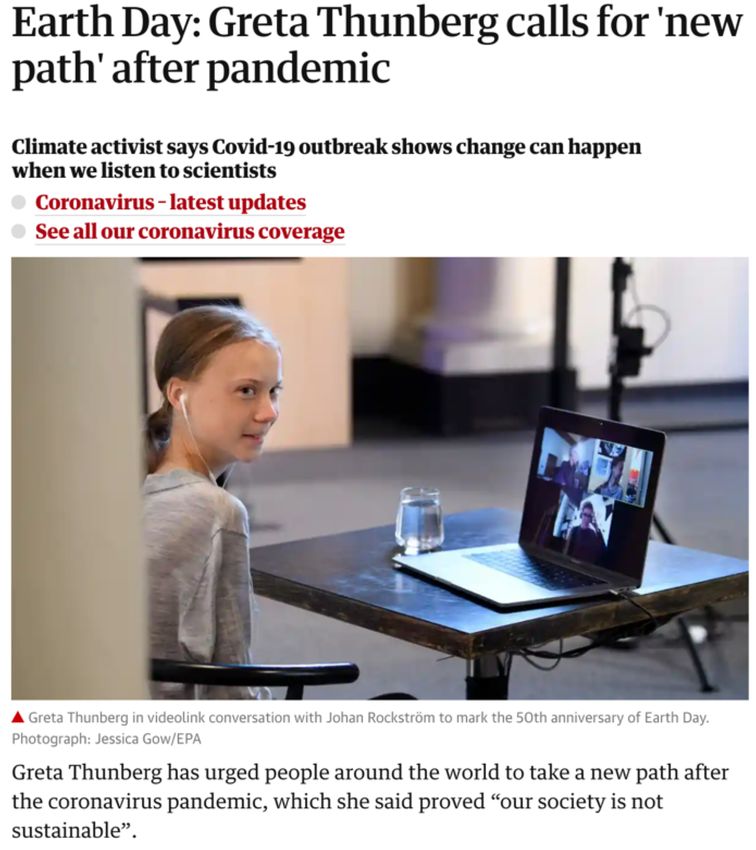
And to October 1957

• What did Eisenhower and Queen
  Elizabeth II have in common?
• They were both vaccinated
  against influenza A (H2N2) prior
  to her state visit to the United
  States.

                                     2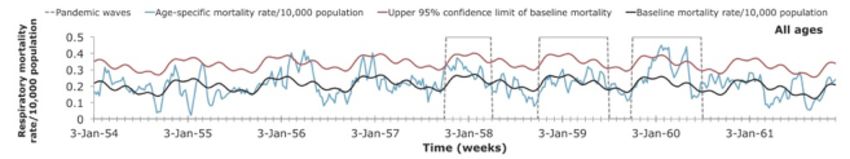
And to October 1957

• What did Eisenhower and Queen
  Elizabeth II have in common?
• They were both vaccinated
  against influenza A (H2N2) prior
  to her state visit to the United
  States.

                                     3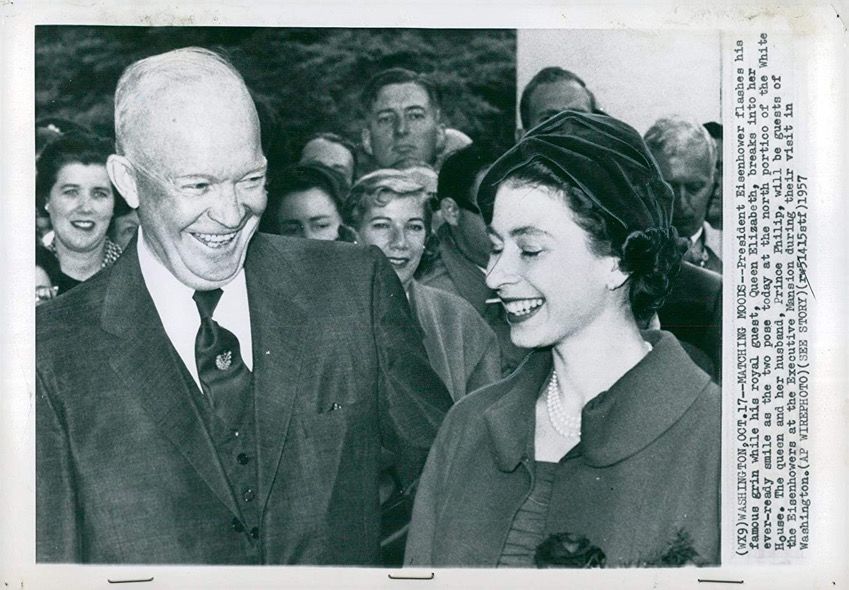
COVID-19 in historical context
                                                                                                                                     Percentage
                                                                    Lower Est.   Avg. Est.   Upper Est.     Rescaled      Population
                                            Start Year   End Year                                                                    of world
                                                                      (1,000)     (1,000)     (1,000)        (1,000)     (1,000,000)
                                                                                                                                     population
    1   Plague of Justinian                    541         542         40,000       70,000     100,000       2,516,136           213      32.86%
    2   Black Death                           1331        1353         50,000      125,000     200,000       2,434,803           392      31.89%
    3   Antonine Plague                        165         180          5,000        7,500      10,000         283,355           202       3.71%
    4   Cocoliztli Epidemic                   1545        1548          5,000       10,000      15,000         165,668           461       2.17%
    5   Third plague pandemic                 1855        1960         22,000       22,000      22,000         133,173         1,263       1.74%
    6   Spanish flu                           1918        1920         39,000       39,000      39,000         129,205         2,307       1.69%
    7   Smallpox epidemic                     1520        1520          5,000        6,500       8,000         107,684           461       1.41%
    8   Japanese smallpox epidemic             735         737          2,000        2,000       2,000          67,690           226       0.88%
    9   HIV/AIDS                              1920        2020         25,000       30,000      35,000          61,768         3,712       0.81%
   10   Third Plague                          1885        1885         12,000       12,000      12,000          55,439         1,654       0.73%
   11   Plague of Cyprian                      250         266          1,000        1,000       1,000          37,227           205       0.49%
   12   Cocoliztli Epidemic of 1576           1576        1580          2,000        2,250       2,500          31,045           554       0.41%
   13   Persian Plague                        1772        1772          2,000        2,000       2,000          15,444           990       0.20%
   14   Italian plague                        1629        1631            280          640       1,000           8,831           554       0.12%
   15   Plague of Athens                      -429        -426              5           53         100           8,102            50       0.11%
   16   Encephalitis lethargica pandemic      1915        1926          1,500        1,500       1,500           6,930         1,654       0.09%
   17   Third cholera pandemic                1852        1860          1,000        1,000       1,000           6,053         1,263       0.08%
   18   Russian flu                           1889        1890          1,000        1,000       1,000           4,620         1,654       0.06%
   19   Sixth cholera pandemic                1899        1923            800          800         800           3,696         1,654       0.05%
   20   Plague of Sheroe                       627         628            100          100         100           3,594           213       0.05%
   21   Asian flu                             1957        1958            700        1,100       1,500           2,852         2,948       0.04%
   35 COVID-19 (current as of 05/01/2020)     2019          ?             297          310          323           310         7,643     0.0041%    4
                                                                                                          Cirillo and Taleb (2020), with amended figures in red
Is this 1918-19? Surely not

• The Imperial College
  epidemiologists saw 2.2m as a
  possible worst case for U.S.
  mortality in 2020 without social
  distancing and lockdowns, but I
  find it hard to believe that SARS-
  CoV-2 is as dangerous as the
  1918-19 Spanish influenza.
• That would mean a worldwide
  death toll of up to 160m, and a
  U.S. excess death toll of 1.76m.

                                       5
What about 1957-58?

• The excess death toll was around
  1.1m worldwide, including around
  up to 116,000 in the U.S.
• “The global mortality rate of the
  1957–1959 influenza pandemic
  was moderate relative to that of
  the 1918 pandemic but was
  approximately 10-fold greater than
  that of the 2009 pandemic.”
• Scaled up to 2020, here’s what that
  would mean: 130,000-215,143
  additional dead Americans, again
  without social distancing and
  lockdowns.
                                               6
                                        Viboud et al. (2016)
Like COVID-19, the 1957 “Asian influenza” also went around
the world, but mostly by boat not plane

                                                                   7
                                                             Nicholas Christakis
Worldwide, the 1957-58 flu killed around 1.1 million people

               Country-specific influenza-related excess mortality rates from respiratory
                                          causes, 1950–1970
                                                                                                   8
                                                                                            Viboud et al. (2016)
The Asian flu struck the U.S. in the fall
          New respiratory cases as reported through the National Health Survey, September-December 1957

                                                                                                                    9
                                                                                                          Henderson et al. (2009)
But struck again in January and February 1958
Weekly pneumonia and influenza deaths in 108 Cities, September 1957-April 1958
10
Henderson et al. (2009)And again in 1959-60
11It was a nationwide pandemic
12Teenagers had the highest relative excess death rate
• Although the highest excess death rates were
in the age groups under 5, 65-74 and 75 years
and over, and although two around two thirds
of excess deaths were of people older than
65, the relative excess death rate was over
four times the expected rate in the 15-19-year
age group.
• In other words, contemporaries would have
anticipated higher mortality amongst the
elderly at the time of year the Asian Flu
struck; they would not have anticipated it
amongst teenagers.
• The highest attack (i.e., infection) rates were
in the age groups from school-age children to
young adults up to 35 or 40 years of age.
Adults over 65 years of age accounted for 60%
of influenza deaths, but that was an
abnormally low share. In 1960 they
represented fully 80% of all excess
pneumonia and influenza deaths.
13
Serfling, Sherman and Houseworth (1967); Henderson et al. (2009)This was because teenage life was one big superspreader event
Boy Scout sub-camp at the 1957 Jamboree at Valley Forge
14The public health response
• “Measures were generally not taken to close schools, restrict • Special meeting of the Association of State and Territorial
travel, close borders, or recommend wearing masks. Health Officers (ASTHO) in Washington, DC, on August 27-28.
• “Quarantine was not considered to be an effective mitigation • ASTHO pointed out that “[p]revention, which in the absence
strategy and was ‘obviously useless because of the large of effective means to stop the spread of infection[,] resolves
number of travelers and the frequency of mild or inapparent itself into an immunization program.”
cases.’ …
• “In early October, the Nassau County Health Commissioner in
New York stated that ‘public schools should stay open even in
an epidemic’ and that ‘children would get sick just as easily
out of school.’ …
• “ASTHO encouraged home care for uncomplicated influenza
cases to reduce the hospital burden and recommended
limitations on hospital admissions to the sickest patients. …
most were advised simply to stay home, rest, and drink
plenty of water and fruit juices.
• “Hospital admissions did increase, but in the 3 cities that we
reviewed—Pittsburgh, Baltimore, and New York hospitals had
a surge capacity sufficient to handle the patient load.”—
Henderson et al. (2009)
15The race for a vaccine
• U.S. received its first influenza specimens from Hong Kong on May 13 and Maurice
Hilleman definitively identified the new strain on May 22.
• Public Health Service released the first cultures of the Asian influenza virus to
manufacturers even before Hilleman had finished his analysis.
• Trials were conducted in early July with 700 subjects (CDC personnel in Montgomery and
Atlanta; Atlanta federal penitentiary).
• On July 26 doctors at Fort Ord in California began to inoculate recruits to the military.
Next in line were doctors, nurses and other health care workers—not to mention the
President and the Queen.
• Surgeon General Leroy Burney announced on August 15 that vaccine was to be allocated
to states according to population size, and it was to be distributed by the manufacturers
through their customary commercial networks.
• By the late summer, six companies were producing a vaccine, including Merck, Sharp and
Dohme. The vaccine was packaged as a single 1.0-ml dose.
• Approximately 4 million doses were released in August, 9 million in September, and 17
million in October.
• Effectiveness was found to range from 53% to 60% in studies conducted during the
outbreak.
16Did the pandemic cause a recession?
17
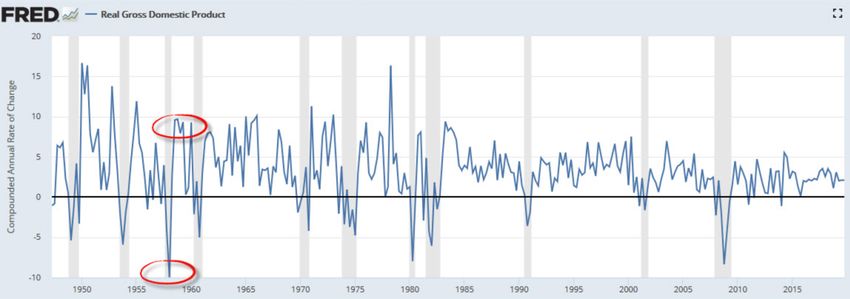
Marginal RevolutionU.S. economic indicators, 1955-1958
• Proximate causes of the 1957-58 recession were
rising market interest rates, which the Fed had
half-heartedly followed, and federal defense cuts.
• The CBO describes it as an event that “might not
be distinguishable from the normal variation in
economic activity”—had it not occurred during the
1957-58 recession.
• August 1958 Federal Reserve review of the
recession did not even mention the pandemic as a
potential contributing factor to the downturn, and
noted that restaurants, bars, and malls were some
of the least impacted industries.
• “Data on telephone workers in 36 cities showed
that the epidemic peaked during the week ending
October 19 with an excess absenteeism rate of
only 2.7%. In the cities tracked, excess absenteeism
during each city’s peak week varied from 3.0% to
8.0%.”—Henderson et al. (2009)
18
FREDIt’s hard to believe Americans in 1957 would have stood for this
Unemployment Fatality Ratio: number of initial state unemployment claims since March 14, 2020, per one COVID-19 death in state
19
GreenmantlePolitical “consequences”
President (second Senate seats House seats
midterm year) lost lost
Grant (1874) -10 -93
Cleveland (1894) -4 -127
Wilson (1918) -5 -22
Roosevelt (1938) -7 -72
Truman (1950) -5 -28
Eisenhower (1958) -13 -48
Nixon (1974) -4 -48
Reagan (1986) -8 -5
Bush (2006) -6 -30
Obama (2014) -9 -13
20Looking back without anger
• ”From one watching the pandemic from very close range,
though, it was a transiently disturbing event for the population,
albeit stressful for schools and health clinics and disruptive to
school football schedules.”—D. A. Henderson in Henderson et
al. (2009), p. 272.
• “For those who grew up in the 1930s and 1940s, there was
nothing unusual about finding yourself threatened by
contagious disease. Mumps, measles, chicken pox, and German
measles swept through entire schools and towns; I had all four.
Polio took a heavy annual toll, leaving thousands of people
(mostly children) paralyzed or dead. There were no vaccines.
Growing up meant running an unavoidable gauntlet of
infectious disease. For college students in 1957, the Asian flu
was a familiar hurdle on the road to adulthood.”—Clark
Whelton, “Say Your Prayers and Take Your Chances:
Remembering the 1957 Asian Flu Pandemic,” City Journal,
March 13, 2020.
Clark Whelton, back row, third from the right
21Then …
22Then … and now
23
© Niall Ferguson 2020You can also read