2022 AUSTRALIAN AFFORDABLE HOUSING REPORT - STANDARD HOUSE ENVIRONMENTAL SCAN
←
→
Page content transcription
If your browser does not render page correctly, please read the page content below

2022
AUSTRALIAN AFFORDABLE
       HOUSING REPORT
  STANDARD HOUSE ENVIRONMENTAL SCAN
AUSTRALIAN AFFORDABLE HOUSING E-SCAN –
The Standard ‘Old’ House

Contents
Executive Summary....................................................................................................................................3

Background to the 2021 Standard House Report.......................................................................................5

Section A – COVID Housing Boom.............................................................................................................8
    A1. Global Housing Trends........................................................................................................................... 8
    A2. Domestic Trends................................................................................................................................... 10
    A3. Australia’s Housing Boom.................................................................................................................... 13
    A4. Forecasting the Future.......................................................................................................................... 19

Section B – Housing Activity and Affordability Today..............................................................................25
    B1. The Vanishing Affordable Housing Market......................................................................................... 26
    B2. Impacts on Affordability....................................................................................................................... 35

Section C – The Standard ‘Old’ House.......................................................................................................40
    C1. Why Old Homes are Part Their Use-By Date....................................................................................... 40
    C2. Rebuilds, Redevelopment and Revitalisation...................................................................................... 42
    C3. The Benefits of New Housing Development....................................................................................... 44
    C4. Universal Design.................................................................................................................................... 53
    C5. Construction, Manufacturing and Retail Jobs ............................................................................. 54
        – Sustainable Housing Innovations
    C6. Secondary Impacts – Retail................................................................................................................. 59

Section D – Setting the Right Policy for Affordability...............................................................................61
    D1. CHP Capacity......................................................................................................................................... 61
    D2. CHP, Government, and Industry Partnerships..................................................................................... 63
    D3. ESG Investment/Long Term Equity...................................................................................................... 69
    D4. Shared Equity......................................................................................................................................... 72
    D5. Build-to-Rent.......................................................................................................................................... 72
    D6. National Plan for Housing.................................................................................................................... 74

Conclusion................................................................................................................................................75

About the Authors and Contributors.........................................................................................................76

Contributors and Sources.........................................................................................................................77
Executive Summary
Released at the time of the COP26 Glasgow Climate              hitting our Paris Agreement commitments for net-
Conference, this latest CoreLogic Environmental Scan           zero emissions.
documents the past 18 months where house prices
                                                               Australia’s Long Term Emissions Reduction Plan
did not succumb to the forecast downturns from the
                                                               taken to Glasgow says, technology is the key to
COVID-19 pandemic.
                                                               balancing these global emissions and economic
With lockdowns, border closures and rising                     development objectives, but the ageing housing
unemployment, the construction industry, a key                 stock will ‘block the chimney’ on any targets until
driver of employment and economic activity, was                sustainable technology takes over from coal, which is
facing a potential ‘valley of death’ with dwelling             decades away.
commencements expected to collapse.
                                                               The twin climate and COVID-19 crises have reinforced
Despite dire forecasts, Australia broke records in             the unsuitability of Australia’s + 30-year-old housing
housing commencements and rents increased by                   stock on lower income families and younger
10 per cent in many regions. However, this activity is         Australians, who are disproportionately living in
a ‘bring forward’ based on low interest rates, strong          lower energy rated homes with adverse financial and
household balance sheets for many and the largest              wellbeing impacts.
return of Australians from offshore since World War II.
                                                               As we emerge from some of the world’s longest
In late October 2021, the Australian Government                lockdowns, countless Australians are only too well
NHFIC Review estimated that an investment of $290              aware that average dwellings are cold in winter, hot
billion will be required over the next two decades             in summer and prohibitively expensive to cool and
to meet the current and projected shortfall in the             heat. Added to this, these homes are not designed for
stock of social and affordable housing. Meeting that           universal lifelong living, whether that’s accessibility for
shortfall will require active participation by the private     prams, ageing in place, or living with disabilities.
sector and high levels of collaboration across all
levels of government.1
                                                               Key Environmental and Social
AHURI argues that an additional 727,300 social                 elements
housing dwellings are required by 2036 nationwide
                                                               • There are almost 8 million (out of 10.6m) existing
to meet future projected need, or an annual average
                                                                 homes that are often inefficient (the residential
growth of 5.5 per cent.2
                                                                 sector contributes 18-20% of GHG emissions) and
The housing market has seen scores of young                      the impacts of this for achieving net zero, as well
Australians and families locked out of affordable                as increasing the supply of social and affordable
housing. A pipeline of new, efficient housing could              housing, is substantial.
play a structured role on reaching net Australia’s
                                                               • The National Net Zero Emission plan forecasts
carbon zero targets, whilst also aiding housing
                                                                 that by 2050, around 7 million homes will not be
affordability.
                                                                 subject to improved energy efficiency measures in
Renewal of Australia’s ageing housing stock offers               the National Construction Code3 with no retrofitted
a multitude of benefits that will supercharge the                improvements to improve the fabric of older
emissions reduction and boost the economy, to make               homes.
climate ambitions a reality and work through the other
                                                               • They often sit on larger 800-1000sqm lots, sit
side of COVID.
                                                                 on flat land close to commuter routes and jobs,
Almost 8 million older Australian homes are now                  with clear benefits of new housing development,
well past their use by date, contributing 18 per cent            environmental, universal design, wellbeing,
of greenhouse gas emissions that will work against               economic.

                                                   PowerHousing Australia: Australian Affordable Housing Report 2022    3
• Australian social housing stock is often old, less           • Residential lending peaked at a new high of $32.57
  inefficient and costly to run with impacts on                  billion in May 2021, an astounding 43.8% above the
  economic and social wellbeing for those that can               previous record March 2017 levels. The primary
  afford it least.                                               driver of that growth has been the explosion in
                                                                 owner occupier lending. First home buyers (FHB)
• Market acceptance of knockdown rebuild to better
                                                                 have also made a big impact on the market. At one
  utilise/densify inner/mid ring developable land.
                                                                 point FHB lending made up 26.8% of all new loan
• Race to purchase flat lots ahead of new accessible             commitments.
  design standard coming into the national
                                                               • Net overseas migration has suffered a stunning
  construction code.
                                                                 turnaround in COVID-19 times falling from a peak
• As is the case in market housing, Australia needs              of 241,338 in 2018-19 to a forecast low of -97,000
  to look to replace ageing social housing stock and             in 2020-21. Migration is only predicted to return to
  create additional social and affordable housing                pre-COVID levels in 2024-25.
  outcomes.
                                                               • Foreign investment approvals in residential real
• Renewal of outdated housing is an opportunity to               estate plummeted from 40,141 approvals in 2015-
  improve liveability, density, energy-efficiency and            16 to 7,056 approvals in the latest reporting period
  accessibility, and plan activity in the construction           of 2019-20, down from $72.4 billion in approvals to
  sector to keep the economic recovery going.                    $17.1 billion.
                                                               • 143,100 detached dwelling commencements are
Housing Affordability elements                                   forecast for the 2021 calendar year – a new record
• The unexpected boost to the housing market with                that is likely to remain unbroken for the decade
  a stimulus boosted residential build revival led               ahead, however HIA estimates the number of
  by Australian expatriates returns (750k) and low               detached housing commencements will fall from
  interest rate/serviceability.                                  135,290 in 2020/21 to 93,770 in 2023/24, a 30.7%
                                                                 decline.5
• The COVID-19 pandemic created a “race for
  space”4 with demand shifting from high density/              • Heat reducing macroprudential measures and
  units to low density/detached housing and from                 a future upward bias on interest rates creating
  urban to regional areas forcing up rents over 9                increasing uncertainty of how the market demand
  percent in the past year.                                      will be to continue to buy and invest at current
                                                                 rates.
• This phenomenon saw areas with a lower
  population density associated with rent increases,           • In the ten years from 2007-08 to 2017-18 the
  where previously such increases where most acute               national proportion of low-income households in
  in higher density dwelling areas.                              rental stress has increased from 35% to 43.1%

• Australia’s house price growth over the 12-months            • The proportion of mortgage holders in mortgage
  to Q2 2021 was 7th fastest in the world (source:               stress has increased from 32.9% in February 2020
  Knight Frank). The global average was an 8.2%                  to 41.7% in July 2021.6 This compares to 2013/14
  increase, the fastest rate of house prices growth              when mortgage stress was below 20%.
  since Q4 2006.                                               • 20% of key workers in Sydney and 17% of key
• Over the past twenty years the median value of a               workers in Melbourne experience housing stress
  capital city dwelling has risen by $524,291 or 258.1%.         with key workers being pushed to the city fringes to
  In the 12-months to June 2021 national dwelling                obtain affordable housing.
  values increased by 13.5%.
• Nationally, the proportion of houses sold under
  $400k reduced from 44.7% in 2011 to 23.7% in
  2021, while unit sales under $400k reduced from
  48.2% to 28.7%.

4      PowerHousing Australia: Australian Affordable Housing Report 2022
Everyone Homes – Density Outcomes on Standard Lot

Background to the 2021 Standard House Report
           The 2020 PowerHousing Australia CoreLogic Standard House Report highlighted the
           importance of the construction sector in stabilising the economy and driving a robust
           recovery. It illustrated the wide variety of positive economic effects that a standard
           house brings. Every new home that is built, such as the Metricon Barton (featured on
           the front cover of this report) or Simonds Homes Byfield (pictured on the previous
           2021 report left), provides employment for up to 43 trades and sub-trades across
           Australia’s cities, regional and rural areas.
           New dwelling construction was shown to deliver a significant secondary boost to
           manufacturing and retail. For instance, a new housing build requires 5,000 bricks.
           These bricks are made in local brickworks across the country, creating local jobs.
           Construction drives retail spending from the audio-visual equipment, flooring and
           furnishing that transform a new house into a home. Construction also drives the local
           economy as labourers patronise the small pizzeria or the corner store to keep them
           going through a hard day’s work.
           The last Standard House report and the role of housing construction was raised
           by Minister for Housing Michael Sukkar MP in Parliament in December 2020 while
           speaking about the Government’s HomeBuilder program. He highlighted the program
           as having stimulated new supply, averted an economic crisis and recording record
           new commencement activity in the FY2021 period.

                               PowerHousing Australia: Australian Affordable Housing Report 2022   5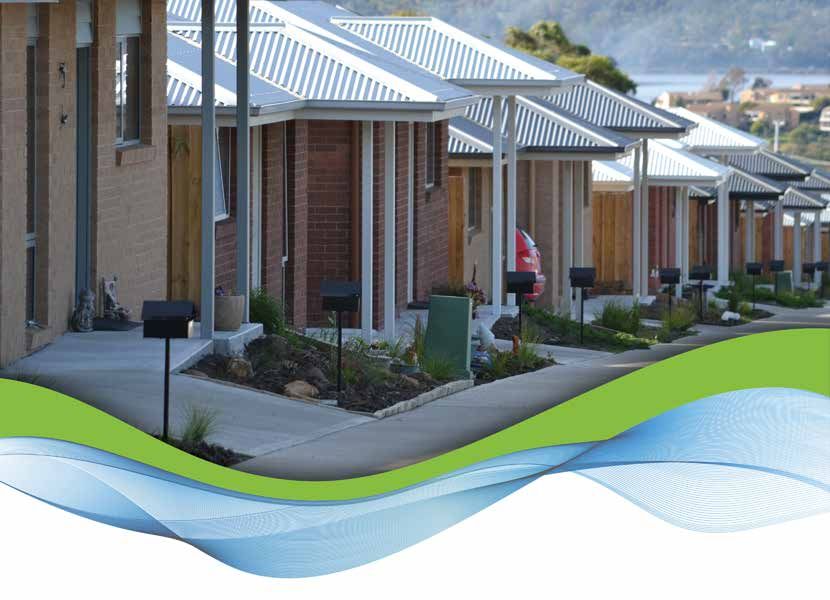
However, there are lingering concerns about the
                                                               future direction of the housing construction industry.
                                                               With international borders closed for so long, housing
                                                               affordability worsening and instability in materials
                                                               supply chains, there is a real danger that future
                                                               construction could stall.
                                                               There is a need to shore up the construction industry
                                                               pipeline once the current stimulus activity washes
                                                               through. New social and affordable housing builds
                                                               can do just that and new affordable housing, such as
                                                               Simonds Homes or Everyone Homes (a division of
                                                               Metricon), can fill the gap in the construction pipeline
                                                               and tackle the serious lack of affordable housing in
                                                               Australia.

                                                               Why do we need to reconsider our
                                                               housing fabric now?
                                                               Homes have changed little in the past 50 years which is
                                                               evident by the average suburban images shown here.
                                                               This street was built around 100 years ago and probably
                                                               looked similar again if you could go back another 50
Australian House and Garden 1962                               years. The reality is outside of several extra power points
                                                               in each room, some likely ‘low hanging fruit in energy
                                                               conservation’ with some extra insulation, solar hot water
Where are we today
                                                               and possibly better glazing, these homes are of a similar
Governments around Australia heard the message                 fabric to what they were when built.
and implemented stimulus measures to boost                     Look around the average street in Australia and there
housing construction. From the Federal Government’s            are almost 8 million 30-plus-year-old ‘Standard Old’
HomeBuilder grants to various state stimuli such as            house, or multi residential unit dwellings today.
Victoria’s Big Housing Build, each of these measures
                                                               It is estimated that residential energy use accounts
have helped boost Australian jobs.
                                                               for roughly 20% of Australian energy use and 18-20%
Bolstered by housing stimulus and low interest                 of greenhouse gas (GHG) emissions7,8. There is no
rates, the previous pessimistic prediction of 115,000          doubt housing will be a significant contributor to any
commencements for FY2021 has given way to                      net carbon zero strategy.
212,000 commencements, with a record June
2021 quarter just shy of 65,000 commencements.                 Australia’s Long Term Emissions Reduction Plan9
Unemployment has fallen to its lowest level in over a          taken to Glasgow climate summit says technology
decade.                                                        is the key to balancing these global emissions and
                                                               economic development objectives, but the ageing
Whilst this extra supply beyond expectations came              housing stock will cruel any targets until sustainable
as a surprise, there has also been an uptick in activity       technology takes over from coal, which is decades
from the previous year but alarmingly house prices             away.
have increased right across Australia.

6      PowerHousing Australia: Australian Affordable Housing Report 2022
Old housing stock has poor heating, water and energy
efficiency and there is only so much that can be
improved in old house designs. Unlike the designs
featured in the last standard house that are 6 to 7 star
energy rated with liveable features throughout and
technology at use, these older homes have none of this.
For those that have lived through the world’s longest
lockdowns, we are aware these homes are cold in
winter, hot in summer, expensive to cool and to heat.
They are not universally designed for lifelong living
for those with prams, injuries, for aging in place and
are certainly not suitable for those with disabilities.
On top of this, these homes today have become
workplaces, places of schooling and for those older
dwellings that were designed for a nuclear family these
homes are past their use by date. Whilst the memories,
families, triumphs and struggles should never be lost,
the need for better outcomes cannot wait.
As we analyse the options for net carbon zero by
2050 being considered at the 26th UN Climate
Change Conference of the Parties (COP26) in
Glasgow on 31 October – 12 November 2021, new
homes, as shown throughout the report, will have               Bowen Road Hobart 1965 and 2021
a significant role to play in reducing emissions.
                                                               In the case of increased density, a knockdown rebuild
The COP26 summit will bring parties together,
                                                               can bring three family housing outcomes from the
accelerating action towards the goals of the Paris
                                                               previous single-family house, of which at least one or
Agreement and the UN Framework Convention on
                                                               two can be an affordable and/or potentially a social
Climate Change. How almost 8 million old Australian
                                                               outcome.
homes will negatively impact the environment and
what can be done to reduce their impact must                   As we work our way through the next phase of
be front of mind. Further from the COVID lived                 COVID, it is important to consider the cold hard fact
experience, the wellbeing of those that live in these          that if we did not have a home, a place to work,
homes is now a major factor. Government policy                 school, play and rest, we would have more than
can open these homes up for improved outcomes                  a health crisis, with economic ramifications that
relating to the environmental sustainability, liveability,     forecasters in hindsight hadn’t quite factored in.
wellbeing, transit efficiency and employment.
                                                               Housing is the place of security that has been
Redeveloping old housing stock can also better use
                                                               confirmed by this crisis. It’s a central place in the lives
the existing land and infrastructure, whilst revitalising
                                                               of Australian that is now front of mind. It must be a
neighbourhoods and communities.
                                                               central focus as social infrastructure in the rebuild of
The Australian housing market has increasingly                 a nation in this next phase.
moved to a knockdown rebuild approach to
                                                               As the current stimulus-boosted phase washes
developing housing close to commuter routes on flat
                                                               through and the factors of demand begin to
land and with large block sizes that allow density, and
                                                               normalise, a focus on new liveable, energy efficient
this is a critical future policy consideration. A focus
                                                               social and affordable housing can underpin the build
on creating new purpose-built housing to create jobs
                                                               rate over the coming period.
and a focus on affordable housing outcomes are the
feature of this update.

                                                   PowerHousing Australia: Australian Affordable Housing Report 2022     7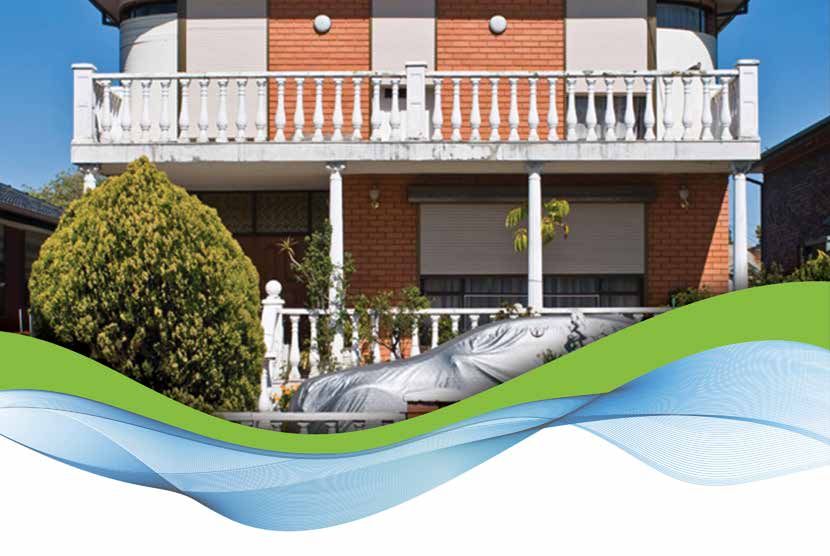
Infill Redevelopment – Westside Housing (SA)

A              Section A –
               COVID Housing Boom

A1. GLOBAL HOUSING TRENDS

Global Economic Recovery
The COVID-19 pandemic struck the world with devasting effects on people’s lives and livelihoods. The
immediate health impacts coupled with lockdowns, supply-chain disruptions, travel restrictions and economic
uncertainty caused a historically significant and synchronised recession. Although the economic impact of
the pandemic has been less severe than initially predicted, global GDP remains well below pre-pandemic
expectations.

8     PowerHousing Australia: Australian Affordable Housing Report 2022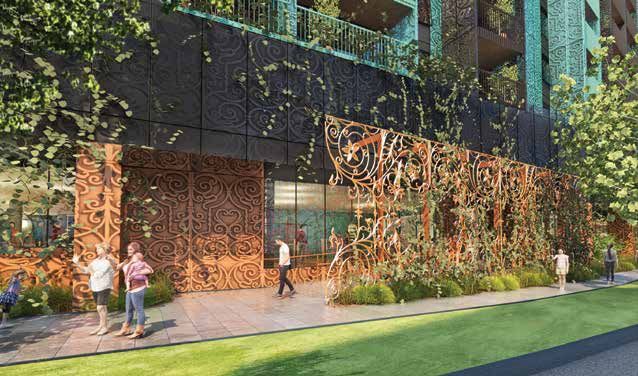
Central banks and fiscal authorities launched                       and entry into a post-COVID global recovery. The
extraordinary and simultaneous measures to                          emergence of COVID variants continues to weigh on
stabilise the banking system, to assist those left                  those prospects.
out of work and to support businesses in the most
                                                                    Each nation has managed the crisis with their own
affected industries. These interventions helped
                                                                    circumstances, but there are important emergent
prevent the dire economic consequences that were
                                                                    trends. One particular phenomenon has been the run
predicted at the start of the pandemic from coming
                                                                    up in house prices and the deterioration of housing
to fruition. Effective COVID-19 vaccines have been
                                                                    affordability, driven by accommodative monetary
developed in record time; their distribution has
                                                                    policy, fiscal stimulus and the “race for space”.
initiated the process of containing the virus’ spread

Table 1: Knight Frank Global Housing Price Index Ranked by Growth to Q2 2021

                           12-Months                              6-Months                            3-Months
     #1                       Turkey                                Turkey                              Jersey

     #2                   New Zealand                               Jersey                              Turkey

     #3                The United States                     The United States                         Canada

     #4                      Slovakia                              Slovakia                       The United States

     #5                      Sweden                               Australia                            Estonia

     #6                   Luxembourg                               Canada                              Slovakia

     #7                     Australia                              Norway                              Sweden

     #8                      Canada                                Estonia                             Hungary

     #9                   Netherlands                            Netherlands                           Iceland

    #10                       Russia                            New Zealand                            Australia

Source: Knight Frank Global House Price Index Q2 2021

International House Pricing
Given the enormous negative shock created by                        Australia’s growth over the 12-months to Q2 2021
the COVID-19 it seems somewhat paradoxical that                     was 7th fastest in the world, only behind Turkey, New
a consistent trend has been the run up of house                     Zealand, the US, Slovakia, Sweden and Luxembourg.
prices in the developed world. According to the                     Australian house prices also grew the 6th fastest over
Knight Frank House Price Index, the global average                  the 6-months to Q2 2021 and 10th fastest over the
house price has risen 8.2% to Q2 2021. This is the                  3-months to Q2 2021. This growth is also in-line with
fasted rate of house prices growth since Q4 2006,                   other anglophone countries (highlighted in the graph),
during the height of the housing bubble in the United               although New Zealand stands out with a massive
States. Of the 55 countries in the index, 18 countries              25.9% increase in house prices over the 12-month
recorded double-digit percentage growth rates over                  period.
the year to Q2 2021.

                                                        PowerHousing Australia: Australian Affordable Housing Report 2022   9
A2. DOMESTIC TRENDS
Before the COVID-19 pandemic, housing affordability                government area–and by 10% or more in 31.9% of
in Australia had deteriorated significantly in the lead            SA3s. Over the same period, median dwelling values
up to the housing boom between 2014-2018. By 2019,                 increase by 5% or more in 92.1% of SA3s and by 10%
the medium-term outlook signalled a forthcoming                    or more in 72.4% of SA3s.
downturn as investment and construction volumes
                                                                   Pre-COVID Australia had 200,000 Australians on
declined. Faced with the economic blow from
                                                                   housing waiting lists and the affordability gap has only
COVID-19, it appeared that the housing industry would
                                                                   increased as a result of the latest pricing increases.
endure an amplified downcycle. Many of the largest
financial institutions in the country also predicted a             The rise in home values also significantly outstripped
precipitous decline in house prices.10                             the rate of inflation (2.36%) and wage growth (3.17%)
                                                                   over the past two decades. With house prices sent
With strong fiscal support, mortgage repayment
                                                                   rocketing skywards, social and affordable housing
holidays and accommodative monetary policy, house
                                                                   shortfalls have only grown.
prices and housing construction roared back to life
and became a strong economic engine for Australia’s                Uncertainties linger about the future of Australian
COVID-19 recovery. This coincides with broader                     housing. Fiscal supports for the construction industry
movements around the developed world, including a                  have come to an end. Accommodative monetary
desire to escape the danger of COVID in urban centres              policy will eventually be wound back and with
and move to the relative safety of suburban and rural              macroprudential buffers coming into effect.
areas.                                                             It has been reported that finance will become harder to
In FY2021 new supply has bounced back to sit 30,000                secure over the next 12 months, with property industry
completions above 25 year averages.                                players expecting slightly higher interest rates, but
                                                                   also anticipating macroprudential controls to curb
Over the year ending 30 June 2021, median rents
                                                                   home loan availability, the latest barometer of property
have increase by 5% or more in 73.6% of Statistical
                                                                   industry sentiment shows.11
Area Level 3s (SA3s)–roughly equivalent to your local

Graph 1: Debt finance availability expectation (index)

                                                                                                                     20

                                                                                                                     10

                                                                                                                     0

                                                                                                                     -10

                                                                                                                     -20

                                                                                                                     -30

     2014          2015         2016          2017          2018             2019       2020         2021

     n ACT      n NSW      n VIC     n QLD     n WA       n SA

     Source: ANZ, PCA

10       PowerHousing Australia: Australian Affordable Housing Report 2022
“Debt finance availability expectations dropped to Additional housing demand levers of first home buyers
their lowest in a year in the ANZ/Property Council and domestic owner occupiers have also largely
Survey for the September quarter, which was played out through this recent stimulus.
surprising given the likely continuation of generally
With a significant amount of new dwellings coming into
low borrowing costs.”
the pipeline, there is likely more momentum left in the
ANZ senior economist Felicity Emmett, 29.9.2021 property market to potentially put a lid on prices and
keep construction activity elevated through to the end
The next step from the previous EScan is to examine of the 2021. The longer-term prospects for housing
where the wages growth will come from and how demand are more questionable. The uncertainty is: if
a population-based slow-down will impact housing there is not a significant population growth story, who
activity and the delivery of badly needed stock in 2022. are these new homes being built for?
The effects of expatriates returning to Australia Whilst demand has washed through the owner
during the COVID-19 pandemic will pass. The closure occupiers and first home buyers, the demand for
of international borders has slowed population affordability has only built up over the past two years
growth to its lowest rates since WWI12 with border and there could be a wave of investment if directly
re-openings touted for late 2021 and early 2021. All of focused on long term affordable housing delivery.
these indicate strong headwinds for the construction There is a need to think beyond recent stimulus to
industry that has yet to build the affordable housing focus on a dedicated affordable supply with a lens
supply that Australia needs. to balance a situation that we have never faced as
a country. Structured government backed equity
investment could create 10-30,000 dedicated
What is next affordable homes if government backed with 4-7
percent returns to sure up the housing delivery pipeline
When considering the ABS Overseas Travel Statistics
as we get to an uncertain 2022-23 year ahead.
we can see a mammoth net 750,000 Australians enter
the country since January 2020. Considering the long
run trends there are around 435,000 Australians in
Interest Rates
the country that we wouldn’t reasonably expect to be
here without the COVID pandemic. These Australian In response to the global recession created by
expatriates coming home have created a surge in the COVID-19 pandemic, monetary authorities
demand for housing with strong purchasing power. lowered short term interest rates, established
Since April 2020, this net flow of expats has all but quantitative easing provisions and announced various
stopped. extraordinary funding facilities to lower borrowing
Meanwhile since January 2020, net 390,000 other visa costs for households, businesses and governments.
classes have left Australia. Considering the pre-COVID Whilst these measures played a key role in bridging the
migration trends there were around 700,000 visa gaps created by the negative economic shock, they
classes that would have entered the country had COVID also played an important role in raising home prices.
not occurred. With the borders not set to reopen until As interest rates were cut, households with existing
late-2021 and only opening slowly, this migration gap mortgages were relieved of some of the financial
will continue to widen. Whilst expat demand is fuelling stress of the COVID pandemic. However, home buyers
current activity, this activity will drop away without were now faced with the opportunity to acquire large
the visa class demand driving ongoing growth to see mortgages with extraordinarily low interest rates and
housing activity continue at buoyant levels. thus repayment costs. This allowed home buyers, who
are competing to acquire limited housing stock, to bid
up house prices around the developed world.
PowerHousing Australia: Australian Affordable Housing Report 2022 11Graph 2: RBA Cash Rate and Home Loan Rates
8
7
6
Interest Rate (%)
5
4
3
2
1
0
Oct 2011
Feb 2012
June 2012
Oct 2012
Feb 2013
June 2013
Oct 2013
Feb 2014
June 2014
Oct 2014
Feb 2015
June 2015
Oct 2015
Oct 2018
Feb 2016
June 2016
Oct 2016
Feb 2017
June 2017
Oct 2017
Feb 2018
June 2018
Feb 2019
June 2019
Oct 2019
Feb 2020
June 2020
Oct 2020
Feb 2021
June 2021
Oct 2021
Cash Rate Target Standard Variable 3-year Fixed Discounted Variable
Source: RBA Indicator Lending Rates – F5
In Australia, home loan rates have been declining 1. The shift in demand for housing from high
along with the consistent loosening of monetary density/units to low density/detached housing.
policy. Over the past decade a standard variable
2. The shift in demand for housing from urban
home loan has fallen 3.27% points from 7.79%
areas to regional areas.
to 4.52%. The 3-year fixed home loan rate has
fallen even more dramatically from 6.71% to Correlation between FY2021 FY2017
2.19% (a 4.52% decline). This reflects the Reserve SA3 population density
Bank’s commitment to maintain a 0.1% target on and…
Australian Government Bonds until April 2024. With
Δ% SA3 Dwelling Rents -0.48 0.20
home loans rates at these unprecedently low levels,
it is understandable that there has been a surge in Δ% SA3 House Rents -0.35 0.24
housing demand as home buyers rush to lock-in Δ% SA3 Unit Rents -0.53 0.14
low rates while they can.
Source: CoreLogic, July 2021 & ABS Census 2016
The “Race for Space” and Work The specific impacts of COVID-19 help explain
from Home this phenomenon. COVID-19 transmits faster
through areas that are characterised by crowds,
Another key trend in the COVID-19 period is what close contacts and confined spaces.14 To prevent
has been termed the “race for space”.13 The term the spread of the virus, governments introduced
refers to two key trends in housing markets of the lockdowns, stay-at-home orders and social
developed world. distancing measures.
12 PowerHousing Australia: Australian Affordable Housing Report 2022The virus, and the measures used to contain it, for this phenomenon can be found in the UK where
disproportionally impacted city-dwellers. The the Resolution Foundation found that the areas with
difference between life under lockdown in an the lowest population density experienced the largest
apartment complex of a major city versus a large growth in house prices whilst the areas with the
single-family dwelling in the regions/urban fringes is highest population density experienced the least.15
stark. Ample yard space, large kitchens, exercising
The same phenomenon can be seen in Australia
areas, dedicated video-conferencing rooms, etc. all
when we analyse local area data (SA3s). In FY2017,
suddenly gained an insistent desirability when people
growth in rents was positively correlated with high
were forced to stay home to contain the virus’ spread.
population density. This corresponds to the boom in
This has been coupled with the growth of remote the major cities in the mid-2010s, so it is unsurprising
work and home schooling, first as a response that rent increases correlate with higher population
to the social distancing required to fight COVID density. By FY2021, due to the effects of the COVID
and then as a viable option for those seeking the pandemic, this trend has strongly reversed. There is
flexibility working/schooling from home provided. now a negative correlation between the change in
Unconstrained by the need to locate in urban rents and population density. This means that areas
centres for employment, workers, particularly urban with a lower population density were associated with
professionals, moved out to regional areas. Evidence rent increases.
A3. AUSTRALIA’S HOUSING BOOM
Australia’s Economic Situation the ACT have re-entered a prolonged lockdown and
there have been sporadic lockdowns/restrictions in
Despite the devasting impact COVID inflicted on the other jurisdictions. It is too early to know what the full
economy, Australia has been able to weather the impacts of the latest outbreaks will be and how this
economic downturn better than most countries. At will impact the reopening. The initial signs are not
the depths of the COVID recession, GDP contracted good with the number of employed people in NSW
0.3% in the March quarter and 7% in the June quarter. falling by approximately 98,000 in August.16
When compared to the UK whose GDP contracted
19.5% in the June quarter, Australia’s economy has
been let off lightly. Even with JobKeeper, the RBA in Construction Volumes
May 2020 was predicting that unemployment would
peak at 10%. Before COVID-19, the housing construction industry
was facing significant headwinds coming off the
Fortunately, the worst did not materialise.
mid-2010s boom period as housing investment
Unemployment peaked at 7.4% and has been falling
declined and macro-prudential intervention
ever since, even as JobKeeper has been withdrawn.
constrained housing credit growth. COVID-19 and the
Fuelled by strong export demand and an early
subsequent economic damage was expected to drive
containment of COVID, the Australian economy has
construction volumes even lower. Last year the HIA
been growing since the second half of 2020. Australia
predicted housing commencements to fall to 112,000
remains one of the few countries that has a larger
in 2020-21, which would be the lowest level since
GDP than it did before the COVID pandemic.
2000-01.17
The re-emergence of COVID in Australia has, however,
caused further economic disruption. NSW, VIC and
PowerHousing Australia: Australian Affordable Housing Report 2022 13Graph 3: ABS Building Approvals 2001-2021 (Seasonally adjusted)
300,000
250,000
Monthly Building Approvals
200,000
150,000
100,000
50,000
0
Aug 01
Aug 02
Aug 03
Aug 04
Aug 05
Aug 06
Aug 07
Aug 08
Aug 09
Aug 10
Aug 11
Aug 12
Aug 13
Aug 14
Aug 15
Aug 16
Aug 17
Aug 18
Aug 19
Aug 20
Aug 21
Source: ABS 8731.0
Federal and state governments announced various combined with low interest rates and the COVID-19
stimulus measures to prevent a “valley of death” “race for space” effect to help drive a strong rebound
scenario for the housing construction industry. in housing demand. Building approvals have shot up
These included the Federal Home Builder scheme, since June 2020 and by March 2021 they exceeded
additional construction grants in WA and SA, instant the previous November 2017 peak. Although
asset write offs for small businesses including approvals have cooled off slightly, they remain
construction firms and other measures. This has significantly elevated from 2019 levels.
Graph 4: ABS Building Approvals by Dwelling Type and Public Private Sector (Seasonally adjusted)
180,000
160,000
140,000
Monthly Building Approvals
120,000
100,000
80,000
60,000
40,000
20,000
0
Aug 01
Aug 02
Aug 03
Aug 04
Aug 05
Aug 06
Aug 07
Aug 08
Aug 09
Aug 10
Aug 11
Aug 12
Aug 13
Aug 14
Aug 15
Aug 16
Aug 17
Aug 18
Aug 19
Aug 20
Aug 21
Private sector houses Private sector dwellings excluding houses Public sector dwellings
Source: ABS 8731.0
14 PowerHousing Australia: Australian Affordable Housing Report 2022Consistent with the “race for space”, there has been “A stable dollar, recovering global supply chains
a significant divergence between dwelling approvals and a downturn in domestic buildings will
for houses and other dwellings excluding houses combine to pull construction inflation down from
(i.e. units). From June 2020, housing approvals a spike of up to 8 per cent to just a quarter of
have skyrocketed and by April 2021 they had almost that level next year.”18
doubled. There has been some modest growth
in units, but it is far from the figures seen in the
Monetary Policy and Housing
apartment construction boom 2014-18.
Lending
This extraordinary turnaround is not without
its perils. This shift in housing construction, Alongside the boom in housing construction there has
domestically and globally, has put significant been a surge in bank lending for home purchases or
pressure on the supply chains for materials. This construction. Initially, lending took a sharp downturn
has raised the costs of materials significantly, that corresponds to the onset of the COVID-19
causing project delays and cost blowouts pandemic. Starting in August 2020, when the economy
throughout the construction industry. The current commenced re-opening from the strict lockdowns,
indications are that it will take some time for these new loans commitments took off. Prompted by low
materials shortages to clear through. interest rates and the “race for space”, home buyers
rushed into the market (see graph).
Graph 5: ABS New Loan Commitments, Total Housing (Seasonally adjusted)
35
30
25
Billions ($)
20
15
10
5
0
May 08
Aug 06
Mar 07
Oct 07
Dec 08
Jul 09
Feb 10
Sep 10
Apr 11
Nov 11
Jun 12
Jan 13
May 15
Feb 17
Jan 20
Aug 13
Mar 14
Oct 14
Dec 15
Jul 16
Sep 17
Apr 18
Nov 18
Jun 19
Aug 20
Mar 21
Aug 21
Total (ex. refinancing) ($b) Owner occupier (ex. refinancing) ($b) Source: ABS Lending Indicators 5601.0, Table 1.
Investor (ex. refinancing) ($b) First Home Buyers
PowerHousing Australia: Australian Affordable Housing Report 2022 15During the previous housing boom monthly lending It should be noted that FHB lending has been declining
peaked at $22.65 billion lent in March 2017. With the whilst overall lending has continued to climb. If you
most current data, lending has peaked at $32.57 billion exclude FHBs, owner-occupier lending has continued
in May 2021, which is an astounding 43.8% above the to grow and is more than double its level in May
March 2017 levels. The primary driver of that growth 2020. Investor lending has also risen precipitously.
has been the explosion in owner occupier lending. This is concerning as investor speculation can create
First home buyers have also made a big impact on systemic risks to the housing market. Regulators may
the market. Prompted by the First-Home Loan Deposit intervene, as they did during previous peaks in investor
Scheme (FHLDS), HomeBuilder and various other activity, to bring investor lending under control. Future
measures, first-home buyer lending exploded at nearly regulatory intervention is the reason behind Westpac’s
doubled its pre-COVID levels. At one point FHB lending prediction of a house price correction in FY2023.19
made up 26.8% of all new loan commitments.
Graph 6: New Loan Commitments by Purpose 2011-2021 (Seasonally adjusted)
18
16
14
12
Billions ($)
10
8
6
4
2
0
Feb 19
Jul 19
Dec 19
May 20
Jan 12
Feb 14
Jul 14
Dec 14
May 15
Oct 15
Jan 17
Apr 18
Sep 18
Oct 20
Mar 21
Aug 21
Aug 11
Jun 12
Nov 12
Apr 13
Sep 13
Mar 16
Aug 16
Jun 17
Nov 17
Construction of dwellings ($b) Purchase of existing dwellings ($b) Purchase of residential land (a) ($b)
Source: ABS Lending Indicators 5601.0
16 PowerHousing Australia: Australian Affordable Housing Report 2022Consistent with the effects of housing stimulus, the The record has been bolstered by Victoria being the
lending indicators also show an increase in lending lead state despite the tough lockdowns. Nationally the
for new dwelling construction and land purchases. result was bolstered by low interest rates and 700,000
By far the largest increase in lending can be seen in cohort of expats returning to Australia against an
the purchase of existing dwellings. This is consistent almost equal number of foreign departures.
with the massive increases in house prices during the
Despite this result, the question to consider is for how
COVID pandemic.
long will this surge last and when will it have an impact
on house prices in the long term.
Housing Activity Across the capitals and against the world’s longest
lockdowns, the Victorian commencements sees them
out build every other state in FY2021 to contribute to
Redfern Development – SGCH (NSW)
this record activity.
We see that in New South Wales, and particularly in
Sydney, activity is picking up momentum in the last
quarter with 19,860 commencements compared to
their activity earlier in the year.
At 13,799 new starts, South Australia also saw
some green shoots recording its highest ever year of
residential commencements.
There are questions that remain about how long
these record commencements will last amid low and
declining population growth and when house price
growth will come back to more stable quarterly rises.
Like praying for rain in a drought, we can only hope
that house prices will come back to a stable growth
trajectory, bringing some affordability back to the
housing landscape.
This result also shows that housing policy such as
HomeBuilder actually creates supply activity and
‘turning the policy sod’ for sustained affordable supply
over a longer term period is critical to locking in any
gains that should come through and to stabilising a
ABS Building Activity released in October 2021 show future drop in activity.
a record June quarter in housing commencements,
stimulated by HomeBuilder and low interest rates. The post-COVID-19 reality is yet to show impacts on
This resulted in a massive 212,000 housing starts housing affordability, even at this heightened level of
nationally, which is around 100,000 homes above supply. There is a need to think beyond recent stimulus
previous FY2021 forecasts made at the beginning of to focus on a dedicated affordable supply with a lens
COVID. to balancing a situation that we have never before
faced as a country.
The 4th quarter June 2021 result of 65,000
commencements alone is the highest quarter of
building activity since ABS started the records in 1984.
PowerHousing Australia: Australian Affordable Housing Report 2022 17Graph 7: Dwelling Unit Commencements (Seasonally adjusted)
70,000
60,000
Quarterly Number Dwellings
50,000
40,000
30,000
20,000
10,000
0
Sep 2017
Feb 2018
Jul 2018
Dec 2018
May 2019
Oct 2019
Jan 2021
Jun 2011
Nov 2011
Sep 2012
Feb 2013
Jul 2013
Dec 2013
May 2014
Oct 2014
Mar 2020
Aug 2020
Jun 2021
Apr 2012
Mar 2015
Aug 2015
Jan 2016
Jun 2016
Nov 2016
Apr 2017
Houses Total Other Residential Total Source: ABS Building Activity 8752.0, Table 33.
Graph 8: Annualised Dwelling Commencements, by State/Territory
80,000
70,000
Annual Dwelling Commencements (s.a)
60,000
50,000
40,000
30,000
20,000
10,000
0
FY2011 FY2012 FY2013 FY2014 FY2015 FY2016 FY2017 FY2018 FY2019 FY2020 FY2021
NSW VIC QLD SA WA TAS NT ACT
Source: ABS Building Activity 8752.0, Table 35.
18 PowerHousing Australia: Australian Affordable Housing Report 2022A4. FORECASTING THE FUTURE
Stimulus and Declining Affordability Overseas Migration & Population
The stimulus measures and the significant easing Year Net Overseas Migration
of monetary policy have both contributed to the
housing boom. But applications for Homebuilder 2017-18 238,224
closed on 17 April and as that pipeline of work is 2018-19 241,338
completed there will be a concomitant decline in
2019-20 194,426
construction demand.
2020-21* -97,000
Mortgage rates currently remain at extraordinarily
low levels, and they will likely remain low as 2021-22* -77,000
monetary policy continues to ameliorate the
2024-25* 235,000
economic disruptions caused by COVID.20 Declining
interest rates have fuelled the enormous growth in Source: ABS 3105.0 & *Budget FY2022
house prices over the past decade. If the decline in
A key driver of the mid-2010s housing construction
interest rates is arrested, it will become difficult for
boom was the high levels of net overseas migration
house prices to continue their staggering growth.
over that period. One startling impact of COVID-19
Aside from falling interest rates, other avenues to has been the near total shutdown of the Australian
improve affordability such as strong wage growth borders to international travel. Australia expats
remain elusive. Deteriorating affordability itself, have been filtering their way back to Australia whilst
aside from changes in mortgage rates, will also likely migrants residing in Australia have been returning
weigh on house price growth and act to rein in the to their countries of origin. In aggregate, this has led
market. to a stunning reversal of the migration trends of the
“The unparalleled growth in home prices over past 25 years.
the past year is expected to slow further, with The most recent estimates from Budget 2022
the pool of buyers not deep enough to absorb predict that net overseas migration will fall from
the amount of stock sellers are likely to unleash 194,426 in 2019-20 to -97,000 in 2020-21. This trend
once the lockdowns end. Buyers are already is predicted to continue with -77,000 net migration
being left behind by the rapid escalation in in 2021-22. Migration is only predicted to return to
prices, according to CoreLogic.” 21 pre-COVID levels in 2024-25. In the longer term this
“All of this occurs in the context of a national has the potential to impact the housing construction
workforce that is increasingly split into high sector as once the demand from returning expats,
earners with a shrinking middle-class. There stimulus demand and “race for space” buyers clear
will be no “median homes” that are an option for through, there will a hole in demand where migration
most Australians. There will instead be a housing used to be.
market for high-income earners where margins
are relatively high and a separate housing market
for low-income earners where margins are
scarily low. Markets will probably fail the low-
income earners, which suggests that the need
for social housing will continue to grow until
the government is forced to act as a developer
of housing for the least financially lucrative
segments in the housing market.” 22
PowerHousing Australia: Australian Affordable Housing Report 2022 19Graph 9: Cumulative Net Visa Arrivals Since September 2016
1,400,000
1,200,000
1,000,000
Net Visa Arivals
800,000
600,000
400,000
200,000
0
Jun 2020
Sep 2020
Dec 2020
Mar 2021
Jun 2021
Mar 2019
Jun 2019
Sep 2019
Dec 2019
Mar 2020
Sep 2016
Dec 2016
Mar 2017
Jun 2017
Sep 2017
Dec 2017
Mar 2018
Jun 2018
Sep 2018
Dec 2018
Cumulative Visa Arrivals Visa Entry Modelling
Source: ABS 3401.0 Overseas Travel Statistics, Table 15.
The migration gap can be illustrated by plotting NSW Treasury, in the FY2022 budget papers, also
cumulative visa arrivals against the pre-COVID flagged oversupply as a risk.25
trend (see graph). According to this model, there
“The company’s quarterly Australia Residential
were ~750,000 fewer people, as of Aug 2021, in
Real Estate Report analysed the real estate
the country than would be expected if COVID never
markets that were suffering most from the
happened. This gap will only widen the longer
international student drought, finding Victoria
international borders, and migration, remain closed.
is the biggest loser when it comes to lost
Recent HIA commentary highlights the lack of international student university revenue and
overseas migration as contributing significantly property market impact followed by NSW and
to a future decline in home commencements. Queensland. Australia wanted to be part of global
HIA estimates put the number of detached markets and it was crucial to start opening back
housing commencements falling from 135,290 in up, including a return to net migrations levels of
2020/21 to 93,770 in 2023/24, a 30.7% decline.23 about 200,000 people per annum.” 26
HSBC Global Research also highlighted declining
migration as a reason that house price growth will Tony Lombardo, CEO Lendlease, 23, Sept 2021
moderate in 2022.24 HSBC flags a growing surplus
But the prospects of Net Overseas Migration from
of housing stock, particularly in NSW and VIC, as
the Other Visa Classes will still be some time away
new housing builds outpace the growth in demand
after lockdown and freedom of movement starts to
without population growth from migration. The
occur.
20 PowerHousing Australia: Australian Affordable Housing Report 2022“As travel reboots, airlines will need time to restart period of 2019-20, down from $72.4 billion in
their services this will likely push the large-scale approvals to $17.1 billion over the same period.
return of foreign students to Q2 2022, just in time
This represents a reduction of $55.3 billion in the
for the second academic term of the year. Our
value of Foreign Investment Review Board approvals.
best estimate is that Australia will get back to 75
Although it must be noted that not all investment
per cent of 2019’s resident international student
approvals translate into actual purchases of dwellings,
population in 2022, but that getting back to 100
these figures suggest a huge decline in demand in
per cent will take until 2024 or 2025.” 27
residential real estate from foreign buyers.
Georg Chmiel, Juwai IQI Group Executive Most of the approvals granted during the 2015-
Chairman, 23 Sept 2021 16 boom and subsequent years have been in the
areas of Victoria and New South Wales with strong
population growth. These growth areas, particularly
Foreign Investment high-density apartment districts in capital cities,
have been hit hard by COVID and are no longer
In the mid-2010s, foreign investment helped see producing strong investment returns.
the levels of new stock development soar through China used to be the largest investor in Australian
the roof. It was built on a undersupply across residential real estate, particularly during the peak
Australia, particularly in states such as NSW that year of 2015-16. China has since fallen to third
was recording 5-30 per cent annualised gains for largest residential real estate investor, behind
15 years, which were a beacon for international the United States and Singapore, as Chinese
investors. investment has waned. There is still a considerable
Whilst predominantly multi-residential unit, amount of residential real estate held by Chinese
foreigners purchased for investment, student investors. Faced with souring political relations,
housing and sold off in some cases. This activity tightening rules about lending to foreign investors, a
certainly underpinned the feasibility of that unit weakening apartment market, and a crackdown on
tower to come out of the ground. capital outflows by the Chinese government, there
are questions around the willingness of Chinese
Foreign investment approvals in residential real
investors to resume purchasing Australian assets.
estate have plummeted from 40,141 approvals in
2015-16 to 7,056 approvals in the latest reporting
Table 2: Residential Real Estate Approvals
2013-14 2014-15 2015-16 2016-17 2017-18 2018-19 2019-20
No. $bn No. $bn No. $bn No. $bn No. $bn No. $bn No. $bn
Developed 7,920 7.5 9,247 11.5 5,877 7.3 2,008 3 1,615 2.4 1,313 1.8 1,105 4.6
For Development 18,284 29 27,594 49.2 34,264 65.2 11,190 27.1 8,421 10.2 6,074 12.9 5,660 12.2
Total 26,204 36.5 36,841 60.7 40,141 72.4 13,198 30.1 10,036 12.5 7,513 14.8 7,056 17.1
Source: Foreign Investment Review Board – Foreign Investment Approvals, June 2021
PowerHousing Australia: Australian Affordable Housing Report 2022 21It is not looking like there will be significant growth Future demand and supply
to underpin the next phase of developments. expectations
“Most of the buildings that Chinese groups
snapped up in the boom remain in their hands Forecasting new housing starts has been noted
but the developers’ dreams of becoming a new in previous editions as being a challenging task
force in Australia have been all but shattered. and whilst additional forecasts change based on
They faced a toxic mix of bad political relations, the latest components of supply and demand,
a tough industry, the apartment crash and China’s the following report shows an expected decline in
crack-down on capital going offshore for luxury activity with a slow build thereafter.
projects. They also paid too much for apartment
sites, particularly around inner Sydney. Some
major Chinese players quietly received a call to
go home.” 28
From the Australian, Chinese developers beat a
hasty retreat (12/8/21)
Graph 10: Comparison of Master Builders Australia forecasts for total new dwelling starts to 2024-25
220,000
200,000
180,000
160,000
140,000
120,000
100,000
2019-20 2020-21 2021-22 2022-23 2023-24 2024-25
n Pre-Covid forecast set (Feb 2020) n April 2020 forecast set n Latest forecast set (Apr 2021)
Source: Master Builders Australia, May 2021
Additional updates across future periods are likely considered with a likely draw forward of demand,
to see increases to the FY2022 year forecasts but to potentially see lower numbers in FY2023 and
how the housing activity fares thereafter is to be FY2024.
22 PowerHousing Australia: Australian Affordable Housing Report 2022Graph 11: Dwelling Commencements / HIA Forecasts - Australia
250,000
230,864
230,000
210,896
MAT of No. of commencements
210,000
186,972
190,000 176,920 176,166 178,899 -14%
172.337 -23%
170,000 159,825 -19% 163,092
-33% 172,876
150,000 -31% -35% 162,012
-1%
-18%
145,259
130,000
131,290
110,000 122,497 120,967
114,681
90,000
Mar 1999
Mar1991
Mar1993
Mar 1995
Mar 1997
Mar 1999
Mar 2001
Mar 2003
Mar 2005
Mar 2007
Mar 2009
Mar 2011
Mar 2013
Mar 2015
Mar 2017
Mar 2019
Mar 2021
Mar 2023
Mar 2025
Source: ABS 8572, HIA
Despite the strong outlook for the next twelve over the previous financial year. This is a record
months, without a return of demand for new for the number of starts in a 12-month period. We
housing from overseas migration, there will be a anticipate that it will be a short-lived record with
decline in new home commencements over the detached starts in the 2021 calendar year to exceed
next few years. For these forecasts, we assume 143,100.
that migration starts returning from mid-2022 and
This record is unlikely to be broken within the
results in a growth rate of 1.5 per cent by 2024/25.
next decade. It is expected there will be 125,030
Even with this expected return of population growth,
detached starts in 2021/22, a decline of 7.7 per
the current volume of new home commencements
cent from 2020/21. From mid-2022, however,
will not be sustained.
adverse impacts will emerge from two years of
A decline in commencements of new detached lost population growth, higher building costs and a
homes should be anticipated from mid-2022 shadow of demand created by HomeBuilder. This
when homes initiated by HomeBuilder are nearing will impair the detached sector with the number
completion. It is anticipated that there will have of starts falling back below the average of the
been 135,390 detached dwellings starts nationally past decade. This will be compounded by a rise in
in 2020/21, representing a growth of 32.5 per cent interest rates from mid-2023.29
PowerHousing Australia: Australian Affordable Housing Report 2022 23Beyond Housing (VIC)
As noted by one of the nations largest builders • Incentivise development pipelines to provide a
Simonds Homes, land supply is the one component quantum of below market priced lots, salt and
we can target that can drive this price trajectory peppered throughout their developments, that
downward. To improve the bias to increase more have a memorandum on title to be retained as
home delivery from estimates made there is a need such. Incentives by way of increased dwelling
to remove the barriers to land supply and housing capacity per hectare dependent on affordable
affordability by: stock made available and or comfort around the
asset and tenancy management measures are
• Releasing dormant public land
some considerations.
• Unlock serviced idle land and redevelop old
Highlighting the effects of reduced land supply, land
social housing stock
prices have increase by 8.5% over the year to June
• Expedite planning approval by way of fast 2021, which is more than twice the rise in the cost
tracking ‘social and affordable housing’ of home building materials (4%).30
• Improve urban land use rules to increase housing
footprint allowances (e.g. 70/30 or 80/20 for
medium density and dual key residences on one
parcel)
24 PowerHousing Australia: Australian Affordable Housing Report 2022You can also read