A framework to evaluate the impact of infectious disease outbreak response measures on delivery of routine health services
←
→
Page content transcription
If your browser does not render page correctly, please read the page content below

A framework to evaluate the impact of infectious
   disease outbreak response measures on delivery of
   routine health services

         Dr Hwee-Lin WEE
         Joint Assistant Professor
         Saw Swee Hock School of Public Health &
         Department of Pharmacy, Faculty of Science,
         National University of Singapore

©©Copyright
   CopyrightNational
             NationalUniversity
                      UniversityofofSingapore.
                                     Singapore.All
                                                AllRights
                                                    RightsReserved.
                                                           Reserved.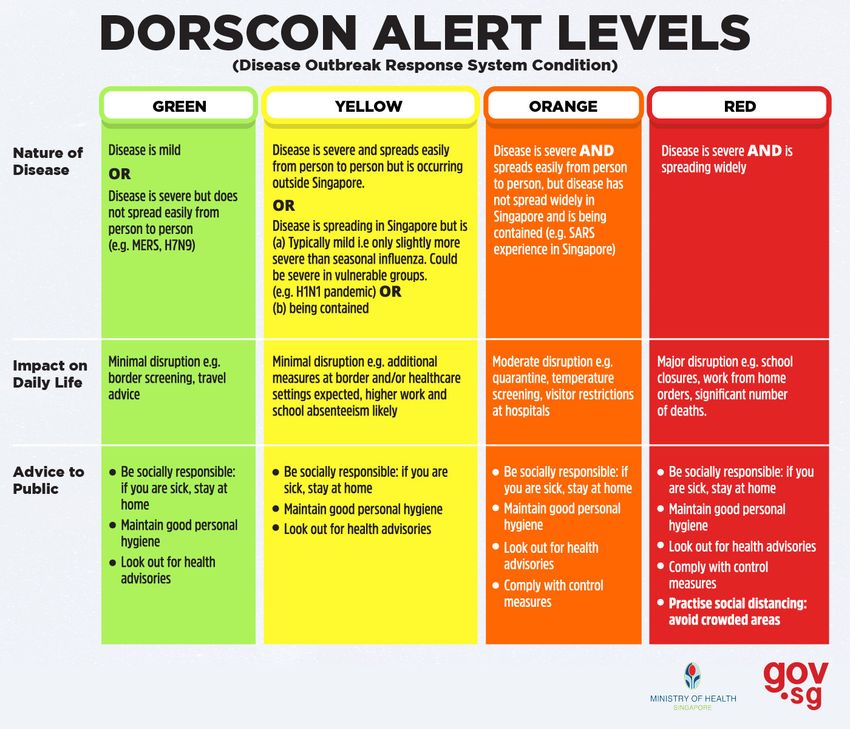
Co-authors

  • Diana Beatriz Bayani                                             •   Poay Huan Loh      • Wee Hian Tan
                                                                     •   Chai Ping
  • Natarajan Rajaraman
                                                                     •   Mikael Hartman
  • Jeremy Lim
                                                                     •   Soo Chin Lee
  • Hsu Li Yang                                                      •   Wei Peng Yong      Grantor:
  • Jason Yap Chin Huat                                              •   Prakash Paliwal
                                                                     •   Zhen Chang Liang   Special National University
  • Kok Joon Chong
                                                                                            Health Systems
  • Wee Hwee-Lin                                                     •   Somani Jyoti
                                                                                            COVID-19 Seed Grant Call
                                                                     •   Jimmy Teo Boon
                                                                         Wee
© Copyright National University of Singapore. All Rights Reserved.
Background
  • 23 Jan 2020: First
    confirmed case of COVID-
    19 in Singapore
  • Clinical services were
    being curtailed in
    preparation for escalation
    to DORSCON Orange
  • 07 Feb 2020: DORSCON
    Orange (15 days after first
    confirmed case)

© Copyright National University of Singapore. All Rights Reserved.
No framework to study the impact of a
               pandemic on non-communicable
                          diseases

© Copyright National University of Singapore. All Rights Reserved.
Methods

                                                  Rapid Literature                       Stakeholders
                                                      Review                               Interview

                                                                     Adaptation of the
                                                                       Donabedian
                                                                     Outcomes Model

© Copyright National University of Singapore. All Rights Reserved.
Methods – Rapid Literature Review
  • Goal: To examine indirect effects of past disease outbreaks to
    extract common themes
  • The review was limited to studies that assessed or described
    the effects of epidemics, pandemics, or disease outbreaks on
    other health services, and not the direct impact of the infectious
    disease itself
  • Studies that evaluated the impact on patient outcomes (e.g.
    clinical presentation of cancer patients with COVID-19), mental
    health, medical education and training, and health care workers’
    welfare were excluded
© Copyright National University of Singapore. All Rights Reserved.
Methods – Rapid Literature Review
  • Early studies on the COVID-19 pandemic published before May
    2020 were included (1 January 2000 - 7 May 2020)
  • The search was done on one database (PubMed) and title and
    abstract reviews were done by a single researcher (DB)
  • Recurring themes from the studies and evaluation parameters
    that were most commonly used were extracted

© Copyright National University of Singapore. All Rights Reserved.
Methods – Stakeholders Interviews
  • What aspect of your work has changed as a result of COVID-
    19?
  • What is the intermediate impact on health services and
    patients?
  • What is the likely longer-term impact on patient outcomes?
  • Collated responses were used to identify the indicators for each
    of the three components of structure, process and outcomes.

© Copyright National University of Singapore. All Rights Reserved.
Methods – Adapting the Donabedian’s
  Outcome Model

  Ref. https://improvement.nhs.uk/documents/2135/measuring-quality-care-model.pdf
© Copyright National University of Singapore. All Rights Reserved.

Results – Rapid Literature Review

                                                             Figure 1. PRISMA flow diagram of the rapid review

© Copyright National University of Singapore. All Rights Reserved.
Results – Rapid Literature Review
Table. Most common themes and parameters in studies evaluating indirect effects of disease outbreaks
1. Decreased utilization of healthcare services
2. Delay in pre-hospital care due to infection control measures
3. Decrease in delivery of non-urgent care
4. Delay or postponement of elective procedures
5. Organizational changes (e.g. shift to telemedicine, shift to primary care instead of hospital, triaging
and separating of suspect cases, use of personal protective equipment, redeployment, and
implementation of split team arrangements)
6. Emergence of new clinical guidelines (e.g. medical specialty or facility specific)
7. Disruption to research and education activities (e.g. medical specialty or facility specific)
© Copyright National University of Singapore. All Rights Reserved.Results
• Clinicians from five major medical and surgical disciplines
(cardiology, nephrology, oncology, neurology and other
infectious disease), as well as primary care, participated in
Zoom interviews
• List of discipline-specific indicators were captured
• Clinicians suggested to think of the impact of the pandemic in
different phases/ waves
© Copyright National University of Singapore. All Rights Reserved.Category Indicator Description Data source
Acute myocardial infarction & heart failure management
Process Door-to-balloon time for Time from the patient's Hospital record on case
acute myocardial arrival at the recipient diagnosis and case
infarction patients hospital to the time of movement
deployment of first
device, defined as balloon
inflation, manual
thrombectomy or direct
List of stenting, during PCI in
patients with ST elevation
indicators for Process Mean length of stay Number of inpatient days Hospital record on case
acute spent diagnosis and case
movement
myocardial Outcome In-Hospital mortality Death between admission Hospital record on case
infarction and and discharge among AMI diagnosis and case
and HF patients movement
heart failure Outcome Readmission and Crude cardiac Hospital record on case
management readmission mortality readmission rates or diagnosis and case
mortality rates of AMI movement
patients at 30-day, 6-
month, and 12-month
from index admission
Outcome Complication rate Patients experiencing any Hospital record on case
complication within 30 diagnosis and case
days after each discharge movement
© Copyright National University of Singapore. All Rights Reserved.Category Indicator Description Data source
Post-stroke management
Process Outpatient visits Number of outpatient Specialist clinic records
visits with Neurology
Process Home deliveries Number of home Pharmacy services
deliveries by pharmacist records
Process Teleconsultations Number of Specialist clinic records
teleconsultations
conducted
Process Rate of in-hospital No. of sessions Hospital record on
rehabilitation completed and percent case diagnosis and
List of complement (as a case movement
proportion of total
indicators for number of sessions
post-stroke recommended)
Process Rate of community No. of sessions Community
management rehabilitation completed and percent rehabilitation service
complement (as a provider records
proportion of total
number of sessions
recommended)
Outcome Hospital mortality Death between Hospital record on
admission and discharge case diagnosis and
with stroke as primary case movement
cause
© Copyright National University of Singapore. All Rights Reserved.Category Indicator Description Data source
Cancer management
Process Number of active Number of patients Hospital record on
treatments ongoing treatment case diagnosis and
(chemotherapy and case movement
radiotherapy)
Process Number of inpatient and Any planned or Hospital record on
outpatient visits unplanned inpatient or case diagnosis and
specialist outpatient case movement,
clinic visit for specialist clinic records
chemotherapy or
List of adverse drug reactions
indicators for due to chemotherapy
cancer Process Patients who received Received chemotherapy Hospital record on
chemotherapy prior to in the last 14 days of life case diagnosis and
management death [Yes/ No] case movement
Outcome Overall survival Time from initiation of Hospital record on
first treatment to death case diagnosis and
from any cause. case movement
Derivation: Date of
death or date of last
follow-up minus date of
initiation of first
treatment
© Copyright National University of Singapore. All Rights Reserved.Results – Adapted framework
Modified Donabedian Outcomes Model for the Evaluation of Pandemic Impact on non-communicable
diseases
© Copyright National University of Singapore. All Rights Reserved.Results – Adapted framework
• Locally, COVID-18 pandemic responses were rolled out or
recoiled in a calibrated manner, in line with pandemic response
strategy of containment in the early days of the pandemic,
followed by mitigation as the number of cases increased
exponentially and then suppression as the numbers began to
come down and local transmission is much reduced.
• Our framework attempted to reflect the changes over time to
more accurately characterize the impact of the pandemic on the
health system.
© Copyright National University of Singapore. All Rights Reserved.Discussion
• The framework provides a guidance for healthcare providers,
researchers, health service planners and governments to
objectively evaluate the impact of not just for COVID-19 but any
infectious disease outbreak.
• It can be applied to different contexts, regardless of the scope,
scale, and time horizon, and whether for short, medium, or
long-term.
© Copyright National University of Singapore. All Rights Reserved.Discussion
• The interviews with stakeholders were essential
• The study team’s assumptions were inaccurate
• We assumed that the number of patients undergoing active treatment
(including those with cancer) will be affected by COVID-19. However,
as there was sufficient capacity in the Singapore health system, the
care of patients with cancer were prioritized and most cancer patients
were able to receive the care that they need unless they choose not to
go to the hospital.
© Copyright National University of Singapore. All Rights Reserved.Limitations
• The indicators were developed based on the inputs of a limited
set of stakeholders in a single regional health system
• Seek funding to set up an international Delphi panel
• There may be limited feasibility of collecting these data in a low
resource country
• An essential list version needs to be developed
© Copyright National University of Singapore. All Rights Reserved.Future Plan - Applying the framework
• Patient-level health services utilization data from a regional
health system in Singapore
• Hospital and primary care
• Medicines, laboratory tests, procedures, etc
• Feb 2018 to Aug 2021
• Construct the list of indicators
• Compare pre- and post-COVID-19
• Stratify the analyses by waves of pandemic development
© Copyright National University of Singapore. All Rights Reserved.THANK YOU © Copyright National University of Singapore. All Rights Reserved.
Non-communicable disease prevention and
control during the era of COVID-19

The Association of Pacific Rim Universities (APRU) Webinar – Collaboration
in Crisis: The Impact of COVID-19 on Non-Communicable Diseases

Wednesday, March 17, 2021

Tony Kuo, M.D., M.S.H.S.
Department of Epidemiology, UCLA Fielding School of Public Health
Department of Family Medicine, UCLA David Geffen School of Medicine
Population Health Program, UCLA Clinical and Translational Science Institute
Chronic Disease and Injury Prevention, Los Angeles County Department of Public Health
COVID-19 Deaths in the United States

Source: https://isqua.org/covid19-research-page.html
COVID-19 Deaths in Other Countries

Source: https://isqua.org/covid19-research-page.html
COVID-19 Deaths in California

Source: https://isqua.org/covid19-research-page.html
COVID-19 Cases
  and Deaths in
  Los Angeles
  County

Source:
https://datastudio.google.com/reporting/
73d854a3-bc4c-4cbc-b830-
bf9da16d54ed/page/brFsB
The COVID-19 Pandemic in Los Angeles County

Roles in the Response:
•   Use of data science in
    outbreak management
•   Health plans & multi-
    county entities – efforts
    underway to address
    health equity and
    barriers to vaccine
    distribution
Leading Causes of Death in the United States Number of deaths (2019) • Heart disease: 659,041 • Cancer: 599,601 • Accidents (unintentional injuries): 173,040 • Chronic lower respiratory diseases: 156,979 • Stroke (cerebrovascular diseases): 150,005 • Alzheimer’s disease: 121,499 • Diabetes: 87,647 • Nephritis, nephrotic syndrome, and nephrosis: 51,565 • Influenza and Pneumonia: 49,783 • Intentional self-harm (suicide): 47,511 Source: Mortality in the United States, 2019, data table for Figure 2
Coronavirus Disease 2019 (COVID-19)
Delays in Care Could Cause Surge in Non-
Communicable Disease Conditions

Fear of COVID-19 Exposure Has Resulted in Reduced Healthcare
Visits

Ø   17% worsening symptoms
Ø   18% delayed diagnosis of a condition
Ø   23% delayed treatment
Ø   31% greater stress about a health condition
Ø   More than one-third have no plans to resume visits until better
    pandemic control or vaccine

Source: Quest Diagnostics, Health TrendsTM study of more than 2,000 U.S. Adults
Other Delays and Pandemic Considerations Ø Newly identified cancers declined from January 2019-February 2020 to March-April 2020 (e.g., breast cancer, from 132,513 to 9,475; colorectal cancer, from 56,744 to 4,377).1 Ø In the first 8 weeks of March and April 2020, HbA1c testing volume was reduced by as much as 66% compared to baseline weekly test volumes.2 Ø Almost 2/3 (63.5%) of hospitalizations among U.S. adults as of November 2020 were attributable to 4 cardiometabolic conditions: 30% obesity, 26% hypertension, 21% diabetes, 12% heart failure (simulation analysis using data from CDC’s COVID-NET, COVID Tracking Project, and 2015-18 NHANES).3 Ø The Cleveland Clinic: Results suggest that cumulative exposure to cigarette smoke is an independent risk factor for hospital admission and death from COVID-19. OR=1.26 (0.75-2.10), adjusted for age, race, gender, medication, and comorbidity.4 Ø Slow to reopen K-12 schools – concerns over child development and mental health. Vaccine distribution and its importance to noncommunicable chronic disease management. 1 Kaufman et al. JAMA Netw Open. 2020 Aug; 3(8): e2017267. 2 Fragala et al. Pop Health Managmt. 2021; 24(1): 8-9. 3 O’Hearn et al. J Am Heart Assoc. 2021; 10:e019259. 4 Lowe et al. JAMA Intern Med. 2021; Online Jan 25:E1-E3.
Heart Disease and Stroke in Los Angeles County
Age-adjusted prevalence of hypertension, and awareness, treatment, and
control of hypertension* among adults aged ≥18 years — Los Angeles County
                 and United States, 1999–2006 and 2007–2014
Annual Alzheimer’s Disease-Related Deaths and Age-Adjusted Mortality
Rates per 100,000 population in the United States, 2009-2017
140000 60
56.4 57.1
54.9
Age-Adjusted Mortality Rate Per 100,000 Person Years
120000
50.0 50
48.7 48.3
47.5
46.2 45.4
100000
40
Number of Cases
80000
30
60000
20
40000
10
20000
0 0
2009 2010 2011 2012 2013 2014 2015 2016 2017
Source: U.S. multiple causes of death datasetLife Expectancy in Los Angeles County by City and Unincorporated Communities
E-cigarette Use (Vaping) Epidemic

                                    14
Proposition 56 (2016) and other tobacco product tax
Tobacco Control and Prevention Program (TCPP) Priorities
• Reduce youth access to ALL tobacco products
• Tobacco retailer licensing (TRL)
• E-Cigarettes in TRL
• Healthy Retail Initiative
• Reduce exposure to secondhand smoke
• Smoke-free multi-unit housing (Housing Authority of City of
Los Angeles and Housing Authority of County of Los Angeles)
• Increase access to cessation services (e.g., California Smokers
Helpline 1-800-No-BUTTS)
• Media/public education campaigns (LA Quits webpage:
https://www.laquits.com/, >44 quit stories (videosPublic Health Response
Patel M, et al. Pediatrics. 2018. PMID: 29292305
Patel M, et al. Pediatrics. 2018. PMID: 29292305 19
Community Design: Multiple Impacts on Well-being

                                         Obesity & Chronic Disease
                                            access to clean air, free water, public
                                            transportation, walkways, healthy
                                            foods and opportunities for physical
                                            activity

                                         Crime & Violence
                                            access to safe neighborhoods (street
                                            lightening, street/building
                                            maintenance, recreational spaces)

Photo Credit: David McNew/Getty Images   Social Cohesion
                                            promoting civic engagement

                                         Mental Health
                                            density of alcohol, tobacco and
                                            marijuana dispensaries
Healthy Hospital Food Initiative • Supports improvements in the nutritional quality of food and beverages offered in hospital cafeterias, cafés, and vending machines. Hospitals and Health Centers Adventist Health White Memorial Children’s Hospital Los Angeles City of Hope National Medical Center Harbor-UCLA Medical Center High Desert Regional Health Center LAC +USC Medical Center Olive View-UCLA Medical Center Rancho Los Amigos Rehabilitation Center Supported by CDC Funding: Sodium Reduction in Communities Program* and 1422 grant, State and Local Public Health Actions to Prevent Obesity, Diabetes, and Heart Disease and Stroke
Los Angeles Food Policy Council (LAFPC)
        Key Accomplishments

     Healthy Neighborhood Market Network (HNMN)
     Developed a curriculum with 8 modules focused on promoting and selling
     healthy food in corner stores
     • Modules include marketing, store design and layout, social media
     • Stores receive tailored TA based on their needs

     COMPRA, the small store purchasing cooperative has 58 clients
     • 49 stores
     • 3 nonprofits
     • 6 private food enterprises
Promoting Community Physical Activity at School Sites Internet panel survey results: Self-reported relationship between using a school for physical activity and overall activity level among adults in Los Angeles (n=207).
Implement Community Plans to Promote Walking
Growing Choose Health LA

                           - Will launch Restaurant program
                                     - Will re-launch website
                   - Continue to Grow, Develop and Expand
National Diabetes Prevention Program Resources
Produce Prescription Project

• Patient eligibility:
   • Enrolled in Medicaid; and
   • Screened positive for food insecurity; and
   • Enrolled in the National Diabetes Prevention Program (DPP) OR
      with type 2 diabetes diagnosis

• Intended outcomes:
    • Increase PPR participants’ daily fruit and vegetable intake
    • Improve PPR participants’ household food security
    • Develop and implement a standardized program infrastructure
      to monitor PPR participants’ blood pressure and HgbA1c
      changes
Fresca y Saludable/Fresh & Healthy
Screen Refer Access
• NEVHC Family • Eligible patients will • Patients use card
Medicine Care receive $40 debit to buy fresh fruits
Coordinators and card (6-month and vegetables at
DPP Lifestyle program) participating
Coaches screen • Referred to SNAP- grocery stores
patients for Ed classes and
eligibility grocery store toursThe Wellness Center at Historic General Hospital
Phone-based Client Wellness Checks

                                     Wellness Navigators
                                     conducted wellness
                                     checks on TWC
                                     clients to ensure
                                     they have access to
                                     available resources
                                     while stay at home
                                     orders are in place.
                                     Wellness checks are
                                     tracked by class or
                                     program.
The Wellness Center: Client navigation referrals before versus after COVID-19 pandemic started Top referrals January through Top referrals after “Safer at Home” March 2020 Health Order 1. Healthy Cooking/Phys. Act. (43%) 1. Food Insecurity (53%) 2. Health Insurance Enrollment (34%) 2. Health Insurance Enrollment (44%) 3. Trauma Informed Care (10%) 3. Trauma Informed Care (26%) 4. Legal Aid (10%) 4. Legal Aid (23%) Overall, by December 2020 >4,700 clients received health navigation and related services.
Volume of Phone-based Client Wellness Checks
through January 2021
UCLA Clinical and Translational Science Institute

Source: https://ctsi.ucla.edu/overview/pages/pophealth-team

                                                              33
Research
Factors that impact health outcomes
                                                                           Mortality (50%)
     Health Outcomes                                                       Morbidity (50%)

                                                                                                  Tobacco use
                                                       Health behaviors                          Diet & exercise
                                                            (30%)                                 Alcohol use
                                                                                                   Unsafe sex
       Health Factors                                      Clinical care                         Access to care
                                                               (20%)                             Quality of care
                                                                                                   Education
                                                                                             Employment & Income
                                                Social & economic factors
                                                                                                    Racism
                                                          (40%)
       Programs and                                                                          Family & social support
          Policies                                                                             Community safety
                                                    Physical environment                     Environmental quality
                                                           (10%)                               Built environment

Source: http://www.countyhealthrankings.org/our-approach
QUESTIONS?
The impact of COVID-19 on physical activity

A/Prof Melody Ding, Sydney School of Public Health, FMH
Melody.ding@sydney.edu.au
   @DrMelodyDing

                            For: APRU Crisis Management Webinar

The University of Sydney
We acknowledge the tradition of
custodianship and law of the Country on
which the University of Sydney campuses
stand. We pay our respects to those who
have cared and continue to care for Country.
The University of SydneyThe University of Sydney
What will happen if our living environment changes
           From this                       to this?

The University of Sydney
What does the evidence say? • Increase? • Decrease? • Stayed the same • Mixed? The University of Sydney
Why is the evidence so heterogenous?
                                               The conclusions depend on:

                                               • Setting/policy/restrictions
                                               • Physical activity vs exercise
                                               • Context of physical activity
                                               • Study design (e.g., retrospective)
                                               • Sample characteristics
                                               • Measurement of physical activity
                           Tison et al. 2020

The University of Sydney
Three case studies: The University of Sydney Page 7
Study 1: Covid-19 and online inquiry

                           Ding D, del Pozo Cruz B, Green MA, et al. Is the COVID-19 lockdown
                           nudging people to be more active: a big data analysis. British Journal
                           of Sports Medicine 2020;54:1183-1184.

The University of Sydney
The University of Sydney
Study 2: Covid-19 and Step Counts in China

                                 • Shanghai residents
                                 • n=815 (202 days)
                                 • Step counts
                                   through Wechat
                                 • Opportunistic
                                   evaluation

The University of Sydney
Who were slower at recovering step counts
During the lockdown After the lockdown
• Older • Older
• Married • Married
• University educated • Not University educated
• Less active pre-COVID • ‘At risk’ adiposity
• ‘At risk’ adiposity
Ding et al. Int J Behav Nutri Phys Act, in press
The University of SydneyStudy 3: Leisure-time physical activity in the USA
§ Understanding America
Study (UAS)
§ Population
representative
§ n=4879 over 279 days
§ Days of exercise/week
The picture can't
be displayed.
The University of SydneyWho were less active during COVID-19
Sociodemographic Pre-COVID health Environment
• Younger characteristics Living in states
• Female • Less active with stringent
• Non-White • Obese containment
• High blood policies (Oxford
• No university COVID-19 Government
education pressure Response Tracker)
The University of SydneyThe impact of COVID-19 on physical activity
What we do not know? What we do know:
Precisely how much change • Very likely a negative
in each domain, by how impact
much at the population level • Prolonged low activity
levels has long-term
health complications
• Affect population
subgroup differentially
The University of SydneyLessons learned The opportunity The challenges • Potentially increased • Exacerbating gaps interest and awareness • Competing policy • Interruption– fast tracked priorities (trade-off) change • Increasing private car use • Resilience in some people The University of Sydney
The University of Sydney
The impact of COVID-19 on
     diabetes in China
                    Jue Liu
              Assistant Professor
  Department of Epidemiology and Biostatistics
   School of Public Health, Peking University
          Email: jueliu@bjmu.edu.cn
Global burden of diabetes
• A metabolic disorder
caused by genetic and
environmental factors
• It has become a critical
health concern
worldwide owing to its
high prevalence and
related disability and
mortality
• Among the top ten
causes of DALYs
(ranked eight)
Leading causes of global DALYs and percentage of total DALYs (1990 and 2019)
Lancet 2020;396(10258):1204-1222.
BMJ 2020;369:m997Burden of diabetes in China
12.8% 113.9 110
diabetes million billion
35.2% 24% in 2017
prediabetes of global patients
Prevalence Number Health care cost
0.67% in 1980 12.8% in 2017 BMJ 2020;369:m997Burden of diabetes in China
Overview of the four national surveys of diabetes in mainland China
BMJ 2020;369:m997Burden of diabetes in China
Overview of the four national surveys of diabetes in mainland China
Weighted prevalence 2007 survey 2010 Survey 2013 Survey 2017 Survey
Total diabetes, % 9.7 11.6 10.9 12.8
Diagnosed diabetes, % N/A 3.5 4.0 6.0
Undiagnosed diabetes, % N/A 8.1 6.9 6.8
Prediabetes , % 15.5 50.1 35.7 35.2
Awareness of diabetes, % N/A 30.1 36.5 43.3
Treatment of diabetes, % N/A 25.8 32.3 49.0
Control of diabetes, % N/A 39.7 49.2 49.4
BMJ 2020;369:m997Global burden of COVID-19
2021.3.16
Global Mainland China
4
new cases [all imported]
90066
confirmed cases
4636
deaths
>64,980,000
Source: WHO
vaccine doses administered National Health CommissionCOVID-19 & Diabetes
p A bidirectional relationship between COVID-19 and diabetes
• Diabetes is associated with an increased risk of severe COVID-19
• New-onset diabetes and severe metabolic complications of
preexisting diabetes, including diabetic ketoacidosis and
hyperosmolarity for which exceptionally high doses of insulin are
warranted, have been observed in patients with COVID-19
N Engl J Med. 2020;383(8):789-790The impact of diabetes on COVID-19 in China
• Aim: To systematically evaluate the prevalence of diabetes among
COVID-19 patients in China and its impact on clinical outcomes (severe
cases or death).
• Methods: We searched studies published in PubMed, Web of Science,
and EMBASE from December 1, 2019 to March 31, 2020 to identify
relevant observational study.
Liu et al. World J Diabetes. 2020;11(10):468-480.The impact of diabetes on COVID-19 in China
• Twenty-three eligible articles including 49564 COVID-19 patients (1573
with and 47991 without diabetes) were finally included.
• Nearly one in ten COVID-19 patients have diabetes in China.
• The pooled prevalence of diabetes was 10% (95%CI: 7%-15%) in COVID-19
patients.
Liu et al. World J Diabetes. 2020;11(10):468-480.The impact of diabetes on COVID-19 in China
p The pooled prevalence of diabetes:
• patients aged > 50 years (13%; 95%CI: 11%-16%)
• patients aged ≤ 50 years (7%; 95%CI: 6%-8%)
• severe patients (17%; 95%CI: 14%-20%)
• non-severe patients (6%; 95%CI: 5%-8%)
• dead patients (30%; 95%CI: 13%-46%)
• survivors (8%; 95%CI: 2%-15%)
Liu et al. World J Diabetes. 2020;11(10):468-480.The impact of diabetes on COVID-19 in China
Diabetes is associated with a higher risk of severe illness and death in
patients with COVID-19.
p Compared with patients without diabetes:
• the risk of severe cases was higher (RR = 2.13, 95%CI: 1.76-2.56, I2 = 49%)
in COVID-19 patients with diabetes
• the risk of death was higher (RR = 3.16, 95%CI: 2.64-3.78, I2 = 34%) in
COVID-19 patients with diabetes
Liu et al. World J Diabetes. 2020;11(10):468-480.The impact of COVID-19 on diabetes in China • Impact of the COVID-19 lockdown on diabetes patients • Lifestyles? • Glycemic control? • Diabetes management? • Severe metabolic complications of preexisting diabetes ? • COVID-19–related new-onset diabetes ? • ……
Association of Blood Glucose Control and Outcomes
n Patients with COVID-19 and Pre-existing Type 2 Diabetes

                  • A cohort of 7,337 COVID-19 patients with or without
                  diabetes was retrospectively studied (952 had T2D) in Hubei
                  Province, China
                  • Subjects with T2D required more medical interventions and
                  had a significantly higher mortality (7.8% versus 2.7%;
                  adjusted HR, 1.49).
                  • Diabetes status increased the mortality risk of patients with
                  COVID-19. Well-controlled blood glucose correlated with
                  improved outcomes in infected patients (adjusted HR, 0.14)
                  • These findings provide clinical evidence correlating more
                  proper blood glucose control with improved outcomes in
                  patients with COVID-19.

                                                    Zhu et al. Cell Metab. 2020;31(6):1068-1077.e3.
Glycemic control and lifestyles in children
with type 1 Diabetes
• Aimed to investigated the impact of COVID-19 lockdown on
glycemic control in children with type 1 diabetes
• Continuous glucose monitoring data during and after
lockdown
• Demographics and lifestyle change-related information
were collected
Wu et al. J Diabetes Investig. 2021.During lockdown,
individuals:
• reduced their
physical activity
• received longer
sleep duration
• spent more time on
diabetes
management.
Wu et al. J Diabetes Investig. 2021.• Glycemic control did not deteriorate in children with type 1 diabetes
around the COVID-19 pandemic.
Wu et al. J Diabetes Investig. 2021.Excess mortality in Wuhan city and other parts of China
during the three months of the COVID-19 outbreak: findings
from nationwide mortality registries
• Setting: 605 urban districts and rural counties in China’s
nationally representative Disease Surveillance Point (DSP)
system.
• The DSP system recorded 0.58 million deaths from January to
March 2020
• Findings: Except in Wuhan, no increase in overall mortality was
found during the three months of the covid-19 outbreak in
other parts of China. The lower death rates from certain non-
covid-19 related diseases might be attributable to the
associated behaviour changes during lockdown.
• The findings highlight the need for rapid and coordinated
actions during major outbreaks of infectious diseases to contain,
suppress, and eradicate transmission and minimise the impact
on human health and societal and economic activities.
Fig. Trends in weekly observed (dashed orange lines) versus predicted (blue solid lines) mortality rates
Liu et al. BMJ. 2021;372:n415 for selected major diseases between 1 January and 31 March 2020 in China across different DSP areas.Liu et al. BMJ. 2021;372:n415
Impact of the COVID-19 lockdown on diabetes
                         patients in other countries

• Among diabetes patients in
  Brazil (including type 1, type
  2, GDM, etc.), compliance
  with medication use
  significantly reduced after
  the lockdown.
• These patients also showed
  fewer healthy lifestyle habits
  after the lockdown.
• Among patients with type 2
  diabetes, the psychological
  effect of lockdown was
  significantly more in women
  than men.

                                        Barone et al. Diabetes Research and Clinical Practice. 2020.
Impact of the COVID-19 lockdown on diabetes
patients in other countries
• Overall Glycemic control got deranged among diabetic patients in India
during the lockdown period.
• Lifestyle changes and psychological stress identified as possible factors
responsible for derangement of glycemic control.
• The duration of lockdown is directly proportional to the worsening of
glycemic control and diabetes-related complications.
• Multidisciplinary approach is required which is patient centric for
achieving good glycemic control.
Khare et al. Prim Care Diabetes. 2021.
Khare et al. Diabetes Metab Syndr.2020.Future research
p Long term effect of COVID-19 on diabetes
p COVID-19–related new-onset diabetes
• Epidemiology
• How it develops
• The natural history
Gain clues regarding appropriate care for patients with diabetes
during and after the course of COVID-19
N Engl J Med. 2020;383(8):789-790.Thanks !
You can also read