Addressing territorial digital divides through ICT strategies: Are investment decisions consistent with local needs?
←
→
Page content transcription
If your browser does not render page correctly, please read the page content below
Munich Personal RePEc Archive

Addressing territorial digital divides
through ICT strategies: Are investment
decisions consistent with local needs?

Reggi, Luigi and Gil-Garcia, J. Ramon

Rockefeller College of Public Affairs and Policy, University at
Albany, SUNY, USA

2021

Online at https://mpra.ub.uni-muenchen.de/105003/
MPRA Paper No. 105003, posted 30 Dec 2020 17:33 UTC
Manuscript accepted in Government Information Quarterly, 2021.
https://doi.org/10.1016/j.giq.2020.101562

Addressing territorial digital divides through ICT strategies: Are
investment decisions consistent with local needs?
Luigi Reggi 1 & J. Ramon Gil-Garcia 1, 2, 3
1
  Rockefeller College of Public Affairs and Policy, University at Albany, SUNY, USA
2
  Center for Technology in Government, University at Albany, SUNY, USA
3
  Universidad de las Américas Puebla, Mexico

Abstract
Governments around the world are investing a great amount of resources on the development of
an information society. These investments are particularly important as an attempt to close
digital divides among countries and regions within countries. However, there is no clear
evidence that suggests that current Information and Communication Technology (ICT) policies
are helping align investments with the actual needs of the local contexts. Based on data about the
allocation of 2014-2020 EU Funds, this paper analyzes the relationship between local needs and
investment decisions aiming at bridging territorial digital divides. The results identify four
different regional strategies developed around four policy goals: broadband, digital inclusion,
digital government services, and the use of ICTs in enterprises. The results also show that unlike
the past 2007-13 period, the allocations to these goals appear to be consistent with the ICT local
context, i.e. funding for a given goal is higher in the regions that need it the most. Therefore, our
main recommendation for the European Commission and Member States is to keep existing
requirements for developing evidence-informed “Digital Growth” strategies for the next 2021-27
period. We also suggest to strengthen existing support tools for regional governments.

Keywords: Digital divide, Broadband, Technology Policy, Smart City, European Policy,
Regional Planning, European Funds.

                                                                                                    1
1 Introduction
Governments around the world are using Information and Communication Technology (ICT)
policies to foster the development of an information society (Castells, 2011). These ICT policies1
focus on different targets, i.e. the private sector, public sector, or individual citizens, each
considered as a producer or a user of technology. More specifically, ICT policy goals usually
include the development of digital government applications and services, incentives for the
introduction of ICT technologies in Small- and Medium-Sized Enterprises (SMEs), Smart City
projects at the local level, improved access to broadband connectivity or the implementation of
policies for addressing digital divides among citizens and enterprises (Norris, 2001; Van Dijk,
2005). For example, the United Nations considers the ICTs as powerful tools to achieve their
Sustainable Development Goals (SDGs) (Janowski, 2016; Tjoa & Tjoa, 2016). The International
Telecommunication Union, a specialized agency of the United Nations, has identified key ICT
contributions to all SDGs, including telemedicine, digital infrastructures such as the 5G systems,
ICT for education, and Internet access to reduce inequalities, as specific action lines have been
developed and discussed during international meetings such as the World Summit on the
Information Society Forum (International Telecommunication Union, 2019). The importance of
ICT development, especially in terms of broadband availability and digital transformation of the
public services, has also been highlighted by the 2020 health crisis, making the need to bridge
existing digital divides even more pressing (Moon, 2020).
Strategic use of available public funding is crucial for ICT policies, as money allocated during
the programming phase of the policy cycle represents the main input for subsequent
implementation (Misuraca et al., 2013). The financial input is usually very relevant since ICT
policies require significant investments for acquiring equipment and recruiting and training staff,
among other costs (Gascó, 2005). Issues related to the availability of financial resources are
found at both state and local levels, and are even more urgent in low development areas
(Edmiston, 2003; Ganapati & Reddick, 2014). In this context, the allocation of the available ICT
budget to different policy goals is based on the strategic approach that policy makers decide to
adopt. In turn, strategic decisions are informed by a wide array of inputs including political
inputs, values, organizational factors, and the use of available evidence in terms of statistical data
and indicators, as well as codified knowledge included in scientific or policy reports (Mele et al.,
2014).
In particular, these strategies should be based on the analysis of existing local ICT needs.
Existing efforts to measure the current state of development of Information Society can help
policy makers assess existing gaps and plan public interventions accordingly (Huggins, 2010;
Rorissa et al., 2011). In the European context, for example, the Digital Economy and Society
Index (DESI) evidences wide and persistent gaps across European countries by considering five
dimensions: broadband connectivity, human capital, use of Internet services, integration of
digital technology, and digital public services (European Commission, 2020). Policy makers,
once having access to available data on the local ICT context, could also consider other relevant
contextual conditions that are key to the effective introduction of technology, such as digital
1
The term “ICT policy” is closely related to “Information Society policy”, which is also employed in the literature
(Mansell & Steinmueller, 2000; Menou & Taylor, 2006; Misuraca et al., 2012; Misuraca et al., 2013). Other scholars
use the term “Technology policy” to refer to government policies specifically focused on affecting the evolutionary
trajectories of innovation in the private sector (Foray, 2009; Freeman, 1987).
2skills, institutional arrangements, and socio-economic conditions (Fountain, 2001; Gil-Garcia,
2012; Heeks, 2005).
Nevertheless, so far, only a few studies have focused on the strategic choices for resource
allocation to different ICT policies, while even fewer have analyzed whether this funding
allocation is based on or at least consistent with actual context, i.e. that policy decisions are
aligned to the most important need of each region (Kleibrink et al., 2015; Reggi & Scicchitano,
2014).
In the European Union, a budget of 21.4 billion euros has been assigned to ICT policies by the
national and sub-national governments in the current EU 2014-2020 programming period.2 This
budget is concentrated in the less developed areas of Europe, where it represents a crucial source
of funding for addressing current digital divides (Reggi & Scicchitano, 2012). Also, it can cover
several kinds of specific ICT policy goals, with national and regional governments having the
chance to decide how much money to allocate to each specific goal based on the
recommendations and a set of legal requirements from the European Commission.
While most of the literature considers each ICT policy goal as a separate research topic, such as
digital government or broadband policies, this context gives us the chance to offer a holistic view
of how different ICT policy goals become part of broader strategies, and what factors may
influence these strategic decisions. Therefore, the goal of this paper is to respond to the
following research questions: (RQ1) What strategies drive the allocation of public funding and
which policy goals mainly characterize each strategy? And (RQ2) Are financial allocations to
these main policy goals consistent with the local context, in terms of existing digital divides to be
addressed?
The paper is organized in seven sections, including the foregoing introduction. Section two
reviews the extant literature on context-aware ICT policies, territorial digital divides, and other
contextual factors. After a presentation of data and methods, the results section shows some
descriptive statistics and outcomes of a two-step quantitative analysis, which is discussed in the
subsequent section. Finally, the conclusions are drawn, including policy recommendations and
possible avenues for future research.
2 Assessing digital divides in local contexts
The analysis of local context is widely seen as a crucial component of ex-ante evaluation of ICT
policies (Castelnovo & Sorrentino, 2018; Heeks, 2002, 2005). According to the socio-technical
view of the relations between technology and organizations, the context in which technology is
employed plays a major role in determining the success or failure of a digital program
(Orlikowski, 1992, 2010; Orlikowski & Scott, 2008). Several authors, in fact, highlight the
importance of social, institutional, and organizational contexts when introducing new
technologies (Fountain, 2001; Heeks, 2005).
Context-aware ICT policies consider not only specific local needs in terms of ICT development -
which can be directly targeted by these policies - but also other contextual factors that can
indirectly affect their results. In particular, policy makers are expected to assess the relative
performance of a set of territorial indicators regarding their specific context, compared to those
2
The total amount is reported in the European Commission’s “ICT monitoring” website:
https://s3platform.jrc.ec.europa.eu/ict-monitoring
3of other comparable areas, assuming that local governments can learn from the methods based on
the territorial comparison and systematic measurement of progress over time (Codagnone et al.,
2015; Huggins, 2010; Maheshwari & Janssen, 2013; Rorissa et al., 2011).
2.1 Territorial digital divides
The first type of contextual factors deals with the state of the ICT context that policies aim to
address. These factors vary significantly by geographical areas, thus creating digital divides in
the development of Information Society between more and less advanced areas (Van Dijk,
2005). National and sub-national disparities in ICT diffusion are reported by international
statistics in both developed and developing countries, such as the United Nations e-government
index or the ITU report on the development of Information Society. This is what Norris (2001)
calls “global digital divide” (p. 4).
Melody (1996) identifies two main components of the Information Society. The first,
“Information infrastructures” represent physical systems (e.g. networks) or services. The second,
“applications”, take advantage of digital infrastructures to deliver products and services.
Businesses, governments, and, to a lesser extent, individual citizens, can be both users and
producers of such innovations. Although the “supply-side” of digital applications typically
includes products and services produced by the ICT and media industry (Misuraca et al., 2013;
OECD, 2011), private sector organizations are also users of existing ICTs, with goals such as
innovating production processes or better communicating with other actors in digital ecosystems.
The same logic also applies to public sector organizations, which deliver digital government
services to citizens and enterprises, and also use ICTs in crucial activities such as information
management, procurement, and policy making.
The state of digital infrastructures is considered an enabling condition for many ICT
interventions, as the Internet connectivity is believed to be capable of closing digital gaps among
governments, citizens and enterprises, and stimulate economic growth (Fernández‐i‐Marín,
2011). According to Seri et al. (2014), “ICT infrastructure (as measured, in primis, by broadband
penetration) is the main “hard” driver of the national diffusion of public eServices, both for
availability, usage and their gap; equally, its importance holds for both services aimed at citizens
and enterprises” (p. 508). Ferro et al. (2008) found that access to the Internet via broadband
networks increases Internet use for different purposes. For example, access to high-speed
networks enables the provision of advanced services such as telemedicine, or it can transform the
internal production processes of SMEs thanks to technologies such as Artificial Intelligence or
the Internet of Things. Although broadband policies are actively promoted in both developed and
developing countries, the differences in broadband penetration across the world are very high
(Belloc et al., 2012). Geographical factors such as the presence of hills and mountains in the
area often negatively affect broadband penetration due to increased deployment costs. Other
factors include low demand of broadband access in dispersed or rural areas (Ferguson, 2004) and
the level of institutional capacity (Matteucci, 2020).
On the applications side, key providers of digital services are targeted by ICT policies in both the
private and public sectors to promote innovation, efficiency and effectiveness. While the ICT
industry has been leading the development of ICT innovations in all fields, governments all
around the world have contributed to the funding of research on key technologies (Mazzucato,
2015), while also aiming to use ICTs to improve service delivery, transparency and citizen
participation. For example, digital government service provision has been widely studied in
4terms of website functionalities and open government datasets available. Sub-national divides
have been considered in specific countries based on the collection of data at the local level
(Arduini et al., 2013; Gil-Garcia, 2012), or thanks to the availability of comparable data at the
sub-national level produced by super-national government statistical organizations such as
Eurostat (Reggi & Scicchitano, 2014). Sandoval-Almazan and Gil-Garcia (2012) found that
differences in capabilities, ICT skills and access to financial resources can explain the existing
divides in the provision of digital government services in Mexican municipalities. Specific
policies have been implemented to address this “digital government divide” in the peripheral
areas by strengthening collaboration among local governments (Ferro & Sorrentino, 2010). Other
scholars have focused on the unique characteristics of particular territorial domains such as the
“megacities”, which give them several advantages compared to the surrounding areas in terms of
digital government development (Gil-Garcia et al., 2019).
While the concept of digital divide is more traditionally related to the development of digital
infrastructures and applications, it has also been applied to the importance of use, as specific
policies target governments, citizens and enterprises, in particular SMEs, as users of ICTs. In
particular, the literature focuses on access, skills, and capacity to reap the benefits of information
society initiatives. Scholars have highlighted the differences between countries in the use of ICTs
in government, developing the concept of “e-government divide” across the World (Gascó,
2005). Digital inclusion policies target specific categories of citizens, as digital divides are
influenced by multiple dimensions and perspectives such as gender, age, ethnicity, values,
believes, and education, among others (Andreasson, 2015; Ferro et al., 2011; Gil-Garcia et al.,
2013; Helbig et al., 2009). This “usage gap” is also highlighted in several studies exploring the
factors that influence the take-up of digital government services (Nam, 2014; Van Deursen et al.,
2006).
Access to technology and capacity to effectively use it has also been highlighted in the case of
managers and employees in SMEs (Arendt, 2008), along with other characteristics such
dimension and economic sector. In particular, the digital divide literature often identifies location
as an important predictor of access to digital infrastructures and digital literacy (Ferro et al.,
2011; Hennessy et al., 2016), since the difference between cities and rural or mountain areas
reflects the differences in basic public services availability. Some scholar have focused on
within-country digital divide, highlighting significant sub-national variations between
metropolitan areas such as capital regions and less developed areas, which reflect the divides in
economic development (Vicente & López, 2011). Ruiz-Rodríguez et al. (2018), focusing on the
case of Spain, show how the digital divide in SMEs has also an important regional dimension.
2.2 Socio-economic and institutional environment
A second type of contextual factors includes economic, political and institutional elements. First,
the level of economic development heavily influences the levels of input of ICT policies in terms
of financial resources available, as well as technical and organizational capacities for policy
implementation (Gascó, 2005). The wealth of an area also influences the chances for citizens to
access to ICTs and use them effectively, since income is a powerful predictor of digital exclusion
(Ferro et al., 2011).
Second, political and institutional factors greatly shape, in particular, the implementation of
digital government policies. Political culture and changes in political decisions over time are
important factors, especially for the implementation of multi-annual ICT programs (Gil-García &
5Pardo, 2005). In particular, “institutional arrangements” such as laws and regulations of the local
context play a major role (Fountain, 2001). The quality of local institutions has been defined in
terms of impartiality, low corruption, efficiency and effectiveness (Rothstein & Teorell, 2008).
In this literature, the concept of impartiality has been connected to the idea of “all citizens treated
equally” by government institutions, while the rule of law and the fight against corruption
represent practical tools to achieve it (Rothstein & Teorell, 2012). Good institutions are
expected to positively influence the enactment of newly introduced technologies, especially
when technology is introduced in complex organizational environments such as the public sector
(De Vries et al., 2016; Fountain, 2001; Gil-Garcia, 2012).
The institutional culture in which ICT policies are embedded also play a role (Guy Peters, 2008;
Loughlin, 1997). While there are empirical studies showing that national culture matters in
digital government development (Khalil, 2011), some authors have hypothesized that
administrative culture and state traditions can affect digital government development (De Vries
et al., 2016; Schuppan, 2009) and online transparency (Cucciniello et al., 2017; Rodríguez
Bolívar et al., 2015).
3 Data and methods
This article employs data on the financial allocations of European Regional Policy, the main
development policy in the EU. This policy targets all EU Regions and Countries and support the
implementation of several goals included in the European Digital Agenda strategy (European
Commission, 2010). Based on the budget negotiated at the regional and national levels, policy
makers decide how to allocate this money to different policy goals related to ICT development
such as digital government, broadband development, and digital inclusion (see the full list of
“intervention fields” in Table 1). All policy goals are coded and descripted in the common EU
regulation (Commission Implementing Regulation No. 215/2014 of 7 March 2014). We merged
data on financial allocations from the European Commission – Joint Research Centre with data
from Eurostat on the ICT context and the Quality of Government Institute to construct a cross-
sectional dataset composed of 108 European lagging regions (sub-national governments)3.
3.1 Data on funding allocations
For each region, financial allocations to 14 “intervention fields” related to ICT policies are
included as a percentage of the total budget for ICT development available. Intervention fields
are administrative classification items that are used by Regional and National governments to
report on their financial allocation decisions to all different policies financed by European
3
Regions are considered here at the NUTS2 geographical level, with the exception of Germany and the UK where
the geographical units considered is NUTS1 (further aggregation of NUT2-level regions) and smaller countries like
Croatia, Cyprus, Estonia, Latvia, Lithuania, and Slovenia, where the national level is considered. Geographical
levels refer to the Nomenclature of Territorial Units for Statistics (NUTS), a statistical classification standard
created by Eurostat in 2003. NUTS0 is the code for the whole country.
Data on funding allocations were downloaded from the website of the European Commission’s Joint Research
Center at https://s3platform.jrc.ec.europa.eu/ict-monitoring. Data on the quality of government are from the Quality
of Government Institute’s website at https://qog.pol.gu.se/data. Contextual ICT indicators are retrieved from the
Eurostat website (ec.europa.eu/eurostat).
6Regional Policy. The data refer to funding allocations made in 2013 or the beginning of 2014 for
the 2014-2020 programming period and were retrieved in 2017.
As showed in Table 1, we aggregated financial allocations to similar intervention fields when
information was redundant. Therefore, the 10 ICT “policy goals” are developed by us for
analysis purposes in this study. In particular, the “Broadband” policy goal derives from the
aggregation of three intervention fields corresponding to three different types of broadband
networks. The Digital Inclusion (“eInclusion”) policy goals derives from the sum of the
allocations to two intervention fields, one used when the money comes from the European Social
Fund (ESF), and the second when the European Regional Development Fund (ERDF) is
employed. The ICT in SMEs policy goals includes two separate interventions fields, one more
specifically related to the cooperation between large enterprises and SMEs, and the other digital
services that have SMEs as their main target. The goal named “ICT_Agri” refers to ICT
investments in rural areas financed by the European Agricultural Fund for Rural Development,
mainly regarding the competitiveness of rural businesses.
ICT policy
“Intervention fields” as listed in the EU common Regulation for 2014-2020
goal
Broadband • ICT: Backbone/backhaul network
• ICT: High-Speed broadband network (access/local loop; >/= 30 Mbps)
• ICT: Very high-speed broadband network (access/local loop; >/= 100 Mbps)
ICT_Infr • ICT: Other types of ICT infrastructure/large-scale computer resources/equipment (including e-infrastructure,
data centres and sensors; also where embedded in other infrastructure such as research facilities,
environmental and social infrastructure)
eGov • e-Government services and applications (including e-Procurement, ICT measures supporting the reform of
public administration, cyber-security, trust and privacy measures, e-Justice and e-Democracy)
ehealth • ICT solutions addressing the healthy active ageing challenge and e-Health services and applications (including
e-Care and ambient assisted living)
PSI • Access to Public Sector Information (including open data e-Culture, digital libraries, e-Content and e-
Tourism)
SmartTransp • Intelligent transport systems (including the introduction of demand management, tolling systems, IT
monitoring, control and information systems)
SmartEnergy • Intelligent Energy Distribution Systems at medium and low voltage levels (including smart grids and ICT
systems)
eInclusion • ESF - Enhancing the accessibility, use and quality of information through the development of digital literacy,
investment in e-inclusion, e-skills and related entrepreneurial skills
• ERDF - e-Inclusion, e-Accessibility, e-Learning and e-Education services and applications, digital literacy
ICT_SMEs • Productive investment linked to the cooperation between large enterprises and SMEs for developing
information and communication technology (‘ICT’) products and services, e-commerce and enhancing
demand for ICT
• ICT Services and applications for SMEs (including e-Commerce, e-Business and networked business
processes), living labs, web entrepreneurs and ICT start-ups)
ICT_Agri • ICT in rural funds (mainly funds to rural businesses)
Source: Commission Implementing Regulation (EU) No 215/2014 of 7 March 2014
Table 1 - Policy goals for funding allocations considered
7One hundred regions classified by the EU Commission as “more developed” are excluded from
the analysis4.
3.2 Data on the regional context
Data on the context all refer to year 2013, when the allocation decisions were made. We selected
4 indicators, one for each ICT contextual factor, based on the availability of data from official
sources, as reported in Table 2. Selected indicators reflect the different facets of territorial digital
divides, considering infrastructural gaps as well as use gaps among citizens and enterprises.
ICT contextual
Indicator Notes
factor
Percentage of households
Households living in areas served by NGA, which includes the following
Digital having access to New
technologies: FTTH, FTTB, Cable Docsis 3.0, VDSL and other superfast
infrastructures Generation Network (NGN)
broadband (at least 30 Mbps download). Available at the NUTS0 level.
broadband
Percentage of Individuals
who used the Internet for
Digital government Individuals aged 16 to 74. Available at the NUTS2 level.
interaction with public
authorities
Percentage of individuals
Digital divide
who have never used the Individuals aged 16 to 74. Available at the NUTS2 level.
among citizens
Internet
Enterprises sending/receiving all type of information on the supply
Percentage of enterprises
chain (e.g. inventory levels, production plans, forecasts, progress of
Use of ICTs in sharing electronic
delivery) via computer networks or via websites, but excluding
enterprises information on the supply
manually typed e-mail messages. Enterprises with 10 or more persons
chain
employed are included. Available at the NUTS1 level.
Table 2 - Descriptive statistics on the variables employed
As for the other contextual characteristics, a measure of quality of institutions is used, namely
the “European Quality of Government Index”, developed by the University of Gothenburg,
Sweden. The index reflects the perceptions and experiences of a large sample of European
citizens on the quality of local institutions in 2013.
3.3 Methods
We use a two-step approach in order to address the two research questions. In the first step, the
data on funding allocations are explored through a multivariate analysis to (a) identify relevant
groups of EU regions following similar strategies and (b) find out which specific policy goals
mainly characterize each strategy. The unit of analysis is the European Region, as defined
4
“More developed” regions are those whose GDP per capita is above 90% of the average GDP of the EU-27. They
receive only the 23.4% of total amount of ICT funding, while the remaining 76.6% is concentrated in 108 regions
classified as “less developed” (where GDP per capita is less than 70% of the EU average) and “in transition” (GDP
per capita between 75% and 90%). In these regions, the budget available for ICT policies represents a very high
proportion of the total ICT investments including other sources of funding such as national or regional funds (Reggi
& Scicchitano, 2014). Therefore, focusing on the “less developed” and “in transition” regions minimizes the risk
that other sources of funding is used that are not considered in this analysis, as it usually happens in the “more
developed” areas (Reggi & Scicchitano, 2014).
8above. In particular, a Principal Component Analysis (PCA) is applied to the financial
allocations to the ten policy goals in Table 1 with the aim of reducing the total number of
variables for the subsequent Cluster Analysis. An agglomerative hierarchical Cluster Analysis
(CA) based on the “Agnes” procedure is applied to the principal components resulting from the
PCA and accounting for more than 50% of the total variance (Kaufman & Rousseeuw, 2009).
Each identified cluster corresponds to an ICT strategy. A “v test” is performed to assess the
association of each ICT goal to each identified strategy. The “v test” lets us identify which policy
goals mainly characterize the strategies by comparing the mean of each group with the mean of
all observations. If the mean of the allocations for a policy goal (in percentage) is higher than the
overall mean and it is statistically significant, the goal can be associated with the strategy (Lebart
et al., 1995). The analysis is carried out by using the FactoMineR package in R.
In the second step, we focus on the allocations to the “core” policy goals that mainly characterize
each strategy, as revealed in the first step. Eight cross-sectional linear regression analyses (OLS
models) are carried out to explore the links between the financial allocations to each “core”
policy goal (dependent variables) and all the different contextual factors (independent variables).
The OLS method is chosen based on the characteristics of the dependent variables, which are
continuous, consistent with the OLS requirements (Wooldridge, 2010). We then look at the signs
of the coefficients of the independent variables to find out whether each contextual factor had a
positive or negative influence on the decision to invest public money on each ICT “core” goal.
4 Analysis and Results
This section presents the main results of our analysis. It starts with a description of the data
employed, followed by a presentation of the result of the CA, aimed at revealing the prevailing
strategies for financial allocations to the different ICT policy goals. The results of the OLS
models are presented in the final sub-section.
4.1 Descriptive statistics
Some descriptive statistics of the variables included in the analysis are showed in Table 3.
9Type of variable Variable Mean SD
Financial allocations eGov 13.2 12.4
to ICT goals (in %)
eHealth 4.4 4.9
ICT_Infr 3.0 5.6
Broadband 24.2 17.1
eInclusion 17.4 17.7
PSI 5.2 5.9
Smart Transp 10.8 8.1
Smart Energy 6.7 9.5
ICT_SMEs 11.6 12.6
ICT_Agri 3.5 8.7
ICT-specific Digital infrastructures: “Percentage of households having
contextual factors 55.6 20.1
access to New Generation Network (NGN) broadband”
Digital government: “Percentage of Individuals who used
30.0 13.9
the Internet for interaction with public authorities”
Use of ICTs in enterprises: “Percentage of enterprises
15.8 5.2
sharing electronic information on the supply chain”
Digital divide among citizens: “Percentage of individuals
30.0 11.6
who have never used the Internet”
Socio-economic and Total ICT budget (million euros) 152.6 138.8
institutional factors
Quality of Government Index 41.5 15.0
GDP per capita (billion euros) 30.0 34.5
Table 3 - Descriptive statistics on the variables employed
In particular, the mean values of funding allocations to the different ICT policy goals (in
percentages) give a preliminary indication on the distribution of the total available budget. The
goal with the largest share of funding is broadband, with over 4 billion euros of programmed
resources in the EU lagging regions, corresponding to 24.2% of the total budget for ICT policies
(16.5 billion euros). The second largest goal is digital inclusion (“eInclusion”) with an average
allocation of 17.4%, followed by digital government (“eGov”, 13.2%). As for the selected ICT
context indicators, access to broadband infrastructure is the one with the highest standard
deviation (20.1%), showing relevant differences among European regions5. With a EU average
of 30% and a standard deviation of 13.9%, also the diffusion of digital government, in terms of
the use of online government services by citizens, shows the presence of regional variations that
are worth exploring.
5
European regions are sub-national institutional entities directly below the state level. The EU policy employs the
statistical units “NUTS2” to refer to European regions (see NUTS definitions in the methods section).
104.2 Step 1 - Exploring regional strategies for funding allocation and identifying
“core” policy goals
First, a PCA is conducted with the aim of reducing the number of variables to be used in the
subsequent CA. The results of the PCA include a total of 9 dimensions. In particular, the sum of
cumulative variance of the first 4 dimensions is 64.1% of the total variance - which is above the
recommended 50% threshold (Kaufman & Rousseeuw, 2009). Second, we then use these 4
dimensions as input values for the CA. We also employ the NbClust procedure in R, which
compares the results of 30 different methods, to find out the optimal number of clusters (Charrad
et al., 2012). Thanks to this procedure, four clusters are used to cut the hierarchal tree in the CA.
As a result, we are able to classify each EU region into one of the four identified clusters, each
representing a different strategy in allocating the EU funds to the different policy goals. Each
strategy is followed by a consistent set of EU regions that have made similar allocation choices.
Furthermore, the “v test” helps us identify which ICT policy goals characterize each strategy.
Table 4 shows the four revealed strategies and, for each strategy, a) the average value of
financial resources allocated to each policy goal (in percentage) and b) the results from the “v
test”. The higher the percentage of EU funding allocated to each policy goal, the higher is the
contribution of the policy goal to the strategy. In addition, when the value of the v test is positive
and significant, the policy goal contribution to that strategy is relevant also considering its
contribution, on average, to all other strategies. By considering both these indicators, four “core”
policy goals are identified as the ones having the most important role in characterizing each
strategy. “Core” policy goals are highlighted in grey.
The first strategy is focused on increasing the coverage of the NGN (New Generation Network)
broadband networks (41% average investments), while the other three policy goals show only
marginal contributions to the characterization of the strategy (low allocation percentages and
negative v test values). The focus of the second strategy is digital government, the access to
Public Sector Information (“PSI”, including Open Government Data) and “eHealth” solutions,
with the “eGov” policy goal being the “core” goal with a mean of 25% and the highest v test
value. The third strategy aims at reducing the digital divide among enterprises. The “ICT in
SMEs” goal is revealed as the core policy goal of this strategy with 29% average investment of
the total ICT budget. Other goals are also relevant such as the ICT in rural areas (“ICT_Agri”),
which includes financial incentives to farmers and other enterprises, the Intelligent Energy
Distribution Systems (“SmartEnergy”), which are mainly developed by enterprises in the energy
sector, and digital infrastructures such as cloud computing (“ICT_Infr”). The fourth strategy is
mainly focused on the digital needs of the citizens. The main policy goal of this cluster is Digital
Inclusion (47%), which appears associated with investments in smart transportation
(“SmartTransp”).
11Strategy Policy goal Mean v test
Broadband 41% 7.56 ***
egov 8% -2.99 ***
1 - Broadband
eInclusion 10% -3.13 ***
PSI 2% -4.60 ***
eGov 25% 7.21 ***
eHealth 8% 5.92 ***
PSI 10% 5.42 ***
2 - Digital Broadband 19% -2.38 **
Government
ICT_Agri 0% -2.70 ***
SmartTransp 8% -2.84 ***
ICT_SMEs 6% -3.16 ***
ICT_SMEs 29% 6.37 ***
ICT_Agri 13% 5.13 ***
SmartEnergy 14% 3.42 ***
ICT_Infr 7% 3.09 ***
3 - ICT in SMEs Broadband 17% -2.06 **
eHealth 1% -2.83 ***
SmartTransp 6% -2.89 ***
eInclusion 4% -3.52 ***
egov 2% -4.06 ***
eInclusion 47% 7.58 ***
SmartTransp 21% 5.70 ***
eHealth 2% -2.26 **
4 - Digital ICT_Infr 0% -2.27 **
inclusion
ICT_SMEs 5% -2.49 **
PSI 1% -2.85 ***
Broadband 6% -4.65 ***
*** Significant at 1% level; ** Significant at 5% level;
Table 4 – Revealed strategies and ICT policy goals characterizing each strategy
In the following step, these “core” policy goals - “Broadband”, “eGov”, “ICT in SMEs” and
“eInclusion” - are used as dependent variables of the OLS models in order to explore the links
between funding allocations to these policy goals and the selected contextual variables.
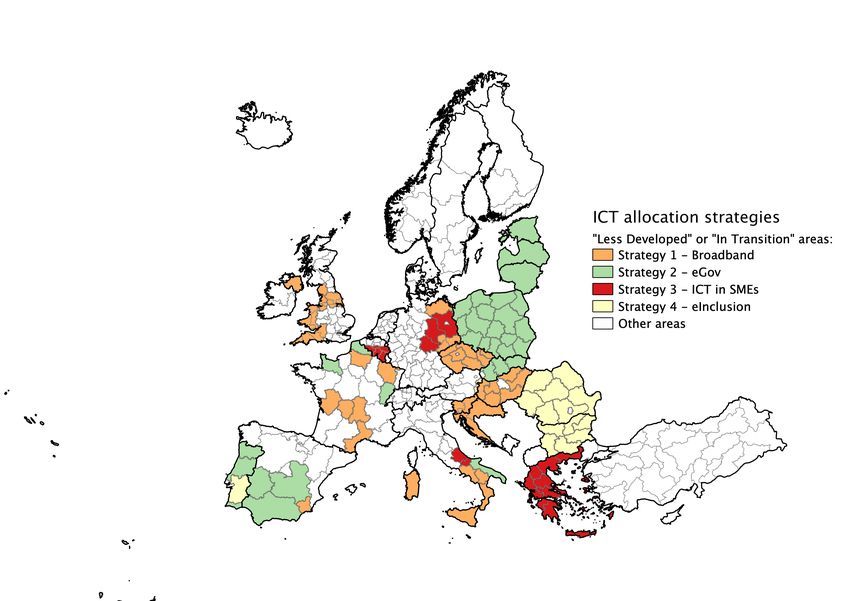
12Figure 1 - ICT strategies in "Less developed" or "In Transition" areas of the EU
Figure 1 provides a representation of which EU sub-national areas follows which strategic
approach. The first strategy - focused on the development of digital infrastructures - and the
second strategy - focused on the “eGov”, “eHealth” and “PSI” policy goals - are the two main
strategies in terms of number of EU regions (37 and 36, respectively) and population living in
those regions (80 million people and 80.5 million people). The third and the fourth strategies are
implemented in 18 and 17 regions, where 19 and 26 million individuals live, respectively.
The map shows a strong “country effect”, especially in Eastern Europe, where sub-national
governments in the same country share the same strategy. The same effect can be observed also
in the less developed areas of the UK and Belgium, while the remaining countries show some
regional variations.
4.3 Step 2 - Comparing funding allocations to “core” policy goals with the regional
context
As a second step of the analysis, we compare the funding allocations to the four core ICT policy
goals characterizing each strategy (dependent variables) with the different contextual conditions
(independent variables). The results of the OLS models are summarized in Table 5Error!
Reference source not found.6. A negative sign of the coefficients indicates a negative
relationship between each contextual factor and the financial allocations, which implies that
6
101 out of the 108 regions are included in the models due to the presence of missing values in the Eurostat data on
ICT context.
13investments seem to be focused on redressing existing imbalances or limitations. In the case of
the indicator “Individuals who have never used the Internet”, the opposite is true.
Broadband eGov ICT in SMEs eInclusion
[strategy 1] [strategy 2] [strategy 3] [strategy 4]
(1) (2) (3) (4) (5) (6) (7) (8)
ICT-specific context
Digital infrastructures:
Households with NGA -0.27 *** -0.30 *** -0.02 -0.03 -0.10 -0.10 0.39 *** 0.44 ***
broadband availability
Digital government:
Individuals who used the
-0.15 ** -0.15 *** -0.37 *** -0.49 *** 0.26 0.22 0.17 ** 0.44 **
Internet for interaction
with public authorities
Use of ICTs in
enterprises: Enterprises
sharing electronic -0.60 ** -0.83 *** 0.61 *** 0.32 -0.46 * -0.49 * -0.33 -0.08
information on the
supply chain
Digital divide among
citizens: Individuals who
-0.99 -0.94 -0.34 *** -0.37 ** 0.38 ** 0.40 ** 0.73 *** 0.59 ***
have never used the
Internet
Total ICT budget
0.013 0.024 ** 0.024 *** 0.041 *** -0.014 -0.012 -0.003 -0.001
(in million euros)
Socio-economic and
institutional environment
Quality of Government
0.33 ** 0.32 ** 0.05 -0.49 ***
Index
GDP per capita -0.54 -1.18 *** -0.45 0.33
Constant 80.01 *** 74.85 *** 2.217 ** 20.52 ** 8.134 7.105 -26.28 -14.85
Adjusted R-squared 0.35 0.37 0.26 0.36 0.18 0.16 0.22 0.27
Observations 101 101 101 101 101 101 101 101
*** Significant at 1% level; ** Significant at 5% level; * Significant at 10% level.
Table 5 - OLS models. Dependent variables: EU funding allocations to the four core ICT policy goals
characterizing each strategy
The effect of each ICT-specific contextual variable on the funding to the directly related ICT
“core” goal is highlighted in grey. The first strategy, characterized by the investments in
Broadband infrastructures, appears to be consistent with the local ICT context. The coefficient of
the “Digital infrastructures” context indicator is negative and highly significant. Therefore, these
investments seem to be aimed at filling regional gaps in terms of broadband access. In addition,
two other context indicators, namely digital government and use of ICT in enterprises, are
negatively correlated with funding allocations to broadband, showing that this kind of
investments tends to focus on the weakest regions in terms of overall Information Society
Development.
14The second strategy, represented here by the percentage of funding allocations to the “eGov”
policy goal, seems also to be consistent with the local ICT context in terms of digital government
take-up. Similar to what happens for the first strategy, policy makers appear to be willing to
allocate money to the digital government goal especially in those regions where digital
government services are less used compared to the other regions, as signaled by the negative
coefficient. Furthermore, the analysis shows that investments in digital government are
associated with relatively low levels of digital divide among citizens. This choice seems also to
be rationally conceived, given that the effect of policies towards a better use of public online
services is potentially higher if citizens are already familiar with Internet technologies.
This consistency of funding allocations with the ICT context is found also for the other two
strategies. A concentration of financial resources in the policy goal “ICT in SMEs” is associated
with relatively low levels of ICT use in the private sectors. Likewise, investments in “eInclusion”
are higher when the use of the Internet among citizens is lower. The fourth strategy seems to be
implemented in relatively more advanced local contexts, i.e. where the levels of digital
infrastructures and the diffusion of digital government are already high compared to the other
regions.
These results are confirmed when GDP and quality of government variables are introduced
(models 2, 4, 6, and 8). The effect of each ICT-specific contextual variable on the funding to the
related ICT “core” goal is always statistically significant, with the expected sign. In particular,
we find that the Quality of Government index had a positive influence on the financial
allocations to digital government and broadband infrastructures, while it had a negative effect on
digital inclusion investments. GDP per capita is statistically significant only in model 4,
negatively correlated with the dependent variable on digital government allocations.
5 Discussion and Implications
Based on these results, a few points should be discussed. In general, the results confirm the
importance of context for ICT policies. There is evidence that, indeed, strategic choices on
financial allocations to key aspects of Information Society development vary from place to place
and are influenced by several ICT contextual factors (Castelnovo & Sorrentino, 2018; Heeks,
2005). In particular, the first step of the analysis shows that the two prevailing strategies among
EU subnational governments are “Broadband” and “Digital Government”. The importance of the
Broadband strategy could be explained by considering the high installation costs of equipment
and cables, especially in the mountain and remote areas, compared to the other policy goals more
focused on software development (Ferguson, 2004). As for the “Digital Government” strategy, it
can be considered that local policy makers needed to give financial sustainability to interventions
that started in the past 2007-2013 period, when ICT technologies for the provision of public
digital services were the most funded topic (Pellegrin et al., 2018; Reggi & Scicchitano, 2012;
Reggi & Scicchitano, 2014). In addition, the cluster analysis highlights a “country effect” in the
distribution of these strategies in some countries, and in particular in Eastern Europe, i.e. the
lagging regions in the same country following the same strategy. This effect could be due to the
influence of country-level legislation and centralized institutional structure that guided the
decisions of regional-level policy makers in the use of EU funding, especially in those countries
where the authority of sub-national governments is weak (Dąbrowski, 2014).
15Through the second step of the analysis, we obtained two key results that are worth discussing.
The first result is that broadband connectivity is the focus of funding allocation in the less
developed regional ICT contexts, which provides evidence to the hypothesis that digital
infrastructures represent a strategic precondition for all other kinds of ICT interventions
(Fernández‐i‐Marín, 2011; Ferro et al., 2008; Melody, 1996). Broadband investments can be
seen, therefore, as a starting point for enabling subsequent actions in the field of ICT
development, such as strengthening the use of ICT applications or bridging existing digital
divides among users. We can conceptualize this evidence by considering the investments in
digital connectivity as “the first step” of Information Society development, followed by different
strategic choices based on the different characteristics of the local context.
The second key result is that the allocation of financial resources for the 2014-2020 EU
programming period seems to be consistent with the needs of local areas. This evidence suggests
that policy makers, at the time of the allocation decisions, might have been aware of the main
characteristics of regional contexts and the gaps to be addressed through the use of EU funding.
These results seem to diverge from what Reggi and Scicchitano (2014) found in the previous
2007-13 period. According to those findings, the preferred strategy in 2007-13 was to allocate
the funding to the aspects of Information Society for which the region already showed positive
results. Instead of aiming at redressing imbalances, policy makers seemed to focus on the
traditional strengths of regional ICT development, showing a form of path dependence on
previous policy choices (Pierson, 2000). It might not be a coincidence that some early evidence
questioned the overall effectiveness of these previous strategies (Kleibrink et al., 2015).
We can identify at least two discontinuity factors that might explain this change in the strategic
approach. First, legal requirements introduced in 2014 by the common EU regulation forced each
administration to develop a regional “digital growth strategy” that should be based on the
analysis of the local context. In particular, a policy ex ante conditionality “mandates that the
strategy needs to include information on budgeting and prioritisation actions, an analysis of
balancing support for demand and supply of ICT, indicators to measure progress and an
assessment of the need to reinforce capacity building in public administrations” (Stancova &
Sörvik, 2015, p. 6). This ex ante conditionality implies that access to the EU funding on ICT is
possible only if strategies with the required characteristics have been formally approved by the
Commission.
Second, in the current period a new set of tools is available for the analysis of local ICT context,
which allows for systematic comparison of regional performances in the different aspects of
Information Society development (Codagnone et al., 2015; Huggins, 2010; Rorissa et al., 2011).
The main example is the “Digital Scoreboard” tool, which includes a wide array of regional ICT
indicators comparing the digital performance of each regions with other regions in the same
country or in other countries. Additional supporting tools were made available by the
Commission, such as the “Digital Agenda Toolbox”, a set of guidelines and recommendations
for evidence-based analysis, which are also supported by field visits to the regional
administrations (Stancova & Sörvik, 2015).
The main policy implication is, therefore, that the current EU requirements for a sound analysis
of the ICT context may have worked well and should be considered in the next 2021-2027
programming period. The European Commission proposal for the new EU regulation - currently
in the process of negotiation with Member States and the other EU institutions - does include one
16“enabling condition” on the development of “Smart Specialisation Strategies” based on the “up-
to-date analysis of bottlenecks for innovation diffusion, including digitalisation”7. However, this
proposal does not require to develop the dedicated ICT strategies anymore. Current multi-level
interactions among EU, national and regional institutions should promote the development of
regional strategies that are context-aware and encompassing all available funding for ICT
development within different policy objectives. In addition, the use of web-based tools and
learning opportunities for policy makers about available data and analyses should be further
promoted, such as decision support tools (Petrović et al., 2014) or benchmarking tools (Reggi et
al., 2014).
6 Conclusions
This paper analyzes the programming phase of ICT policies from a novel perspective. First, it
considered funding allocation to specific policy goals as a crucial factor for the existence of
effective policies tackling the main components of the Information Society at the local level.
Second, based on a quantitative analysis of the planning phase of the 2014-2020 Structural and
Investment Funds in the EU lagging areas, the paper compared different types of ICT
interventions, providing a holistic view on the policy priorities of the national and local
governments, as well as some preliminary indications on the factors influencing them.
As a response to the first research question, the first step of the analysis identified four main ICT
strategies, each characterized by one or more policy goals. The first strategy is focused on
broadband infrastructures, the second on the use of ICTs in the public sector, the third on the
digitalization of SMEs, and the fourth on digital inclusion. The first two strategies are prevalent.
The second research question was addressed through the second step of the investigation. The
regression models systematically compared the financial allocations to four policy goals
characterizing each strategy with the regional context. The results indicate that, overall, current
ICT strategies in the context of the EU funding are consistent with the characteristics of the local
environments. Financial resources are concentrated in those ICT policy goals for which
contextual indicators suggest that there are significant territorial digital divides to be addressed.
In focusing on improving the weaknesses of their area, policy makers seem to have pursued
strategies aimed at balancing the different components of Information Society development. In
particular, investments in broadband infrastructures are concentrated in EU regions where all
ICT contextual characteristics are weaker compared to the other regions, indicating that digital
infrastructures are perceived as a precondition for the development of ICT applications.
Finally, the following lines of further research can be suggested based on the main limitations of
this paper. First, although ESIFs are the main source of investments in the European lagging
regions, they are not the only ones. For example, in several countries such as Portugal,
broadband development is also co-funded by the Connecting Europe Broadband Fund (European
Investment Bank, 2018). In addition, national and local ICT policies usually play a role. Further
research could also consider these different sources, as well as the interplay between EU policies
and existing policies at the national and regional level, in terms of potential complementarity or
7
COM/2018/375 final - 2018/0196 (COD) – Annex IV. Retrieved from https://eur-lex.europa.eu/legal-
content/EN/TXT/?uri=COM%3A2018%3A375%3AFIN. On the Smart Specialisation Strategies see for example
McCann and Ortega-Argilés (2015).
17overlap. This could affect not only the development of infrastructure, but also digital skills and
citizen use in different regions, which could also be the focus of future research.
Second, the comparison discussed here between the 2007-2013 and 2014-2020 periods could be
further investigated by carrying out a comprehensive analysis including financial allocations and
available context indicators for both periods. This unitary approach should improve
methodological comparability. Furthermore, this exercise could be replicated in the next 2021-
2027 programming period, as new allocation data are expected to be available by the end of
2022. A dynamic analysis considering the 3 periods could provide some insights on the possible
evolution of strategic patterns, including an in-depth exploration of results of the cluster analysis.
Third, a qualitative analysis conducted through interviews with policy makers could be helpful to
identify other relevant variables that affect the process of decision making on funding
allocations, such as federal and national policy constraints, values, anecdotal knowledge,
institutional rules and routines, and the input from public participation (Mele et al., 2014).
Finally, future research may concentrate on the impact of these investments on regional ICT
contexts, in terms of reducing existing digital divides in access and use of digital infrastructure.
For example, actual spending data can be retrieved from the same sources at the European
Commission as one of the determinants of the change in context indicators during the current
programming period.
Funding statement
This research did not receive any specific grant from funding agencies in the public, commercial,
or not-for-profit sectors.
References
Andreasson, K. J. (2015). Digital divides : the new challenges and opportunities of e-inclusion.
Boca Raton, FL: CRC Press.
Arduini, D., Denni, M., Lucchese, M., Nurra, A., & Zanfei, A. (2013). The role of technology,
organization and contextual factors in the development of e-Government services: An
empirical analysis on Italian Local Public Administrations. Structural Change and
Economic Dynamics, 27, 177-189.
Arendt, L. (2008). Barriers to ICT adoption in SMEs: how to bridge the digital divide? Journal
of Systems and Information Technology, 10(2), 93-108.
doi:doi:10.1108/13287260810897738
Belloc, F., Nicita, A., & Rossi, M. A. (2012). Whither policy design for broadband penetration?
Evidence from 30 OECD countries. Telecommunications Policy, 36(5), 382-398.
Castells, M. (2011). The rise of the network society: The information age: Economy, society, and
culture (Vol. 1): John Wiley & Sons.
Castelnovo, W., & Sorrentino, M. (2018). The digital government imperative: a context-aware
perspective. Public management review, 20(5), 709-725.
doi:10.1080/14719037.2017.1305693
Charrad, M., Ghazzali, N., Boiteau, V., & Niknafs, A. (2012). NbClust Package: finding the
relevant number of clusters in a dataset. Journal of Statistical Software, 61(6), 1-36.
Codagnone, C., Misuraca, G., Savoldelli, A., & Lupiañez-Villanueva, F. (2015). Institutional
isomorphism, policy networks, and the analytical depreciation of measurement
18indicators: The case of the EU e-government benchmarking. Telecommunications Policy,
39(3–4), 305-319.
Cucciniello, M., Porumbescu, G. A., & Grimmelikhuijsen, S. (2017). 25 Years of Transparency
Research: Evidence and Future Directions. Public Administration Review, 77(1), 32-44.
Dąbrowski, M. (2014). EU cohesion policy, horizontal partnership and the patterns of sub-
national governance: Insights from Central and Eastern Europe. European Urban and
Regional Studies, 21(4), 364-383.
De Vries, H., Bekkers, V., & Tummers, L. (2016). Innovation in the public sector: A systematic
review and future research agenda. Public Administration, 94(1), 146-166.
Edmiston, K. D. (2003). State and local e-government: Prospects and challenges. The American
Review of Public Administration, 33(1), 20-45.
European Commission. (2010). A digital agenda for Europe, COM(2010)245 final Publications
Office of the European Union.
European Commission. (2020). Digital Economy and Society Index (DESI) 2020. Retrieved
from https://ec.europa.eu/digital-single-market/en/desi.
European Investment Bank. (2018). 2017 EFSI Report. Retrieved from
https://www.eib.org/attachments/strategies/efsi_2017_report_ep_council_en.pdf.
Ferguson, C. H. (2004). The broadband problem: Anatomy of a market failure and a policy
dilemma. Washington, D.C.: Brookings Institution Press.
Fernández‐i‐Marín, X. (2011). The Impact of e‐Government Promotion in Europe: Internet
Dependence and Critical Mass. Policy & Internet, 3(4), 1-29.
Ferro, E., Gil-Garcia, J. R., & Helbig, N. (2008). Digital Divide and Broadband Access in an
Italian Region. In Y. K. Dwivedi, A. Papazafeiropoulou, & J. Choudrie (Eds.), Handbook
of research on global diffusion of broadband data transmission (pp. 160-176): IGI
Global.
Ferro, E., Helbig, N. C., & Gil-Garcia, J. R. (2011). The role of IT literacy in defining digital
divide policy needs. Government Information Quarterly, 28(1), 3-10.
Ferro, E., & Sorrentino, M. (2010). Can intermunicipal collaboration help the diffusion of E-
Government in peripheral areas? Evidence from Italy. Government Information
Quarterly, 27(1), 17-25.
Foray, D. (2009). The new economics of technology policy. Northampton, MA: Edward Elgar
Publishing.
Fountain, J. E. (2001). Building the virtual state : information technology and institutional
change. Washington, D.C.: Brookings Institution Press.
Freeman, C. (1987). Technology, policy, and economic performance: lessons from Japan.
London: Printer Publishers.
Ganapati, S., & Reddick, C. G. (2014). The Use of ICT for Open Government in U. S.
Municipalities. Public Performance & Management Review, 37(3), 365-387.
Gascó, M. (2005). Exploring the e-government gap in South America. International Journal of
Public Administration, 28(7-8), 683-701.
Gil-Garcia, J. R. (2012). Enacting electronic government success: An integrative study of
government-wide websites, organizational capabilities, and institutions (Vol. 31):
Springer Science & Business Media.
Gil-Garcia, J. R., Helbig, N. C., & Ferro, E. (2013). Understanding the multi-dimensionality of
the digital divide: Empirical evidence from Italy. In P. M. A. Baker, J. Hanson, & J.
19You can also read