Adverse scenario for the European Securities and Markets Authority's money market fund stress-testing guidelines in 2020
←
→
Page content transcription
If your browser does not render page correctly, please read the page content below
24 September 2020
ECB-PUBLIC

    Adverse scenario for the European Securities and Markets
    Authority’s money market fund stress-testing guidelines in
                              2020

Introduction
The European Supervisory Authorities, in cooperation with the European Systemic Risk Board
(ESRB), are required by legislation to conduct stress tests to assess the resilience of financial
institutions or market participants to adverse market developments. As part of this cooperation,
the ESRB designs scenarios of adverse economic and financial market developments.
In this document the ESRB describes the adverse financial market scenario for the stress-
testing exercise planned by the European Securities and Markets Authority (ESMA).
Specifically, ESMA has developed guidelines for managers of money market funds (MMFs)
who are required to conduct internal stress tests and report the results to the competent
authorities and ESMA. 1 On 27 August 2020, ESMA announced that the 2019 stress test
guidelines will continue to apply until the 2020 guidelines have been published. To this end, the
European Central Bank (ECB), in collaboration with the ESRB and ESMA, has updated the
calibration of stress parameters for the 2020 ESMA MMF guidelines. 2 These were approved by
the ESRB General Board on 24 September 2020 and transmitted to ESMA.
Assumptions about redemptions and additional guidance on applying the scenario, which are
needed for ESMA’s MMF stress test, are provided by ESMA and presented in ESMA’s MMF
stress-testing guidelines.

1
       Article 28 of Regulation (EU) 2017/1131 of the European Parliament and of the Council of 14 June 2017 on money market
       funds (OJ L 169, 30.6.2017, p. 8) (the “MMF Regulation”) provides that ESMA will issue guidelines that establish common
       reference parameters of the stress test scenarios to be included in the stress tests that managers of MMFs are required to
       conduct.
2
       The scenario presented in this document is not a forecast. It should not be interpreted as either the ESRB’s expectations about
       future economic and financial developments or any unintended consequences of future monetary policy decisions. It constitutes
       a severe yet plausible hypothetical scenario.

                                                                                                                                   |1
Scenario methodology and calibration
This section discusses the calibration methodology and the main sources of risk that lead to
the adverse scenario, as well as the key features that ESMA considers relevant to the MMF
sectors. The calibration of the scenario has benefited from interactions with ESMA and from
discussions with ESRB member institutions.
Calibration methodology
The methodology for the scenario calibration is based on a non-parametric application of a
multivariate copula model, as used in previous stress tests such as those conducted under the
2019 ESMA MMF stress-testing guidelines. 3 The scenario is the outcome of several simulations
based on different triggers that reflect the main sources of financial stability risks, with a special
focus on corporate and government credit spreads, swap rates, foreign exchange shocks and
securitisations in the European Union and other advanced economies. The calibration sample
and probability of the triggering events have been set in close collaboration with ESMA to reflect
the main features of the scenario as motivated by the current risk landscape identified by the
ESRB General Board. More precisely, the sample period chosen for the calibration spans from
January 2004 4 to August 2020 and the probability of the triggering events is below 1% over the
horizon of one quarter. 5 The shocks reported should be interpreted as one-off, instantaneous
and permanent shifts in asset prices relative to their cut-off date levels as specified in ESMA’s
guidelines.
Scenario
The shocks in the tables below are calibrated to be severe, plausible and consistent with the
ECB’s projections of the baseline COVID-19 scenario, as well as being in line with the market
risk scenarios that were designed for the recently published COVID-19 Vulnerability Analysis. 6
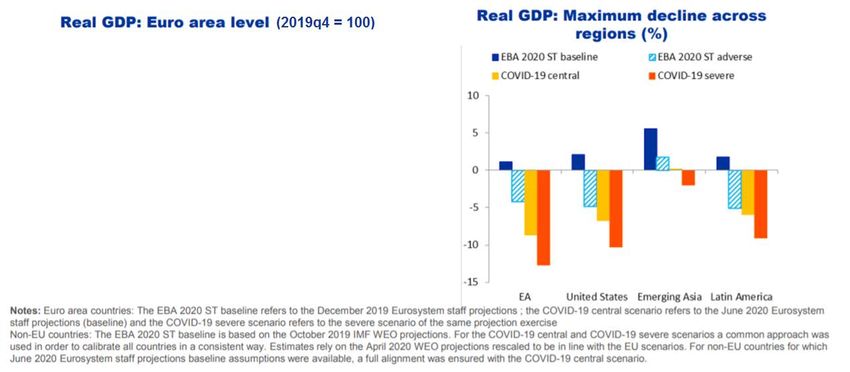
More specifically, under the baseline COVID-19 scenario, GDP in the euro area is projected to
fall by 8.7% in 2020 and to rebound by 5.2% in 2021 (see Chart 1). 7 Foreign exchange shocks
from the 2019 MMF scenario calibration have been confirmed and remain unchanged, as they
were already were in line with the COVID-19 Vulnerability Analysis scenarios. Other shocks
have been re-calibrated over the above-mentioned horizon, while targeting a relative level of
severity for the shocks that is commensurate with the “severe” scenario of the COVID-19
Vulnerability Analysis. Although equity prices are not used in the MMF scenario as such, this
3
See the “Technical note on the Financial Shock Simulator (FSS)”, ESRB, February 2019.
4
The model uses daily data and the majority of time series have sufficient data as of 2004.
5
All shocks are calibrated over the horizon of one quarter, except for shocks to bid-ask spreads for use as liquidity discount factors (see Table
A.5), which are calibrated over a horizon of five days.
6
See COVID-19 Vulnerability Analysis, ECB, July 2020 and Eurosystem staff macroeconomic projections for the euro area, ECB, June 2020
7
Note that the September 2020 ECB staff macroeconomic projections for the euro area project GDP to fall by 8.0% in 2020 and to rebound by
5.0% in 2021.
|2level of severity of the shocks is consistent with, on average, an equity price drop of -39% for
the euro area and -38% for the European Union.
Furthermore, the scenario calibration reflects important systemic risks identified by the ESRB
General Board, including (i) widespread defaults in the private sector due to a deep global
recession, (ii) a difficult macroeconomic environment for banks, insurers and pension schemes,
(iii) a re-emergence of sovereign financing risk and debt sustainability concerns, and (iv)
instability and pockets of illiquidity in financial markets. 8
Chart 1: Real GDP evolution
8
See Table 1 entitled “ESRB risk assessment as at 25 June 2020” in the ESRB’s Annual Report.
|3Annex A
Table A.1: Shocks to swap rates
Shocks to interest rate yields
Absolute changes (basis points)
Geographic Area Country Description 1M 3M 6M 1Y 2Y
EU Euro area Interest rate swap on the EUR (euro) 25 16 11 14 15
EU Bulgaria Interest rate swap on the BGN (Bulgarian lev) 25 16 11 14 15
EU Croatia Interest rate swap on the HRK (Croatian kuna) 25 16 11 14 15
EU Czech Republic Interest rate swap on the CZK (Czech koruna) 25 16 11 14 15
EU Denmark Interest rate swap on the DKK (Danish krone) 8 16 11 14 15
EU Hungary Interest rate swap on the HUF (Hungarian forint) 11 23 15 19 26
EU Poland Interest rate swap on the PLN (Polish zloty) 17 16 13 17 20
EU Romania Interest rate swap on the RON (Romanian leu) 24 47 30 40 47
EU Sweden Interest rate swap on the SEK (Swedish krona) 4 8 5 7 12
Rest of Europe United Kingdom Interest rate swap on the GBP (British pound) 15 30 19 26 28
Rest of Europe Iceland Interest rate swap on the ISK (Icelandic króna)
Rest of Europe Norway Interest rate swap on the NOK (Norwegian krone) 3 6 4 5 8
Rest of Europe Russia Interest rate swap on the RUB (Russian ruble) 19 38 24 32 40
Rest of Europe Switzerland Interest rate swap on the CHF (Swiss franc) 5 10 6 8 12
Rest of Europe Turkey Interest rate swap on the TRY (Turkish lira) 30 61 39 51 66
North America Canada Interest rate swap on the CAD (Canadian dollar) 7 14 9 12 15
North America United States Interest rate swap on the USD (US dollar) 14 29 19 24 27
Australia and Pacific Australia Interest rate swap on the AUD (Australian dollar) 5 10 7 9 13
Australia and Pacific New Zealand Interest rate swap on the NZD (New Zealand dollar)
South and Central America Brazil Interest rate swap on the BRL (Brazilian real)
South and Central America Chile Interest rate swap on the CLP (Chilean peso) 32 63 41 54 81
South and Central America Colombia Interest rate swap on the COP (Colombian peso) 25 50 32 42 59
South and Central America Mexico Interest rate swap on the MXN (Mexican peso) 38 76 49 64 78
Asia China Interest rate swap on the CNY (Chinese yuan) 2 4 3 3 4
Asia Hong Kong Interest rate swap on the HKD (Hong Kong dollar) 32 64 41 55 69
Asia India Interest rate swap on the INR (Indian rupee) 41 81 52 69 85
Asia Japan Interest rate swap on the JPY (Japanese yen) 1 3 2 2 4
Asia Korea Interest rate swap on the KRW (South Korean won) 21 41 27 35 45
Asia Malaysia Interest rate swap on the MYR (Malaysian ringgit) 14 28 18 23 33
Asia Singapore Interest rate swap on the SGD (Singapore dollar) 18 36 23 30 38
Asia Thailand Interest rate swap on the THB (Thai baht) 25 50 33 43 55
Africa South Africa Interest rate swap on the ZAR (South African rand) 1 3 2 3 5
Interest rate yield shocks
Absolute changes (basis points)
Geographic Area Country Description 1M 3M 6M 1Y 2Y
EU All countries Default value for countries not included above 17 16 13 17 20
Other Advanced Economies All countries Default value for countries not included above 12 8 8 10 13
Emerging Markets All countries Default value for countries not included above 45 29 29 38 50
Note: The grey cells indicate data are not available.
|4Table A.2: Shocks to government bond yields
Shocks to government bond yields
Absolute changes (basis points)
Geographic Area Country 3M 6M 1Y 2Y
EU Austria 63 71 93 112
EU Belgium 56 62 82 98
EU Bulgaria 70 77 102 123
EU Croatia 70 77 102 123
EU Cyprus 121 135 178 214
EU Czech Republic 154 164 216 258
EU Denmark 64 71 93 112
EU Finland 60 67 88 106
EU France 51 57 75 90
EU Germany 35 39 51 62
EU Greece 66 73 97 116
EU Hungary 121 125 164 200
EU Ireland 71 79 104 125
EU Italy 146 165 220 266
EU Latvia 48 53 70 84
EU Lithuania 64 71 93 112
EU Luxembourg 35 39 51 62
EU Malta 72 80 106 127
EU Netherlands 36 40 53 64
EU Poland 115 125 164 201
EU Portugal 76 85 111 134
EU Romania 97 86 114 135
EU Slovakia 87 98 128 154
EU Slovenia 48 54 71 85
EU Spain 89 99 131 157
EU Sweden 64 68 90 111
EA (weighted average) EA (weighted average) 66 74 98 117
EU (weighted average) EU (weighted average) 70 77 102 123
Advanced economies United Kingdom 54 46 61 71
Advanced economies Switzerland 28 35 45 58
Advanced economies Norway 37 39 51 64
Advanced economies Iceland 46 47 62 77
Advanced economies Liechtenstein 26 36 48 59
Advanced economies United States 76 72 94 111
Advanced economies Japan 141 157 206 248
Advanced economies Advanced economies non-EU and non-US 46 47 62 77
Advanced economies Advanced economies (weighted average) 54 118 155 158
Emerging markets Emerging markets 337 379 505 517
World World 195 248 330 333
Note: The weighted averages are based on real GDP and some missing values have been interpolated. “Advanced
economies non-EU and non-US” refer to all other advanced economies (as defined by the IMF).
|5Table A.3: Shocks to foreign exchange rates (EUR appreciation against USD)
Shocks to FX (appreciation of the EUR against the USD)
Relative changes (%)
Geographic Area Description Exchange rate name Shock
EU BGNUSD represents 1 BGN (Bulgarian lev) per x USD BGNUSD 25.4
EU EURCZK represents 1 EUR per x CZK (Czech koruna) EURCZK -2.2
EU EURHRK represents 1 EUR per x HRK (Croatian kune) EURHRK 0.1
EU EURHUF represents 1 EUR per x HUF (Hungarian forints) EURHUF -5.2
EU USDNOK represents 1 USD per x NOK (Norwegian krone) USDNOK -23.2
EU EURPLN represents 1 EUR per x PLN (Polish zloty) EURPLN -1.5
EU EURRON represents 1 EUR per x RON (Romanian leu ) EURRON 0.0
EU EURRSD represents 1 EUR per x RSD (Serbian dinar ) EURRSD -1.9
EU USDSEK represents 1 USD per x SEK (Swedish krona) USDSEK -25.4
Rest of Europe EURGBP represents 1 EUR per x GBP (British pound) EURGBP 11.1
Rest of Europe EURCHF represents 1 EUR per x CHF (Swiss franc) EURCHF 3.7
Rest of Europe EURRUB represents 1 EUR per x RUB (Russian ruble) EURRUB 10.1
Rest of Europe EURTRY represents 1 EUR per x TRY (Turkish lira) EURTRY 13.5
North America USDCAD represents 1 USD per x CAD (Canadian dollar) USDCAD -13.0
North America EURUSD represents 1 EUR per x USD (US dollar) EURUSD 25.4
Australia and Pacific AUDUSD represents 1 AUD per x USD (Australian dollar) AUDUSD 17.5
Australia and Pacific NZDUSD represents 1 NZD per x USD (New Zealand dollar) NZDUSD 18.0
South and Central America USDARS represents 1 USD per x ARS (Argentine peso) USDARS -0.8
South and Central America USDBRL represents 1 USD per x BRL (Brazilian real) USDBRL -12.2
South and Central America USDMXN represents 1 USD per x MXN (Mexican peso) USDMXN -7.9
Asia USDCNY represents 1 USD per x CNY (Chinese yuan renminbi) USDCNY -0.7
Asia USDHKD represents 1 USD per x HKD (Hong Kong dollar) USDHKD -0.1
Asia USDINR represents 1 USD per x INR (Indian rupee) USDINR -2.5
Asia USDJPY represents 1 USD per x JPY (Japanese yen) USDJPY -8.7
Asia USDKRW represents 1 USD per x KRW (South korean won) USDKRW -2.1
Asia USDMYR represents 1 USD per x MYR (Malaysian ringgit) USDMYR -2.3
Asia USDSGD represents 1 USD per x SGD (Singapore dollar) USDSGD -10.4
Asia USDTHB represents 1 USD per x THB (Thai baht) USDTHB -2.3
Asia USDTWD represents 1 USD per x TWD (New Taiwan dollar) USDTWD
Africa USDZAR represents 1 USD per x ZAR (South African rand) USDZAR -14.0
Note: The grey cells indicate data are not available. A positive figure indicates an appreciation of the first currency
against the second.
|6Table A.4: Shocks to foreign exchange rates (EUR depreciation against USD)
FX shocks (depreciation of the EUR against the USD)
Relative changes (%)
Geographic Area Description Exchange rate name Shock
EU BGNUSD represents 1 BGN (Bulgarian lev) per x USD BGNUSD -17.0
EU EURCZK represents 1 EUR per x CZK (Czech koruna) EURCZK 2.4
EU EURHRK represents 1 EUR per x HRK (Croatian kune) EURHRK -0.4
EU EURHUF represents 1 EUR per x HUF (Hungarian forints) EURHUF 4.0
EU USDNOK represents 1 USD per x NOK (Norwegian krone) USDNOK 17.7
EU EURPLN represents 1 EUR per x PLN (Polish zloty) EURPLN 3.6
EU EURRON represents 1 EUR per x RON (Romanian leu ) EURRON 0.8
EU EURRSD represents 1 EUR per x RSD (Serbian dinar ) EURRSD -1.5
EU USDSEK represents 1 USD per x SEK (Swedish krona) USDSEK 18.4
Rest of Europe EURGBP represents 1 EUR per x GBP (British pound) EURGBP -6.5
Rest of Europe EURCHF represents 1 EUR per x CHF (Swiss franc) EURCHF -3.6
Rest of Europe EURRUB represents 1 EUR per x RUB (Russian ruble) EURRUB -9.6
Rest of Europe EURTRY represents 1 EUR per x TRY (Turkish lira) EURTRY -5.5
North America USDCAD represents 1 USD per x CAD (Canadian dollar) USDCAD 8.9
North America EURUSD represents 1 EUR per x USD (US dollar) EURUSD -17.0
Australia and Pacific AUDUSD represents 1 AUD per x USD (Australian dollar) AUDUSD -13.3
Australia and Pacific NZDUSD represents 1 NZD per x USD (New Zealand dollar) NZDUSD -13.6
South and Central America USDARS represents 1 USD per x ARS (Argentine peso) USDARS 1.3
South and Central America USDBRL represents 1 USD per x BRL (Brazilian real) USDBRL 9.1
South and Central America USDMXN represents 1 USD per x MXN (Mexican peso) USDMXN 7.1
Asia USDCNY represents 1 USD per x CNY (Chinese yuan renminbi) USDCNY 0.4
Asia USDHKD represents 1 USD per x HKD (Hong Kong dollar) USDHKD 0.1
Asia USDINR represents 1 USD per x INR (Indian rupee) USDINR 2.3
Asia USDJPY represents 1 USD per x JPY (Japanese yen) USDJPY 4.5
Asia USDKRW represents 1 USD per x KRW (South korean won) USDKRW 3.0
Asia USDMYR represents 1 USD per x MYR (Malaysian ringgit) USDMYR 1.5
Asia USDSGD represents 1 USD per x SGD (Singapore dollar) USDSGD 6.1
Asia USDTHB represents 1 USD per x THB (Thai baht) USDTHB 1.6
Asia USDTWD represents 1 USD per x TWD (New Taiwan dollar) USDTWD
Africa USDZAR represents 1 USD per x ZAR (South African rand) USDZAR 14.4
Note: The grey cells indicate data are not available. A positive figure indicates an appreciation of the first currency
against the second.
|7Table A.5: Shocks to bid-ask spreads
Shocks to bid-ask prices of government bonds
Absolute changes (euro)
3M 6M 1Y 2Y
DE 0.09 0.10 0.32 0.50
ES 0.61 0.97 1.59 1.59
FR 0.13 0.21 0.57 0.80
IT 0.91 1.35 1.14 1.41
NL 0.10 0.11 0.32 0.50
Other 0.37 0.55 0.79 0.93
Note: Bid-ask shocks are calibrated over a five-day horizon.
Table A.6: Shocks to RMBS (and other Asset-backed securities)
Shocks to Residential Mortgage Backed Securities
Absolute changes (bps)
Geographic Area AAA AA A BBB
European Union 240 270 278 278
North America 272 325 320 320
Asia 235 277 288 288
All 271 326 338 338
|8Table A.7: Shocks to credit spreads (corporate)
Shocks to general corporate credit yields [1-3 years]
Absolute changes (basis points)
Financial
Non-financial Financial All
covered
AAA 187 209 231 209
AA 195 235 275 235
A 249 285 321 285
BBB 307 358 410 359
BB 334 395 447 392
B 360 432 514 435You can also read


