AN ANALYSIS OF SPLIT ROLL PROPERTY TAX ISSUES AND IMPACTS - March 2012
←
→
Page content transcription
If your browser does not render page correctly, please read the page content below
AN ANALYSIS OF SPLIT ROLL PROPERTY TAX
         ISSUES AND IMPACTS

                 March 2012

                                   i
(This page left intentionally blank)

                                       ii
Executive Summary
Despite dramatic increases in state revenues over the past decade, even greater spending increases,
coupled with the nation’s recent economic collapse and weak recovery, have left the state of California
with a budget deficit estimated at between $10 and $20 billion. Advocates for closing the gap through
tax increases have introduced a series of proposals for new ways to increase state revenues. One
proposal that has received significant discussion periodically over the past several decades, and is again
being discussed, is the elimination of the caps on property tax increases for businesses included in
Proposition 13, which is often referred to as the “split roll” proposal.
This study was undertaken to review the split roll proposal and to assess the prospective impact on the
state economy if a split roll tax regime were adopted. Our analysis has four significant findings:
1. A split roll property tax regime will increase property taxes on businesses by an estimated $6
billion. Given the recent volatility of real estate markets, however, this tax increase could range
from as little as $4 billion to as much as $10 billion dollars.
2. Increasing the taxes of businesses by $6 billion dollars would result in lost economic output and
decreased employment. The cost to the California economy of this property tax increase would
total $71.8 billion dollars of lost output and 396,345 lost jobs over the first five years of a split
roll property tax regime. These losses would be even greater in succeeding years.
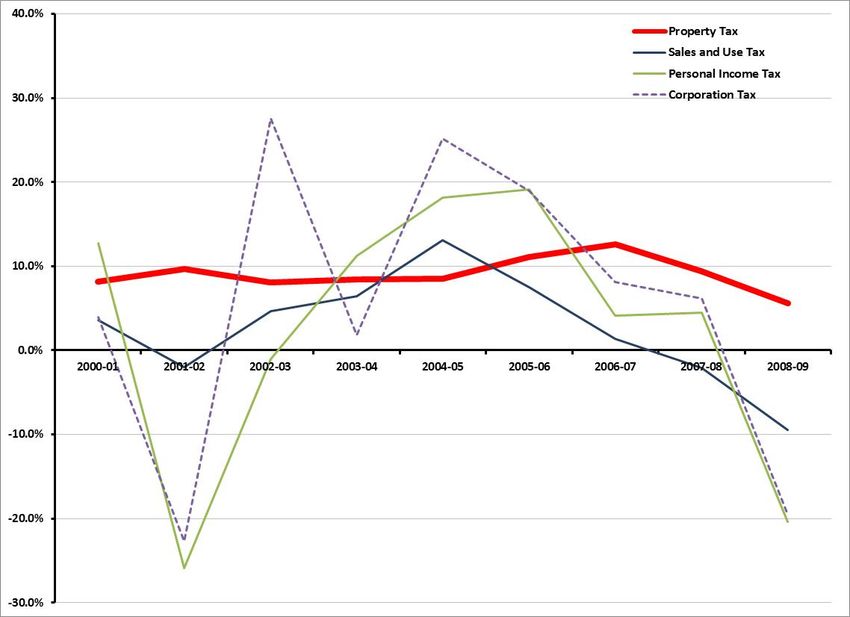
3. The introduction of a split roll property tax valuation system would result in increased instability
for local government finances, as they would become more directly susceptible to the value
gyrations of the real estate market. For example, in 2008‐09 when California property values
faced the traumatic decline in the wake of the sub‐prime crisis and the market collapse
(industrial and commercial values fell 6.5 percent), property taxes collected from these same
properties actually rose 5.0 percent.
4. A split roll property tax valuation system would also further undermine the attractiveness of the
business climate in California. Because small businesses typically lease properties where the cost
of property taxes is passed through to the lessee, this research concludes that the employment
losses described above would be disproportionately concentrated in small businesses, and
especially those owned by women and minorities.
Overall, this study finds that a split roll property tax regime would have a significant and detrimental
impact on the state’s economy, especially at a time when the California economy is struggling.
iii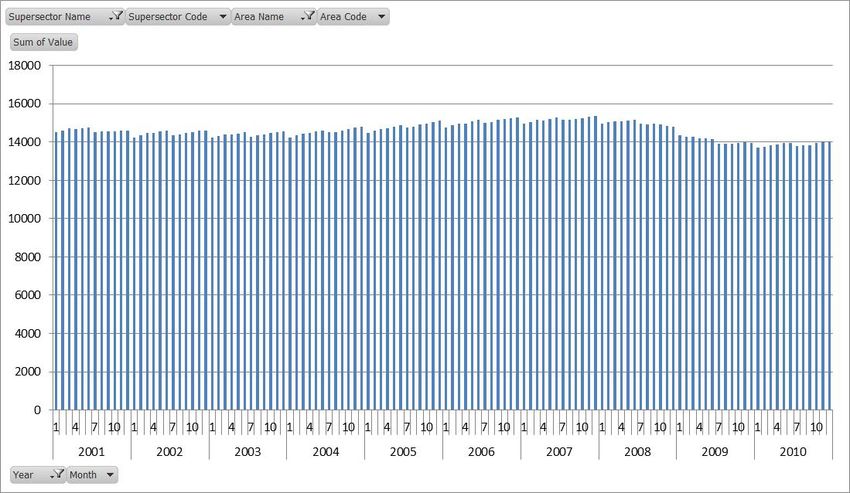
Preface

This report is one in an ongoing series of periodic analyses of public policy issues by the Davenport
Institute. Financial support for this report was provided, in part, by the Small Business Action
Committee. The opinions, discussion and analysis contained in this report of those of the authors alone
and do not necessarily reflect the views of Pepperdine University, the School of Public Policy, the
Davenport Institute or those who have provided support, financial or otherwise, for this research.

Steven B. Frates
Michael A. Shires

Malibu, California

March 2012

                                                                                                     iv
Table of Contents

Executive Summary ................................................................................................................ iii
Preface ................................................................................................................................... iv
Table of Contents .................................................................................................................... v
Chapter 1: Introduction and Context of this Analysis ............................................................... 1
   What Form Would a Split Roll Property Valuation System in California Take? .................................. 3

Chapter 2: The Economic Implications of a Split Roll Property Tax........................................... 4
   Modeling the Economic Impact of the Split Roll in California ............................................................ 6
   Estimating the Changes in Revenues as a Result of the Split Roll ...................................................... 6
   Estimating the Economic and Employment Impacts of the Split Roll ............................................... 10
     Who Pays the Increased Taxes Affects the Magnitude and Distribution of the Economic Impact of
     the Split Roll Tax Increase ................................................................................................................... 11
     Modeling Accounts for Multiple Economic and Employment Effects ................................................ 12
   The Economic and Employment Effects of the Split Roll ................................................................. 13
   Sensitivity Scenarios....................................................................................................................... 14
     Margin Between Assessed and Market Valuation at Time of Implementation.................................. 15
     Property Value Growth Rates ............................................................................................................. 16
     Distribution of New Property Tax Burden By Sector .......................................................................... 17
     Overview of Sensitivity to Assumptions ............................................................................................. 19
   Implications of Using Alternative Split Roll Regimes ....................................................................... 21
     Increasing the One Percent Rate on Commercial and Industrial Properties ...................................... 21
     Changing the Assessed Valuation Growth Cap ................................................................................... 22

Chapter 3: How Is Business Impacted by the Imposition of the Split Roll? ............................. 23
   Economy‐wide Macroeconomic Effects of the Split Roll.................................................................. 24
     Price Effects on Properties .................................................................................................................. 24
     Increasing Volatility ............................................................................................................................. 25
     Business Climate Effects and the Effect on New Business.................................................................. 27
   Business‐level or Microeconomic Effects of the Split Roll ............................................................... 28
     Effects on Businesses that Own Their Properties ............................................................................... 28
     Effects of the Split Roll on Businesses That Engage in Leasing ........................................................... 31
   What Firms Will Be Affected the Most? .......................................................................................... 31

                                                                                                                                                         v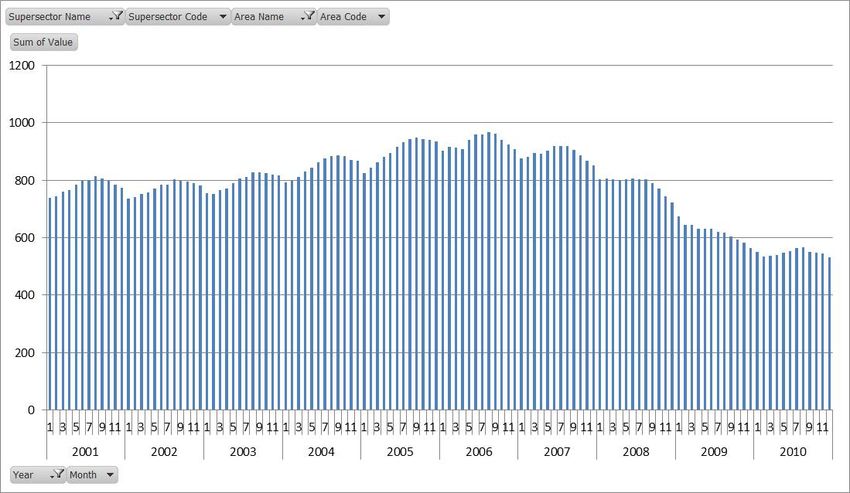
(This page left intentionally blank)

                                       vi
Chapter 1: Introduction and Context of this Analysis
1Proposition 13, passed overwhelmingly by the voters of California in 1978, placed limits on how much
property taxes could be increased from one year to the next. Initially, all property tax assessments in the
state were to be “rolled back” to a base year of 1978, and could only be increased a maximum of two
percent per year. Properties that were sold after the base year of 1978 would be reassessed based on
the sale price, but any subsequent property tax increases for such properties would still be held to a
maximum annual two percent increase. By enacting Proposition 13, California voters created a taxation
system where, in a continuously rising real estate market (one which rose more than 2 percent per
year), property owners who acquired their properties in more recent years would pay a higher property
tax than property owners who had purchased it in prior years, even in the preceding year.
This provision of Proposition 13 capped the potential growth of property taxes for existing owners at
two percent, creating desired stability and predictability for property taxpayers. It also created a new
landscape where, in California’s rising real estate market, neighboring property owners could pay
dramatically different amounts of property taxes on comparable parcels. While these differences can
develop in as little as one year, they are most pronounced in intervals when the market has had time to
rise to very high levels, and thus the greatest differences are for properties which have been held for
significant periods of time.
Various attempts to erode or eliminate the property tax increase protections provided by Proposition 13
have been put forth over the years, but none has been successful in persuading the citizens of California
to return to a tax regime of unlimited annual property tax increases. Advocates of the proposed split roll
property tax regime tacitly acknowledge the fact that the property tax increase protections in
Proposition 13 are overwhelmingly popular with California homeowners and voters. Despite this
popularity, advocates continue to seek ways to increase government revenues from the property tax.
In this quest, some of these advocates have pushed periodically for a change in the way that
properties—and especially commercial and industrial properties‐‐are assessed in the state.
In recognition of this reality, advocates argue for creating a “split roll” property valuation system in
California wherein residential properties would retain the current Proposition 13 limitations on the
growth of assessed values while commercial and industrial properties would be assessed at current fair
market value. This allows these advocates to avoid what is commonly regarded as the “third rail” of
California politics—the sanctity of the benefits that Proposition 13 has afforded homeowners in the 33
years since its passage in 1978.
Because under Proposition 13, the point of property value readjustment to market value is set at the
point of acquisition by a property owner, many properties today have assessed values that lie below
their actual market values—even in today’s depressed real estate market. As a result, setting the
property valuation to fair market value for assessment purposes would increase property tax revenues.
The prospect of another split roll property assessment proposal was raised last year by the California Tax
Reform Association (CTRA) in its report entitled System Failure: California’s Loophole‐Ridden Commercial
Property Tax, (dated May 2010). In that analysis, advocates call for a new property tax reform initiative
that would impose a split roll assessment system that targets raising commercial property valuations to
2fair market value. The purpose of this study is to examine the economic impacts of the model proposed
by the CTRA, both in its simplest form and, given today’s highly uncertain fiscal environment, under a
range of alternate scenarios.
What Form Would a Split Roll Property Valuation System in California Take?
The “split” in split roll comes from the idea of separating residential properties from commercial and
industrial properties with a view toward handling the latter differently while preserving the current
assessment practices for residential properties. Some split roll advocates include residential rental
properties as businesses and other split roll advocates place residential rental properties in the
residential category. In this analysis residential rental properties will be handled consistently as
residential properties because the most recent proposals focus on insulating both homeowners and
renters from the effects of splitting the roll, although the implications of this decision will be addressed
later. It is important to understand that the issues raised about commercial and industrial properties
introduced in the split roll property tax debate apply equally to residential properties.
There are two general approaches to instituting a split roll tax system in California. One approach
changes the rate at which property taxes are assessed on commercial and industrial properties, while
the other changes the valuation of these properties for assessment purposes. Since the property tax
assessed and collected is the product of these two variables (see Equation 1.1), changing either in the
ways proposed would result in these property owners paying higher property taxes.
1.1
Some proposals include an intermediate approach whereby the acquisition value approach is modified
to allow the assessed valuation to appreciate at a faster rate than the two percent cap introduced in
Proposition 13. One proposal offered, for example, to double this rate to four percent. The net effect of
this approach is to bring the assessed value closer to the market value while still preserving the
simplicity and predictability of the Proposition 13 mechanism. The market value approach most
commonly proposed is the same as removing the cap entirely and allowing assessed values to vary with
the market value.
This analysis will focus on the approach most recently proposed by split roll advocates to change the
assessment of commercial and industrial properties from the current acquisition value approach to a full
market value approach.
3Chapter 2: The Economic Implications of a Split Roll Property Tax
4This chapter analyzes the economic impact of instituting a split roll property tax regime in California. The
California economy is currently in a state of flux, reflecting its status as one of the epicenters of the
recent collapse of the US economy triggered by the collapse of housing bubble. Figure 2‐1 below shows
the non‐farm employment in California from 2000 to 2010. Over this period, non‐farm employment in
California actually decreased from 14,598,000 in 2001 to 13,750,200 in 20210. There was an increase in
non‐farm employment in the middle of the decade, peaking at 15,047,900 in 2007, followed by a
gradual decline in 2008 and then much more rapid declines in 2009 and 2010.
Figure 2‐1. This California Nonfarm Employment,
2001 – 2010
Employment
Year (000s) Annual Growth
2001 14,598.0 3.0%
2002 14,328.0 ‐1.8%
2003 14,302.1 ‐0.2%
2004 14,328.5 0.2%
2005 14,571.6 1.7%
2006 14,885.2 2.2%
2007 15,047.9 1.1%
2008 15,031.4 ‐0.1%
2009 14,281.4 ‐5.0%
2010 13,750.2 ‐3.7%
SOURCE: Bureau of Labor Statistics, US Census,
Current Employment Statistics, various years.
The most recent study to estimate the employment effects of a split roll proposal was prepared in 2008
by former California Legislative Analyst William Hamm and Dr. Jose Alberro. In their analysis, which was
built on the Dynamic Revenue Assessment Model (DRAM), they found an anticipated decline of some
5152,400 jobs and a decline in net private investment totaling $2.0 billion. This model, built by the
University of California, Berkeley, in conjunction with the California Department of Finance, estimates
interactions in the economy over an estimated 3‐5 year period in order to understand the future
impacts of changes not only in one sector, but iteratively over time. The impact of losing these jobs will
be defined in part by which jobs they represent. If they are low‐skill, low‐wage jobs, then the overall
economic impact is less substantial. But if they are like the $120,000 plus per year positions that eBay
has announced it is moving to Austin, TX, then the implications are much more dire. Using GDP per job
as a crude measure, these 152,400 positions could account for more than $21 billion dollars of Gross
State Product.
Modeling the Economic Impact of the Split Roll in California
For the purposes of this analysis, the team developed a more comprehensive and current model that
uses the detailed characteristics of the California economy to estimate the year‐to‐year impacts of the
split roll. Computable General Equilibrium (CGE) models, such as the DRAM, are excellent tools for
estimating the impacts of a single change in the economy, but they are more problematic for policy
interventions that require changes to multiple inputs and components of the model. Since there are
multiple effects that must be modeled for the split roll, it was therefore decided to use a modeling
approach that will allow the property tax streams to change appropriately over time. The specifics of
that approach are presented below.
In the case of the split roll, there are two policy effects that must be modeled: (1) the overall economic
impact of the abrupt increase in property taxes in the first year as the assessed values are brought up to
fair market values; and (2) the impact of the incremental annual marginal increase in property tax
revenues that will arise as the taxable base rises more rapidly than it would have without the property
tax change. With these two streams computed, this analysis then uses the IMPLAN Economic Modeling
system (a highly regarded and widely used commercial economic impact modeling system) to estimate
their impacts on both overall economic output and on employment. The next two sections will describe
the issues involved in estimating each this study’s approach.
Estimating the Changes in Revenues as a Result of the Split Roll
It is difficult to estimate the changes in the California real estate market over the next decade, or even
the next year. Accordingly, this analysis will provide an estimate of the direction, order of magnitude
and scale of the changes brought on by the introduction of the split roll. Sensitivity analysis will be used
to bound these estimates.
As the table below shows, there has been a marked difference between the growth rates in the total
assessed values and the total market values in California’s assessment base. As discussed in the
previous section, there are three components to annual changes included in these numbers: (1) new
construction, (2) turnover in ownership; and (3) different growth rates (largely the limitations imposed
by the cap on annual assessed value under Proposition 13). The first two items are controlled for by
inclusion of the same values for these properties in both data sets at both the point of new construction
and the point of sale. Thus the changes in growth rates are driven by the differences in the annual
changes in the two sets of valuations.
6Figure 2‐2. Estimated Assessed and Market Values and Growth Rates for Commercial and
Industrial Properties in California, 2001 ‐ 2009
Assessed Market Value
Total Assessed Total Market Value Annual Annual
Year Value (000s) Value (000s) Growth Growth Rate
2001‐02 972,485,305 1,298,884,851 ‐‐‐ ‐‐‐
2002‐03 1,031,311,811 1,418,849,274 6.0% 9.2%
2003‐04 1,086,231,023 1,518,929,816 5.3% 7.1%
2004‐05 1,143,786,168 1,742,390,887 5.3% 14.7%
2005‐06 1,224,148,563 2,007,660,405 7.0% 15.2%
2006‐07 1,349,661,751 2,251,541,014 10.3% 12.1%
2007‐08 1,442,709,942 2,487,099,291 6.9% 10.5%
2008‐09 1,514,691,725 2,325,192,378 5.0% ‐6.5%
Average Annual Growth 6.5% 8.9%
SOURCE: California Board of Equalization, 4‐R Equalization Ratio Memos, selected years.
Clearly, today’s real estate and development markets are significantly different that those of the recent
past and pure averages therefore are consequently not the best estimators in the short term. In fact,
there have been declines in market values in 2008‐09, as seen in the table, and in preliminary data from
2009‐10.1 Furthermore, the implementation timeline for a split roll would likely not come until the year
2013 given the political and practical considerations associated with its passage. Consequently, the
model developed here estimates these two valuation streams into the future—focusing on the 5‐year
period 2012‐13 through 2016‐17. Estimates that include the nine‐year period through 2020‐21 are
sometimes provided for context and magnitude, and to show the ongoing‐direction of the trends
involved.
The table on the next page shows the estimated assessed and market values for commercial and
industrial property in California for the model period. These estimates represent a mid‐range scenario,
but alternative estimates are provided as well. The assessed valuation starts with the current valuations
and then is projected to rise at the historical average of 6.5 percent through 2012‐13.2 The market
valuation is calibrated to reflect the initial anticipated revenues from the split roll in the base scenario
(see below) for the year 2012‐13. Both series are then allowed to grow at one‐half the historic rates of
growth for the years from 2012‐13 through 2020‐21. This slower rate was included for three reasons:
(1) to reflect the possibility that California’s real estate market may recover more slowly over the next
decade; (2) the increased taxation on business and commercial properties is likely to place downward
pressure on these market values as the cost of holding the properties rises due to the property tax; and
1
Preliminary information from the State Board of Equalization prepared for the 4‐R Equalization Ratio Memos for
the May 2011 Board meeting, show a market valuation as low as $1,881 billion (a 19 percent decline from 2008‐
09) and assessed valuation growing to only $1,523 billion—a negligible 0.6 percent increase.
2
This allows the analysis to provide the highest level of assessed values under the Proposition 13 cap at the
beginning of the simulations.
7(3) to take a conservative approach in estimating the impacts associated with removing the Proposition
13 cap from the growth in taxable value. In the sensitivity analysis, this assumption will be revisited and
the historical averages will be used to provide an estimate of the impact of this limitation.
Figure 2‐3. Estimated Assessed and Market
Values for Commercial and Industrial
Properties in California, 2001 ‐ 2017
Assessed Value Market Value
Year ($billions) ($billions)
2001‐02 972.5 1,298.9
2002‐03 1,031.3 1,418.8
2003‐04 1,086.2 1,518.9
2004‐05 1,143.8 1,742.4
2005‐06 1,224.1 2,007.7
2006‐07 1,349.7 2,251.5
2007‐08 1,442.7 2,487.1
2008‐09 1,514.7 2,325.2
2009‐10 1,523.9 1,881.1
2010‐11 1,605.1 2,013.8
2011‐12 1,690.5 2,155.8
2012‐13 1,801.2 2,409.9
2013‐14 1,860.2 2,517.2
2014‐15 1,921.1 2,629.3
2015‐16 1,984.0 2,746.3
2016‐17 2,049.0 2,868.6
SOURCE: California Board of Equalization, 4‐R Equalization
Ratio Memos, through 2009‐10, research estimates
through 2016‐17.
Generally, the differences between these two columns of numbers in the shaded area represent the
economic impacts about which this analysis is concerned. There are two components to this change:
(1) the initial effects of implementing the split roll; and (2) the faster growth allowed in taxable value
when the Proposition 13 cap is removed.
The first component that needs to be identified is the immediate effect of instituting the split roll.
Supposing that the split roll was instituted in 2012‐13 in the table above, it would represent the entirety
of the difference between the assessed valuation under Proposition 13 (the first column) and the
market valuation given in column 2, or $608.7 billion. Using the general one percent assessment as the
measure, this would result in additional property taxes due from commercial and industrial property
owners totaling $6.087 billion. The amount of this impact is defined exclusively by the difference
between assessed value at the point of the implementation of the split roll and fair market value as
8assessed by the assessor. The most consistently developed series of these two measures for commercial
and industrial properties is the Board of Equalization’s estimates for the 4‐R Act Ratio that they prepare
to comply with federal requirements that railroad property be assessed at the same ratio as all other
business property. The table below presents the assessed and market values prepared for those
calculations for the last 8 years. If property owners were taxed at the market values listed, the fourth
column shows the resultant cumulative estimated increase in property taxes for those property owners
whose property was assessed below market value because of Proposition 13’s cap on the growth in
assessed value.
Figure 2‐4. Estimated Assessed and Market Values for Commercial and Industrial
Properties in California, 2001 ‐ 2009
Estimated Property
Total Assessed Total Market Tax Gain from Split
Year Value (000s) Value (000s) Roll (000s)
2001‐02 972,485,305 1,298,884,851 3,263,995
2002‐03 1,031,311,811 1,418,849,274 3,875,375
2003‐04 1,086,231,023 1,518,929,816 4,326,988
2004‐05 1,143,786,168 1,742,390,887 5,986,047
2005‐06 1,224,148,563 2,007,660,405 7,835,118
2006‐07 1,349,661,751 2,251,541,014 9,018,793
2007‐08 1,442,709,942 2,487,099,291 10,443,893
2008‐09 1,514,691,725 2,325,192,378 8,105,007
Average 2001‐02 to 2004‐05 4,363,101
Average 2005‐06 to 2008‐09 8,850,703
SOURCE: California Board of Equalization, 4‐R Equalization Ratio Memos, selected years.
Note that the table shows two clusters of valuations: from 2001‐02 through 2004‐05, with an average
gap of some $4.36 billion and 2005‐06, with an average gap of $8.85 billion. Since the net revenue is
probably less than the amount listed in the fourth column,3 this analysis centers its baseline scenario on
a net increase in property taxes totaling $6.0 billion—the rough midpoint between the two clusters. A
sensitivity analysis will also be presented below, wherein the values are set to the two averages. Note
that this amount is adjusted for inflation over time. To keep the analysis simple, the inflation factors
from the IMPLAN Economic Modeling system were used.4 The values listed in column D are equivalent
to $600 billion in constant 2011 dollars; when taxed at a 1% rate, this impact is equal to $6 billion in
additional property tax revenue.
3
The property tax is tax deductible, meaning that a rise in property taxes is partially offset by a decline in income
taxes. Additionally, there will be increased administrative costs.
4
See the section on Estimating the Economic and Employment Impacts of the Split Roll for a table containing these
inflation factors.
9Figure 2‐5. Estimated Assessed and Market Values for Commercial and Industrial
Properties in California, 2011 – 2017 (in billions of dollars)
A B C D E F
Total
Split Effect Effect of Taxable
Assessed Market with Removing Valuation
Year Value Value Inflation Cap Increase
2012‐13 1,801.2 2,409.9 608.7 0.0 608.7
2013‐14 1,860.2 2,517.2 618.4 38.6 657.0
2014‐15 1,921.1 2,629.3 629.0 79.1 708.2
2015‐16 1,984.0 2,746.3 640.6 121.7 762.3
2016‐17 2,049.0 2,868.6 653.1 166.5 819.6
Column E contains the estimate of the second piece of the equation for the marginal impact of a split tax
roll. Just as the current market values are higher than assessed values allowed under Proposition 13 for
many properties, each year into the future that the growth in market values exceed the allowable
growth under Proposition 13,5 the taxpayer must pay more in property taxes. Note how column E
grows over time,6 demonstrating how Proposition 13 benefits taxpayers by slowing the growth of
assessed valuation. Removing this constraint results in an expanding pool of new property tax
revenues—which in turn will suppress an increasing quantity of economic activity and jobs
Estimating the Economic and Employment Impacts of the Split Roll
With the amounts in Column F in the above table, we can now turn to question of the economic and
employment consequences of taking this much money out of the local economy. To perform these
estimates, the research team used the California statewide model from IMPLAN®.7 The models were
built using data calibrated to the 2009 year and built on an industry‐level basis.8 IMPLAN is an input‐
output oriented modeling system. It breaks the economy down in to approximately 400 sectors and
uses extensive input‐out coefficient matrices and tables to iteratively estimate the dynamic effects of
5
Note that this comparison assumes that properties will appreciate at one‐half historical rates. If the current
downturn in property values were to continue indefinitely, this column would be less and could approach $0. Note
also that the yield of splitting the tax roll (one percent of the amount in column D) would also decline. In the
extreme case, a prolonged recession with continued, sustained, and long‐term declines could eventually render
the debate split roll property tax regime moot as full market values could decline below assessed values. At that
point, the net yield to the public finance system of the proposed split roll would be $0 since the two would be
equal as properties were reassessed downward to FMV.
6
The rate at which properties will appreciate is also a dimension addressed in the sensitivity analysis at the end of
this section.
7
Minnesota IMPLAN Group, IMPLAN Economic Modeling system, 2011, proprietary data,
http://implan.com/V4/Index.php, accessed May 27, 2011.
8
Given the major shifts in the California economy over the past several years, the use of the 2009 structural
matrices is critical to producing appropriate estimates.
10policy interventions on the economy. The model computes in both real and nominal dollars. To simplify
comparisons with other budget estimates, the values and tax flows identified in this analysis are
reported in nominal dollars (unless otherwise indicated). The inflation factors from the IMPLAN model
were used throughout this analysis to ensure consistency and comparability. The table below shows the
inflation factors built into the IMPLAN Economic Modeling system.
Figure 2‐6. IMPLAN Model Inflation Factors
2011 ‐ 2020
IMPLAN
Inflation
Year Rate
2012 1.45%
2013 1.59%
2014 1.72%
2015 1.84%
2016 1.95%
2017 2.05%
2018 2.14%
2019 2.22%
2020 2.29%
SOURCE: IMPLAN Economic
Modeling System, v. 3.0.
Who Pays the Increased Taxes Affects the Magnitude and Distribution of the
Economic Impact of the Split Roll Tax Increase
One important question that influences the estimates of the impact of the split tax roll is who will pay
the taxes. In an ideal world, an analysis would have detailed data on the businesses and behaviors
associated with each establishment’s property taxes so that the model could precisely identify which
businesses and sectors of the economy will end up paying the higher property taxes. In practice, these
data are not only not available, but the information that is available is highly aggregated and contains
little detail on even land use, let alone the specific types of businesses that will pay the tax.
This distinction is important. If the burden of the increased property tax is borne by manufacturing
firms, for example, a relatively small fraction of their total expenditures are for labor as they must also
spend significant funds on the inputs of their manufacturing processes. In the manufacture of a car, for
example, a considerable amount of the cost of that car is for the purchase of steel, plastics, glass, tires,
etc. Compare this to a temporary staffing or advertising agency where the main expenditures are on
labor and little is invested in the physical “inputs” of the business. Here a decrease in spending is much
more likely to have a larger impact on labor. To provide some context, the following table summarizes
the total number of jobs lost per million dollars of reduced spending for each of the seven aggregated
11summary‐level, nongovernment economic sectors in the state. So a dollar spent on property taxes in
manufacturing will have a much smaller impact on overall employment (about one‐sixth the effect) than
one spent by a service or trade‐oriented business. Remember that the amounts here are aggregated, so
the differences are even greater within some specific sectors. The comparable multiplier for the Food
Services and Drinking Establishments sector, for example, is 31.25 jobs lost per million dollar decrease in
revenues.
Figure 2‐7. Aggregated Job Loss Multipliers for
Revenue Decreases in California Economy, 2011
Total Jobs lost
/ $million in
Description lost revenues
Overall 11.73
Agriculture 14.82
Mining 6.67
Construction 7.68
Manufacturing 3.13
Transport and Utilities 9.04
Trade 17.86
Service 15.22
SOURCE: IMPLAN California 2009 model.
As a result of this variation, the question of who pays is critical. Unfortunately, no data set is available
to delineate the distribution of the tax increase by sector. To be as conservative as possible, this analysis
assumes that the distribution of the increased level of property taxes is spread evenly across the entire
California economy. A similar set of issues exist with respect to the overall economic impacts of net
revenue losses in each of the different sectors; the overall economic impact will change depending on
the sector in which the tax increases are concentrated.
For purposes of this analysis, the sectoral share of the property tax increases from splitting the tax roll
are prorated across the entire spectrum of industries and sectors using each sector’s output9 to weight
the allocation. This relatively conservative assumption gives each business an equal chance that their
pass‐throughs on their lease, for example, will be more severely affected by the splitting of the tax roll.
A subsequent sensitivity comparison will present the overall effects of relaxing this assumption.
Modeling Accounts for Multiple Economic and Employment Effects
Input‐output models are solved computationally using iterative analysis to estimate the flow‐through
effects of effects of the decrease in net revenues that business will experience by diverting more of their
resources to paying their property taxes. There are three types of effects that arise from a business
spending more on their taxes: (1) direct effects; (2) indirect effects; and (3) induced effects.
9
The concept of output in this modeling context represents each sector’s total spending on goods, services and
labor across the economy.
12A direct effect is the explicit change in revenues caused by the policy choice—in the case of our baseline
scenario—the decrease in net revenues associated spending $6 billion more in aggregate on property
taxes. This results in lower net revenues for businesses in each affected sector (all sectors in the
baseline scenario). As a result, these businesses have less income and, on the margin, hire fewer
workers.
Once a business is paying more in taxes, it has fewer resources to spend on purchasing goods and labor
to produce its products and it consequently buys fewer inputs to its trade and hires fewer employees.
These firms in turn purchase less from their vendors and hire fewer employees. These are identified as
the indirect effects of the net revenue decrease.
Finally, as employees earn less, or as fewer are employed, they purchase fewer goods and services for
their personal use—resulting in yet another round of decreases in overall economic activity. These are
the induced effects of the original net revenue decrease. This analysis identifies the relative scope and
scale of each of these three effects.
The Economic and Employment Effects of the Split Roll
The economic and employment effects of the split roll are significant and, because of the removal of the
Proposition 13 cap on growth in assessments, the impacts would likely continue to grow over time. The
baseline scenario presented in this section represents the mid‐range estimate of these economic and
employment effects. It assumes that the split roll is instituted in 2013 and that the initial adjustment
results in the increase of property taxes by some $6 billion. Note that this is a significant increase in a
tax stream that only totaled approximately $50 billion in 2009‐10.
The following table summarizes the five‐year estimated impacts of splitting the property tax roll on
employment in California. Overall it is estimated that 396,345 jobs would be lost over the first five years
of the proposed tax increase—a number that would grow in each subsequent year. Five years later, in
2021‐22, the annual estimated impact would total almost 112,000 additional jobs lost annually.
Figure 2‐8. Estimated Number of Jobs Lost as a Result of Imposing a
Split Assessment Roll in California, 2012 ‐ 2017
Direct Indirect Induced
Year Effects Effects Effects Total Effects
2012‐13 34,423 15,783 20,154 70,360
2013‐14 36,572 16,769 21,413 74,754
2014‐15 38,752 17,768 22,689 79,210
2015‐16 40,961 18,781 23,982 83,724
2016‐17 43,198 19,807 25,292 88,296
Five‐year
193,906 88,908 113,531 396,345
Total
13The economic impacts are significant as well, as shown in the next table. In fact, for every dollar of new
property tax imposed by the split roll, there is more than another dollar of economic output lost through
indirect and induced effects. Cumulatively, these effects total nearly $72 billion dollars in our five‐year
window and $102.5 billion for the next five years (not presented on this table).
Figure 2‐9. Estimated Economic Output Lost as a Result of Imposing a
Split Assessment Roll in California, 2012 – 2017 (billions of dollars)
Direct Indirect Induced
Year Effects Effects Effects Total Effects
2012‐13 6.087 3.014 3.182 12.283
2013‐14 6.570 3.253 3.434 13.257
2014‐15 7.082 3.507 3.702 14.290
2015‐16 7.623 3.775 3.985 15.383
2016‐17 8.196 4.059 4.284 16.539
Five‐year
35.557 17.608 18.586 $71.751
Total
Sensitivity Scenarios
How sensitive are these results to the assumptions included in the model design? To assess the
sensitivity of the models, several scenarios were developed using alternative assumptions. These
scenarios center around three sets of assumptions:
1. Margin between assessed and market value. The amount of the difference between assessed
value and market value at the point of implementation of the split roll was assumed to be $6.0
billion dollars in 2011 dollars. What if that amount is allowed to vary to reflect the differences
observed historically? To provide a context for this analysis, these amounts will be presented
for two additional scenarios: (1) the margin is only $4 billion (among the lower values
historically); and (2) the margin is $10 billion (just under the largest margin estimated by the
California Board of Equalization in its 4 R Act Ration computations.
2. Property value growth rates. For reasons explained above, the model assumes a growth rate
for the study years of one‐half the average annual growth rate for the years 2001‐02 through
2008‐09. The effects of the split roll will be re‐estimated using a property value growth rate (for
both assessed and market values) equal to the average for this historical period, or twice that
used in the above analysis.
3. Distribution of property tax burden by industry sector. The baseline scenario pro‐rates the
new property tax burden across the entire economy weighted by each sector’s relative share of
total output—thereby reflecting an assumption that those properties with lower assessed
values can be found evenly throughout the economy. An alternative scenario will be examined
whereby these shifts are concentrated in the service and trade (retail and wholesale) sectors by
increasing their relative share of the property tax burden by 25 percent, then allocating the
balance by their relative market shares. This reflects the perspective that it is lessees and
14businesses driven less by capital investment that will bear the brunt of the higher tax
assessments.
The results from each of these scenarios are presented below.
Margin Between Assessed and Market Valuation at Time of Implementation
Changing the margin between the assessed and market valuation at the point of the initial
implementation of the split roll has a direct and significant impact on the overall impact of the initiative
that is generally directly proportional to the changes in the difference in the magnitude. The following
table shows the results for a $4 billion difference, representing a difference between the assessed
valuation and the market valuation of $400 billion for commercial and industrial properties. This
amounts represents the typical historical low for this difference.
Figure 2‐10. Estimated Employment and Economic Output Lost as a
Result of Imposing a Split Assessment Roll in California, 2012 – 2017,
Low Marginal Difference Between Assessed and Market Value
Scenario
Scenario Employment Effects (jobs lost)
Direct Indirect Induced Total
Year Effect Effect Effect Effect
2012‐13 22,948 10,522 13,436 46,907
2013‐14 24,775 11,360 14,506 50,641
2014‐15 26,639 12,214 15,597 54,450
2015‐16 28,537 13,085 16,708 58,330
2016‐17 30,469 13,970 17,839 62,279
Five‐
year 133,369 61,151 78,086 272,606
Total
Scenario Output Effects (billions of dollars of output lost)
Direct Indirect Induced Total
Year Effect Effect Effect Effect
2012‐13 4.058 2.009 2.121 8.300
2013‐14 4.451 2.204 2.326 9.103
2014‐15 4.868 2.411 2.544 9.957
2015‐16 5.311 2.630 2.776 10.863
2016‐17 5.781 2.863 3.022 11.825
Five‐
year 24.468 12.117 12.790 49.375
Total
15Changing the difference in valuation upward has a similar but opposite effect from our baseline
scenario. The following table shows the results for a $10 billion difference, representing a difference
between the assessed valuation and the market valuation of $1 trillion for commercial and industrial
properties. This amount captures the approximate estimated difference between the two valuations at
the peak of the real estate boom.
Figure 2‐11. Estimated Employment and Economic Output Lost as a
Result of Imposing a Split Assessment Roll in California, 2012 – 2017,
High Marginal Difference Between Assessed and Market Value
Scenario
Scenario Employment Effects (jobs lost)
Direct Indirect Induced Total
Year Effect Effect Effect Effect
2012‐13 57,371 26,305 33,590 117,267
2013‐14 60,167 27,587 35,227 122,981
2014‐15 62,979 28,877 36,874 128,730
2015‐16 65,809 30,174 38,531 134,513
2016‐17 68,655 31,479 40,197 140,332
Five‐
year 314,981 144,423 184,419 643,823
Total
Scenario Output Effects (billions of dollars of output lost)
Direct Indirect Induced Total
Year Effect Effect Effect Effect
2012‐13 10.145 5.024 5.303 20.471
2013‐14 10.808 5.352 5.650 21.810
2014‐15 11.509 5.699 6.016 23.223
2015‐16 12.247 6.065 6.402 24.714
2016‐17 13.026 6.451 6.809 26.286
Five‐
year 57.735 28.590 30.179 116.505
Total
Property Value Growth Rates
Another critical assumption in the baseline analysis was that the real estate market has substantively
changed, at least for the period of time covered by this analysis and that the “new” real estate
environment will result in a slower growth rate in both assessed and market valuations. This is fueled by
three anticipated effects: (1) a very weak and slow‐to‐recover marketplace; (2) the downward pressure
on prices introduced by increasing the carrying cost and/or decreasing the returns of holding real
properties; and (3) a possible slowdown in the development and construction of new properties (fueled
16by both flagging demand and a difficult credit environment). The baseline model, this study’s core
estimate of the impacts of the split roll, does this by assuming that growth for the period analyzed in
both valuation series is at one‐half historical rates.
The following table, however, provides the estimated impacts of the split roll on the economy if
historical average rates were used instead.
Figure 2‐12. Estimated Employment and Economic Output Lost as a
Result of Imposing a Split Assessment Roll in California, 2012 – 2017,
Historical Assessed and Market Value Growth Rate Scenario
Scenario Employment Effects (jobs lost)
Direct Indirect Induced Total
Year Effect Effect Effect Effect
2012‐13 34,423 15,783 20,154 70,360
2013‐14 39,262 18,002 22,988 80,252
2014‐15 44,507 20,407 26,059 90,973
2015‐16 50,181 23,009 29,381 102,571
2016‐17 56,309 25,818 32,969 115,096
Five‐
year 224,682 103,019 131,550 459,251
Total
Scenario Output Effects (billions of dollars of output lost)
Direct Indirect Induced Total
Year Effect Effect Effect Effect
2012‐13 6.087 3.014 3.182 12.283
2013‐14 7.053 3.493 3.687 14.232
2014‐15 8.133 4.028 4.251 16.412
2015‐16 9.339 4.625 4.882 18.845
2016‐17 10.684 5.291 5.584 21.559
Five‐
year 41.296 20.450 21.586 83.331
Total
Distribution of New Property Tax Burden By Sector
Finally, there is the question of who (which industries) will bear the burden of the new, elevated
property taxes. In the baseline scenario, the study assumes that these effects will be widely distributed
and equally born by ALL sectors of the economy. It is possible, however, that these effects could be
concentrated in certain sectors. One argument is that manufacturing is a mature and declining industry
in the state, thus it is likely to be the sector wherein the properties that have been the longest without
revaluation are concentrated. Another argument is that these properties are concentrated in the hands
of partnerships and corporations that have purchased these locations for investment purposes, and thus
17the effects are more likely to be concentrated in businesses that lease their properties and thus bear the
costs through their triple‐net leases. This would lean toward an over‐representation of service sector
and trade sector (especially retail) firms. Because of the differences in the relative importance of capital
in each of these sectors, these concentrations could have significant impacts on the results of the
economic impact analysis.
To provide insight into the potential implications of the baseline assumption of widespread distribution
of the impacts, two additional scenarios are analyzed here. The first estimates what would happen if
the effects were concentrated in the service and trade sectors, which together account for 61.4 percent
of the overall output10 in the state. This was done by introducing a 25 percent increment to their shares
of the impacts and then spreading the balance across each of the other sectors relative to their initial
shares of overall output. The results are presented in the following table.
Figure 2‐13. Estimated Employment and Economic Output Lost as a
Result of Imposing a Split Assessment Roll in California, 2012 – 2017,
New Property Tax Burden Concentrated in Service and Trade Scenario
Scenario Employment Effects (jobs lost)
Direct Indirect Induced Total
Year Effect Effect Effect Effect
2012‐13 39,143 17,948 22,918 80,009
2013‐14 41,588 19,069 24,350 85,006
2014‐15 44,067 20,205 25,801 90,073
2015‐16 46,578 21,357 27,271 95,206
2016‐17 49,122 22,523 28,761 100,405
Five‐
year 220,498 101,101 129,100 450,700
Total
Scenario Output Effects (billions of dollars of output lost)
Direct Indirect Induced Total
Year Effect Effect Effect Effect
2012‐13 6.348 3.144 3.318 12.810
2013‐14 6.852 3.393 3.582 13.827
2014‐15 7.385 3.657 3.860 14.903
2015‐16 7.950 3.937 4.156 16.043
2016‐17 8.548 4.233 4.468 17.249
Five‐
year 37.084 18.364 19.384 74.831
Total
10
It is important to note that overall output in the context of these models is not directly equivalent to Gross State
Product, but rather a broader measure that includes both value added (the prime item measured in GSP) as well as
their purchases of inputs and intermediate goods.
18Alternatively, the consequences of the split roll could be concentrated in more capital‐intensive sectors,
such as manufacturing, construction, and transportation and utilities. Accordingly, an alternative
estimate was prepared wherein the same 25 percent increment was applied to these sectors with the
residual tax impact allocated across the remaining sectors, again proportional to their individual shares
of overall output. The results of this simulation are presented in the table below.
Figure 2‐14. Estimated Employment and Economic Output Lost as a
Result of Imposing a Split Assessment Roll in California, 2012 – 2017,
New Property Tax Burden Concentrated in Manufacturing,
Transportation, Utilities and Construction Scenario
Scenario Employment Effects (jobs lost)
Direct Indirect Induced Total
Year Effect Effect Effect Effect
2012‐13 31,535 14,459 18,463 64,457
2013‐14 33,504 15,362 19,616 68,483
2014‐15 35,501 16,278 20,786 72,564
2015‐16 37,524 17,205 21,970 76,700
2016‐17 39,574 18,145 23,170 80,889
Five‐
year 177,638 81,449 104,006 363,092
Total
Scenario Output Effects (billions of dollars of output lost)
Direct Indirect Induced Total
Year Effect Effect Effect Effect
2012‐13 5.932 2.938 3.101 11.971
2013‐14 6.403 3.171 3.347 12.921
2014‐15 6.902 3.418 3.608 13.927
2015‐16 7.429 3.679 3.883 14.992
2016‐17 7.988 3.956 4.175 16.119
Five‐
year 34.654 17.161 18.114 69.929
Total
Overview of Sensitivity to Assumptions
As can be seen from all of these simulations, the assumptions used can change the expected impacts of
introducing a market‐value based taxation assessment system in California. The table below provides an
overview of the several sensitivity scenarios presented above. As can be seen from this table, the
baseline scenario lies cleanly in the middle of the alternative estimates along each dimension. The
estimations are MOST sensitive to the magnitude of the initial tax increase that will be borne by
19businesses—a reasonable question. It is also one of the areas subject to the greatest uncertainty and
the authors would recommend investing any new research resources on this issue to narrowing the
bands of uncertainty about the gap between assessed and market valuation in the California property
taxation system. The growth rate assumption is also an important question, but the authors believe that
the more conservative approach included in the baseline provides a reasonable estimate of what is likely
to happen. The final area of analysis—the composition of the sectors most likely to be impacted, could
easily be clarified as part of the study recommendation above, although it is worth noting that the net
overall uncertainty here is only about plus or minus ten percent—quite reasonable in an analysis of this
type.
Figure 2‐15. Estimated Employment and Economic Output Lost as a
Result of Imposing a Split Assessment Roll in California, 2012 – 2017,
Impact Overview
Scenario Employment Effects (jobs lost)
Growth Sectors Bearing New PT
Initial Valuation Margin Rates Burden
Mfg,
Low High Service & Transp,
Year Baseline Margin Margin Historical Trade Util, Constr
2012‐13 70,360 46,907 117,267 70,360 80,009 64,457
2013‐14 74,754 50,641 122,981 80,252 85,006 68,483
2014‐15 79,210 54,450 128,730 90,973 90,073 72,564
2015‐16 83,724 58,330 134,513 102,571 95,206 76,700
2016‐17 88,296 62,279 140,332 115,096 100,405 80,889
Five‐
year 396,345 272,606 643,823 459,251 450,700 363,092
Total
Scenario Output Effects (billions of dollars of output lost)
Growth Sectors Bearing New PT
Initial Valuation Margin Rates Burden
Mfg,
Low High Service & Transp,
Year Baseline Margin Margin Historical Trade Util, Constr
2012‐13 12.283 8.188 20.471 12.283 12.810 11.971
2013‐14 13.257 8.981 21.810 14.232 13.827 12.921
2014‐15 14.290 9.823 23.223 16.412 14.903 13.927
2015‐16 15.383 10.717 24.714 18.845 16.043 14.992
2016‐17 16.539 11.666 26.286 21.559 17.249 16.119
Five‐
year 71.751 49.375 116.505 83.331 74.831 69.929
Total
20Finally, there is the question of what happens if the baseline is wrong in the same direction on all three
dimensions. In this case, the upper‐bound estimate in this study, the total impact topped out at 829,345
jobs lost in the five‐year window,11 with a gross effect on economic output totaling $137.9 billion for the
five‐year window of the study. On the low side,12 and the authors believe this would be an almost
absolute floor for the estimated impact of the split roll in California, the net impact was 249,735 jobs
lost and $48.1 billion dollars of economic activity lost.
Generally, the sensitivity results corresponded with what one might reasonably expect and the
magnitudes were consistent with the scale of the changes anticipated. The extent to which market
value exceeds current assessed valuation will be the critical link in defining the impact of implementing a
split roll on the California economy.
Implications of Using Alternative Split Roll Regimes
As mentioned above, this analysis focuses on the core split roll proposal that has most recently been
advanced by the CTRA and other advocates of these regimes. These estimates represent the best
estimate of the likely impact of a split roll regime that is implemented by removing the two percent
assessed valuation limit set by Proposition 13 and effectively assessing commercial and industrial
properties at fair and full market value. Two alternative approaches have been mentioned by various
split roll tax regime advocates and they are discussed briefly below: (1) increase the one percent rate on
commercial and industrial properties to some higher amount; and (2) allow the assessed value of
commercial and industrial properties to appreciate at a higher rate than the two percent cap introduced
by Proposition 13.
Increasing the One Percent Rate on Commercial and Industrial Properties
If the split roll were implemented by rate changes, then the effects would reflect a direct proportional
increase in total property tax revenues paid by commercial and industrial taxpayers. The first
consequence of such an approach is to remove the entire “fairness” justification from the policy
debate13 and to acknowledge that the split roll proposal is most simply intended to make businesses pay
higher taxes. For example, if the rate were doubled to 2.0 percent, then the property taxes paid by all
commercial and industrial property owners in the state would double from $20.49 billion in 2016‐17 to
$40.98 billion.
In this approach, the current assessment system would be preserved, but instead of imposing the 1.0
percent property tax assessment required under Proposition 13, business would be taxed at a higher
rate, say 1.5 or 2.0 percent. In the 2.0 percent example above, the impact of the increase would be
roughly three times the amount estimated for the full‐market assessment split roll regime analyzed
11
In this approach, the initial margin was set to $10 billion, the valuation growth rates were set to historical
averages, and the impacts were concentrated in the service and trade sectors.
12
In this scenario, the initial margin was set to $4 billion, the valuation growth rates were set to one‐half historical
averages, and the impacts were concentrated in the manufacturing, construction, transportation and utility
sectors.
13
This is the argument that current taxpayers who own comparable properties pay different levels of property
taxes because of they purchased their properties at the same time.
21previously and the impacts would be roughly twice those identified in the high‐differential scenario
presented in Figure 2‐11, or some 1.3 million lost jobs and $233 billion in lost economic activity. These
are rough estimates that provide a general sense of the magnitude of the impact of such a split roll tax
regime.
Changing the Assessed Valuation Growth Cap
Another approach to instituting a split roll property tax regime is to increase the cap on the annual
growth in assessed valuation from its current 2.0 percent to a higher level, say 4.0 or 6.0 percent. This
has the net impact of increasing the total property taxes paid by an amount less than the $6 billion
estimated above. The impact of instituting such an approach would depend on (1) the actual rate
actually selected; (2) to what extent it is retroactively applied;14 and (3) the changes in the market value
of commercial and industrial real estate into the future.
If the rate cap is set higher than the average annual rate of appreciation, or applied back in time to the
extent that assessed value is allowed to grow at a rate equal to full market value, then the economic
impacts of this approach would be comparable to those presented in this analysis. If they are set at a
lower level, then these impacts above could be mitigated, depending on the specific cap established and
the extent to which they are applied back in time to the property’s value. A more detailed analysis of
the assessed values of real estate at the property level in each county would have to be conducted to
precisely estimate the impact. Any increase in net overall property taxes, however, will result in job
losses and decreases in overall economic output.
14
This is important since, the earlier the change is applied, the more closely the assessed value would correspond
to full market value.
22Chapter 3: How Is Business Impacted by the Imposition of the Split Roll?
23This section of the report will examine three consequences of the implementation of the split roll tax
regime: (1) how do these changes affect the overall economic and tax landscape (macroeconomic
impacts); (2) how do these changes affect businesses directly (microeconomic impacts); and (3) what
types of businesses are likely to be impacted? Each of these sets of issues carries important implications
for California’s economy and workforce. If the split roll is introduced as discussed in Sections One and
Two, it is expected to raise both the taxes paid by commercial and industrial property owners15 and the
revenues received by governments.
Economy‐wide Macroeconomic Effects of the Split Roll
The imposition of $3 – 8 billion dollars in new taxes on businesses will have significant effects on the
California economy. Given that these costs are purely on the business side of the ledger, tax theory tells
us that consumers will likely pay these costs through higher prices in the long run. In the short‐to‐mid‐
term, however, these price changes will have significant implications for the industries and sectors
affected.
It will also increase the incentives to develop by making the costs of holding vacant land higher and
encourage local governments to prefer these uses over residential properties because of their
proportionately higher “yield’ in property tax revenues. This effect is likely to exacerbate the current
tendency of local communities to favor sales tax‐generating and hotel tax‐generating properties over
other forms of development (the “fiscalization of land use.”) In the long run, this could lead to the
underproduction of housing and upset the regional balance between jobs and housing for the people
who hold them (the jobs‐housing balance).
It will also increase rents for business renters who have pass‐through leases (the “triple‐net lease” is the
most common form) and create downward pressure on the prices of commercial and industrial
properties.
Price Effects on Properties
Specific estimates of the impact of the split roll on existing property prices have been limited.
Conceptually, the increase in property taxes will force land owners to pay more annually for the land
they own, thereby making it less attractive and reducing prices. Proponents of the split roll tout this as
making land “more affordable.” The decreasing desirability of holding land is partially offset by the
implicit incentive to make the land more productive by developing it while simultaneously making the
risks associated with developing it greater through higher uncertainty about the future cost of holding
the land (the uncertainty of paying property taxes on fair market value). This is likely to further
forestall recovery in the construction sector of the economy, which, as the table below shows, has
already absorbed significant losses in the current business cycle.
15
For purposes of this discussion, residential rental properties will not be included in our framework, even though
there are those enterprises that explicitly are in the business of renting properties to individuals. Also left
unaddressed in this discussion is the development of mixed‐used properties where residential properties are co‐
located in the same development as commercial space.
24You can also read