Corporate Value Maximization - NISSIN FOODS HOLDINGS CO., LTD. Stock Code: TSE 2897 - nissin foods group
←
→
Page content transcription
If your browser does not render page correctly, please read the page content below
Corporate Value Maximization

    NISSIN FOODS HOLDINGS CO., LTD.
          Stock Code: TSE 2897

            December 2019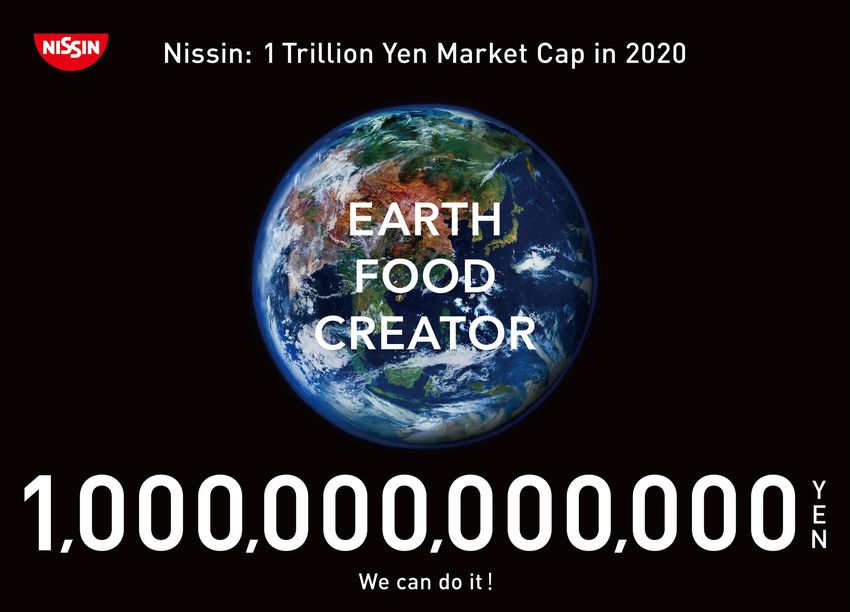
1
Contents
Section 1 Mid-Term Business Plan FY2021 Section 3 Overseas Business Strategy
Interim Review and Future Outlook - Global Demand Trend of Instant Noodles・・・45
- Review of FY2021 Targets・・・4 - Cup Composition Rates and GDP/Capita・・・46
- Review of Targets by Segment ・・・5 - CUP NOODLES Strategy・・・47
- Regarding Market Capitalization of JPY 1 Trillion・・・ 6 - Overseas Expansion(wholly-owned/equity-method/investing)・・・
- Review of Five Key Themes・・・7 49
- Review of Investment, etc. and Future Policy・・・8 - Relationship with Premier Foods plc・・・50
- Issues and Policies by Region/Business・・ ・9 - Growth Drivers by Geographical Area・・・51
- Other Initiatives: For Realization of a Sturdier Management - Brazil: Overview of Business・・・52
Structure・・ ・10 - China: Overview of Business ・・・54
- Initiatives to Enhance Corporate Value・・ ・11 - China: Production Capacity Enhancement and Sales
Achievements of the 3rd year of the MTBP FY2021 Offices・・・55
- Sales/Revenue, Operating Income/Profit & OPM-Consolidated・・・14 - India: Overview of Business・・・56
- Sales/Revenue, Operating Income –By Segment・・・15 - Promote local personnel to senior executives in major overseas
- Growth Trend of Instant Noodles Business・・・18 areas・・・57
- Investment Plan, and Financial and Capital Policies・・・19 - Developing and Strengthening Human Resources for Global
- Market Capitalization・・・21 Management・・・58
Essence of Mid-Term Business Plan FY2021(Initial)
Section 4 Corporate Governance for Sustainable Growth
Section 2 Domestic Business Strategy - Management centered on Corporate Governance・・・60
- NISSIN’s Position in Instant Noodles Industry in Japan・・・36 - Major Achievements of the effective Board of Directors・・・61
- Power of NISSIN’s Brands in Japan・・・39
- Growth Strategy of Instant Noodles Business・・・40 Section5 Overview of NISSIN
- Core Brands of NISSIN FOOD PRODUCTS・・・42
- Growth Strategy of NISSIN’s Domestic Other Businesses・・・43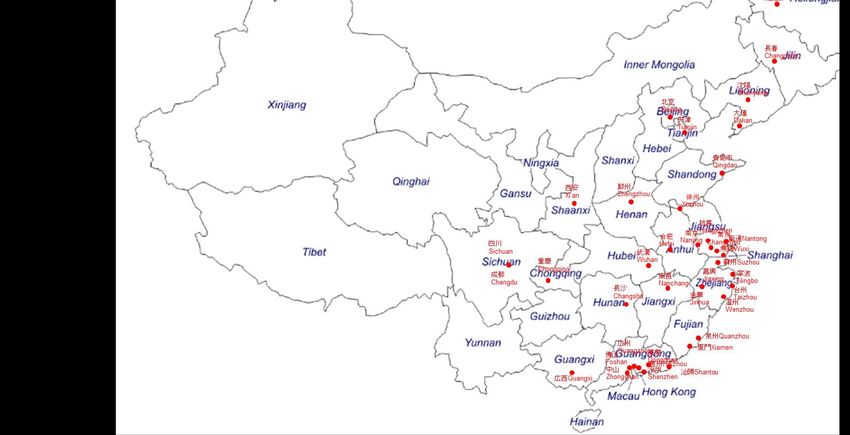
Section 1 Mid-Term Business Plan FY2021
MTBP2021
Interim Review and Future Outlook
4
Review of FY2021 Targets

• Mainly revision to reflect actual situation of overseas business and went outside the M&A
  budget.

                                                    Revised Mid-term Plan KPIs

                                                                          Before review                           After review

           Earning          Revenue                                           550.0       bil. Yen                   480.0       bil. Yen
            power
           through
          operations        Operating profit                                    47.5      bil. Yen                     42.5      bil. Yen

                            Profit*                                             33.0      bil. Yen                     30.0      bil. Yen

           Capital          ROE                                                       8   %                                 8    %
           market
            value
                            Adjusted EPS**                                          330   Yen                           284      Yen

                            Market capitalization***                                  1   tri. Yen                      See page 6

    *       ”Profit attributable to owners of parent” under IFRS
    **      (Operating profit ±Other income, expenses ‐Income tax expenses - Profit attributable to non-controlling interests)/ Average number of
            shares outstanding during the fiscal year (excluding treasury shares)
    ***     Market capitalization = Stock price x Number of shares outstanding at the end of the fiscal year (excluding treasury shares)
5
Review of Targets by Segment

• In light of changes in the business environment and the issues of each region/business, we
  have revised segment targets.
     FY2021 Targets for Domestic Business                       FY2021 Targets for Overseas Business

   (bil. Yen)               Before review     After review    (bil. Yen)               Before review   After review

                Revenue             243.0            238.0                 Revenue              80.8           67.5

    Instant     Operating                                       The        Operating
                                     29.1             29.5                                       6.4             3.7
    Noodles     profit                                        Americas     profit

                %                  12.0%            12.4%                  %                   7.9%            5.5%

  Chilled and   Revenue             111.6            103.0                 Revenue              53.7           47.0
     frozen
     foods,     Operating                                        China     Operating
                                       5.2              5.2                                      5.1             4.7
    confec-     profit                                        (incl. H.K.) profit
  tionery and
   beverages    %                   4.7%              5.0%                 %                   9.5%          10.0%

                                                                           Revenue              24.1           13.0
  Foreign exchange                                 Current                 Operating
  rate assumptions:            Initial plan    assumption        Asia                            2.0             2.7
                                                                           profit
                    USD           112.68           110.00
                                                                           %                   8.3%          20.8%
                    BRL             28.00            28.00
                                                                           Revenue               8.3             7.5
                    HKD             14.53            14.00
                                                                           Operating
                                                                EMEA                             2.4             1.3
                    EUR           131.77           125.00                  profit

                                                                           %                  28.9%          17.3%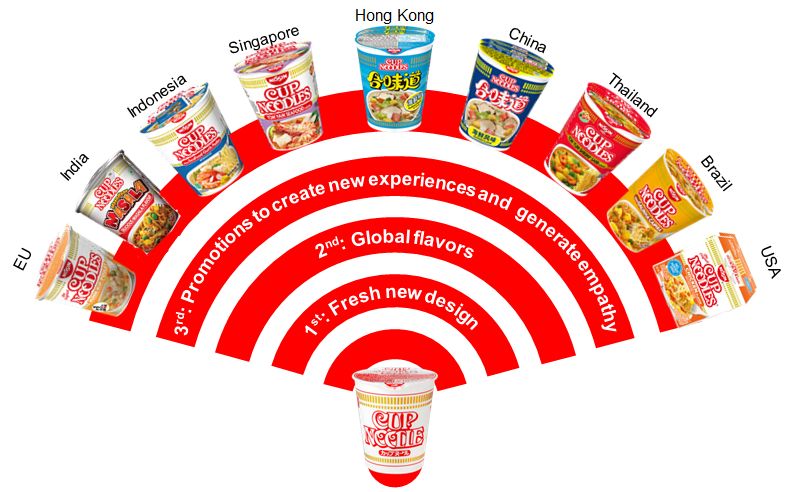
6
Regarding Market Capitalization of JPY 1 Trillion

• The Group will steadily aim for market capitalization of JPY 1 trillion as a target to be achieved along the
  way regardless of timing.
• The Group will aim for improvement of corporate value by focusing on initiatives from a CSV perspective.

             Stock market trend: Changes in PER                    Initiatives to improve corporate value

     The PER of Japanese stocks has generally been in         Initiatives and achievements from CSV perspective
     a downward trend since 2018 and market                   (1) Achievements
     conditions make our initial forecast of PER ≥ 30
     unlikely.                                                ✓   Selected as a component of the Asia/Pacific Index of the Dow
                                                                  Jones Sustainability Indices

     35.0x
                                                              ✓   Certified as an organization recognized under the 2019
                                          Downward                Certified Health & Productivity Management Outstanding
                                            trend                 Organizations Recognition Program (White 500)
             Nissin HD
     30.0x
                                                              ✓   Selected as a semi Nadeshiko Brand company for fiscal 2019

     25.0x                                                    (2) Environment-Friendly Management
                                                              ✓   Introduction of ECO cups (paper-made containers)
     20.0x                                                    ✓   Commenced the application of certified palm oil (RSPO) at
             TOPIX                                                domestic plant
     15.0x                                                    (3) Initiatives for new Earth Foods
             Nikkei 225
                                                              ✓   Launch of basefood (All-in PASTA)
     10.0x
                                                              ✓   Research on “cultured steak”

      5.0x
             ▲                                          ▲         →   We will endeavour to further
             At time of                     Most recently             accelerate and expand such initiatives
             Mid-term Plan                   in April 2019
                                                                      to increase corporate value.
             announcement
             in May 2016
7
Review of Five Key Themes

                                       Initial FY2021
          Strategic Theme                   Target             FY2019 Results       FY2021 Forecast              Comments

                                                                                                      ✓ Overall progress was slightly slow partly due to
 1
                                                                                                        the impact of price revisions in U.S. business.
           Promoting                     Up 50%                                                       ✓ Growth in Brazil and Asia is expected.
       global branding for         compared to FY2016              Up 20%           Up around 30%     ✓ Depending on market conditions, we will not just
         CUP NOODLES                     (units)                                                        focus on “CUP NOODLES” and will look out for
                                                                                                        growth opportunities for premium products.

 2
                                                                                                      ✓ Target is expected to be reached.
                                 Operating profit generated
          Focusing on
                                    in priority overseas
        priority locations        locations accounts for
                                                                       -             Around   70%
             (BRICs)
                                           70%

                                       NISSIN FOOD                                                    ✓ Operation of Kansai Plant (improvement of
 3
         Laying stronger                PRODUCTS                                                        production efficiency, safety and security)
                                     + MYOJO FOODS
                                                                                     29.5 bil. yen    ✓ Stabilization of earnings base through price revision
         foundations for                                        25.7 bil. yen
       domestic profit base           29.1 bil. yen                                                     (in response to unexpectedly high costs)
                                   Operating profit target                                            ✓ Further enhancement of value of core brands

                                                                                                      ✓ The Confectionary business grew steadily.
 4
       Establishing a second                                      We went outside the budget for      ✓ The Cereal business increased its market presence
                                      As well as growing                                                and value.
     primary revenue source                                                M&A deals.
                                      brands organically,
      (confectionary, cereals,                                     We will continue to examine        ✓ In particular, revenue in the Chilled and Frozen
                                     make the most of M&A
     chilled and frozen foods)                                     favourable M&A proposals.            Foods business grew due to market growth and
                                                                                                        increased demand for single-serving food products.
                                                                                                      ✓ Shift to more profitable business is necessary.

 5                                 Pool of management                                                 ✓ The list is becoming more satisfactory.
      Human resources for           human resources                                                   ✓ A plan for systematic personnel changes needed
       global management                   X2                       X 1.8                X2             to be created.
                                       (200 people)           (Around 180 people)    (200 people)
8
Review of Investment, etc. and Future Policy

     Bil. yen         Initial plan       FY2019             FY2021

    Business         100.0 bil. yen    23.5 bil. Yen                       (Major investments)
                                                               –
   investment        over 5 years      over 3 years                        Investment in Premier Foods, investment in Thai President Foods

                                                                           (Reasons for extra investment)
                                                                           NISSIN FOOD PRODUCTS (increased investment in Kansai Plant,
     Capital         150.0 bil. yen   146.0 bil. Yen     215.0 bil. Yen    shift to in-house manufacturing of materials, chilled and frozen food
   investment        over 5 years      over 3 years      over 5 years      plant, etc.)
                                                                           BonChi Yamagata Plant, Nissin Brazil, expansion of overseas lines,
                                                                           etc.
   Depreciation        Around
                                                            Around         * The FY2021 forecast includes impact of application of IFRS 16 of
       and           19.0 bil. yen     20.3 bil. yen
                                                         24.5 bil. Yen*      around 3.0 bil. yen.
   amortization       (FY2021)

                Review of business investment

     ✓ We are still examining M&A deals.

                 Review of capital investment
                                                                          Although our operating profit target on an organic basis
      ✓ Expansion of investment in safety/security
                                                                          remains the same, improvement in terms of ROI is needed.
      ✓ Expansion of investment aimed at improving
        production efficiency and saving labor
      ✓ Expansion of facilities for growing categories

   The total amount of investment, including M&A, needs to be controlled. We will manage expenditure by
   putting investments in order of priority based on factors such as ROI.
9
Issues and Policies by Region/Business
• Moving forward, we will continue to implement the policy of promoting global branding. At the same time, we
  will address specific issues according to the competition environment and market characteristics and make
  sure that we establish an order of priority for investment.
                        Instant           Respond to higher costs with price revisions. Respond to labor saving and labor population issue in
                        noodles       ●   the medium and long-term through operation of Kansai Plant.
                                          Be sure to tap into growth opportunities for noodles with ingredients and fresh pasta. Strengthen
                      Frozen food
                                          proposals to growing channels.
    Domestic
                      Chilled food        Focus on high added value domains and pursue profitability.
                      Confectionery       Maximize revenue and profit by brushing up core brands and new value products.
                       Beverages          Expand a stable source of earnings through strengthen channels.
                                          Strengthen earnings base through price increases and cost reductions, etc. and develop premium
                          U.S.        ●   products.
             The
           Americas
                         Brazil       ●   Develop CUP NOODLES brand and strengthen sales of bag-type noodles, which are base of earnings.
                                          Utilize strengths of local production and focus on priority regions. Strengthen profitability through
                         Mexico
                                          development of premium products.
                                          Expand business opportunities through diversification. Strengthen marketing activities in mature
                          H.K.
                                          instant noodles market.
            China
                        Mainland          Expand market and maximize revenue and profits through high-grade noodles, rather than focusing
                         China            only on CUP NOODLES.
                                          Determine priority regions/channels/segments and improve profit margins. Utilize as production base
                       Indonesia      ●   for HALAL products.
Overseas                  India       ●   Determine priority regions/channels/segments and improve profit margins.
                                          Expand cup-type noodles focusing on urban areas and move plant operations and production
                        Vietnam
                                          departments into profit through OEM within Group.
             Asia
                                          Maintain current high growth for CUP NOODLES through continuous investment. Also look for multi-
                       Philippines    ●   branding opportunities.
                        Thailand      ●   Expand and enhance 10-baht bag-type noodles. Continue to invest in CUP NOODLES.
                                          Take advantage of position as market leader to strongly leverage “CUP NOODLES”, revitalize bag-
                       Singapore
                                          type noodles and develop multiple categories.
                                          Increase sales of major brands and strengthen earning base especially in priority areas, such as
                         Europe
            EMEA                          Germany and the UK. Liquidation of Turkish business.
                         Russia           As market leader, activate Russia’s stagnating market through sales and marketing.
Other Initiatives: 10
For Realization of a Sturdier Management Structure
• Shift to sturdier management structure that will allow us to focus on our core operations, through initiatives
in response to DX
Initiatives already implemented New future initiatives
Achievement of Smartwork 2000 Steering toward DX
• Improvement of productivity through workstyle • Review of business processes
reforms and reduction of labour costs
• Utilization of RPA and AI to save labor in simple
• Expansion of scope for creative work tasks
• Expansion of scope for creative work
Reduction of expenses Power BI
• Review of expenses on a groupwide basis • Unite operating system
• Elimination of waste and improvement of work Reduce documentation process, visualize action
efficiency assignments, and improve portability in working environment
Smart Factory
Initiatives to reduce distribution expenses • Manufacturing Execution System (MES)
• Improvement of transport efficiency through Aim automation in various manufacturing processes
pallet transportation • Nissin Automated Surveillance Administration (NASA)
• Improvement of delivery efficiency through two Enable monitoring whole manufacturing process
day delivery service
from central controlling room
DX=Digital Transformation RPA = Robotic Process Automation BI = Business Innovation11
Initiatives to Enhance Corporate Value (1)
• Initiatives to enhance corporate value for sustainable growth
International reputation Evaluation of empowerment of women
Selected as “Semi-Nadeshiko Brand” in the
Selected as a component of the “Nadeshiko” initiative run by the Ministry of Economy,
Asia/Pacific Index of the Dow Trade and Industry (METI) and the
Jones Sustainability Indices, Tokyo Stock Exchange to recognize
a group of global stock price enterprises that are outstanding in terms
indices of ESG investments of encouraging the empowerment of
women in the workplace.
Evaluation of health management ₋ Environment-Friendly Management
Certified as 2019's White 500 for Outstanding Health and ◼ Introduction of ECO cups
Productivity Management Using eco-friendly containers over the
last 11 years
NISSIN FOODS HOLDINGS, NISSIN FOOD PRODUCTS,
NISSIN CHILLED FOODS and NISSIN FROZEN FOODS were Introduced ECO cups (paper-made containers)
certified by METI and Nippon Kenko Kaigi as 2019's White 500 in 2008. Reduced CO2 emissions by 22%
compared and also contributes to reduced
for Outstanding Health and Productivity Management.
consumption of plastics
₋ Initiatives for new Earth Food * CO2 emissions are estimated through life-cycle assessment (LCA).
◼ Launch of basefood (All-in PASTA) ◼ First Japanese instant noodles manufacturer to use RSPO
✓ New “simple nutritious meal” that facilitates Certified Palm Oil (at domestic plant)
daily intake of essential nutrients NISSIN FOOD PRODUCTS
✓ Manufacturing by the newly developed began using sustainable
“nutrient retention press manufacturing “Certified Palm Oil*” at its
method” (patent pending) Kansai Plant (from March
2019).
◼ Step towards commercialization of “cultured steak” with
the texture of real meat
* RSPO-certified palm oil is a type of palm oil that is produced and
processed by considering the prevention of deforestation,
✓ Successfully created the world’s first beef sinews in a
preservation of biodiversity, and protection of human rights.
diced steak form12
Initiatives to Enhance Corporate Value (2)
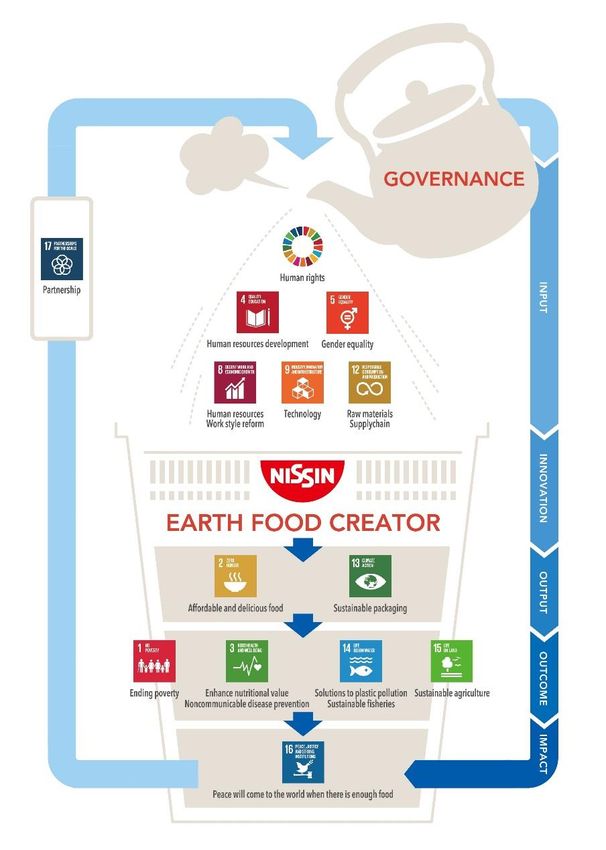
• Set value creation process to realize NISSIN Group philosophy
• Connect our value creation process with SDGs
Our impacts on society (examples)
We help give people equal access to safe food and
reduce poverty in disaster-stricken areas by
Eradication of
supporting food security and donating part of
poverty
revenues through organizations such as WINA and
WFP.
We help prevent non-infectious diseases by
Promotion of
improving consumers’ quality of life through the
prevention of
provision of products that meet social needs such
non-infectious
as products with zero sugar, reduced salt or
diseases
products for the elderly.
We will help enhance the nutritional value we
provide to consumers by providing products such
Enhancement of
as the “All-in Series” of basefood, meat protein
nutritional value
substitute (Soy meat), lactic acid bacteria, and
nutritional supplements.
We are a member and a managing enterprise of
CLOMA (Clean Ocean Material Alliance), which
Measures
tackles the problem of marine plastic waste, and we
against marine
are promoting the development of eco-friendly
plastic pollution
packaging materials in collaboration with
government and other enterprises.
We help our suppliers engage in sustainable
Promotion of agriculture by using raw materials, such as palm oil,
sustainable that have been produced and processed with
agriculture consideration for protection of forests and
biodiversity and respect for human rights.Achievements of the 3rd year of the MTBP FY2021
(Fiscal Year Ended March 31, 2019)14
Sales/Revenue, Operating Income/Profit & OPM - Consolidated
Sales/ Revenue
Bill. yen J-GAAP IFRS
540
516.4
520
495.7
500
480.0
480 468.1 465.0
460 451.0
440.9
440
420
400
2016/3 2017/3 2018/3 2018/3 2019/3 2020/3 2021/3
Forecast Plan
Operating income/Operating profit/Adjusted operating income/OPM/Adjusted OPM
Bill. yen J-GAAP IFRS %
60 8.0 9
7.9 ◆8% or higher 8
50 6.6
6.6 42.5 7
5.6 5.8 6.5 37.0
40 35.2 5.9 6
32.9 34.1 33.4
5.3 28.6 29.0 5
30 26.4
24.7 4
20 3
2
10
1
0 0
2016/3 2017/3 2018/3 2018/3 2019/3 2020/3 2021/3
Forecast Plan
Operating income/ Operating profit Adjusted operating income OPM Adjusted OPM
*Adjusted Operating income= Operating income-Impact from retirement benefit accounting
* Due to the introduction of IFRS, Adjusted Operating income as KPI was abolished and (IFRS) Operating Profit is KPI.15
Sales/Revenue & Operating Income – by Segment-1 Domestic
◼ Instant Noodles
(NISSIN FOOD PRODUCTS&MYOJYO FOODS)
Sales/ Revenue Operating income/profit & OPM
Bill. yen %
Bill. yen
J-GAAP IFRS 60 14
300 274.4 J-GAAP IFRS 11.6
265.2 269.2 10.9 12.4 12
238.0 50 9.6 11.1 11.6 11.4
250 226.1 234.0
222.2
10
40
200
29.5 30.3 29.5 8
30 25.3 25.5 25.7 27.1
150 6
100 20
4
50 10 2
0 0 0
2016/3 2017/3 2018/3 2018/3 2019/3 2020/3 2021/3 2016/3 2017/3 2018/3 2018/3 2019/3 2020/3 2021/3
Forecast Plan Forecast Plan
Operating income/ Operating profit OPM
◼ Chilled and Frozen, Confectionery and Beverages
Sales/ Revenue Operating income/profit & OPM
Bill. yen %
Bill. yen J-GAAP IFRS
8 J-GAAP IFRS 6
120
115.6 7
115 112.8 5.0 5
6 4.0 4.6
3.9 5.2
110 4.1 4.6 4
5 4.5 4.5
103.0 4.0
105 4 3
100.0 2.0
100 98.4 97.6
96.9 3
2
95 2.0 1.6
2
1.5
90 1
1
85 0 0
2016/3 2017/3 2018/3 2018/3 2019/3 2020/3 2021/3 2016/3 2017/3 2018/3 2018/3 2019/3 2020/3 2021/3
Forecast Plan Forecast Plan
Operating income/ Operating profit OPM16
Sales/Revenue & Operating Income – by Segment-2 Overseas
◼ The Americas
(Instant noodles in the U.S., Brazil, and Mexico)
Sales/ Revenue Operating income/profit & OPM
Bill. yen %
Bill. yen J-GAAP IFRS
80 10 J-GAAP IFRS 8
67.5 5.5
70 64.5 62.5 63.4 64.0 8 6
60.4
60 3.8 3.1 3.9 4.2 4
48.3 6
50 2.2 3.7 2
4 2.7
40 2.3 2.0 2.4
0
2 1.1
30 -2
20 0
-4
10 2016/3 2017/3 2018/3 2018/3 2019/3
2019/3 2020/3 2021/3
-2 Forecast -6
Plan
0
-4 -8
2016/3 2017/3 2018/3 2018/3 2019/3 2020/3 2021/3 -8.3
Forecast Plan
-6 -5.2 -10
◼ China Operating income/ Operating profit OPM
(Instant noodles in Hong Kong and Mainland China)
Sales/ Revenue Operating income/profit & OPM
Bill. yen %
Bill. yen J-GAAP IFRS 10 12
J-GAAP IFRS 10.0
50 47.0 9
42.6 44.5 10.1 10.2 9.2 10
40.9 40.1 41.4 8 9.5
8.4
40 36.0 7 8.5
8
6
30 4.7
5 4.1 4.1 6
3.6 3.8 3.8
4 3.4
20 4
3
10 2 2
1
0 0 0
2016/3 2017/3 2018/3 2018/3 2019/3 2020/3 2021/3 2016/3 2017/3 2018/3 2018/3 2019/3 2020/3 2021/3
Forecast Plan Forecast Plan
Operating income/ Operating profit OPM17
Sales/Revenue & Operating Income – by Segment-3 Overseas
◼ Asia
(Instant noodles in India, Thailand, Indonesia, Viet Nam, and Singapore)
Sales/ Revenue Operating income/profit & OPM %
Bill. yen 25
Bill. yen J-GAAP IFRS 9
14 13.0 J-GAAP IFRS 21.4 20.8 20
11.4 11.7 7
12
10 9.0 9.4 9.2 16.0
5 15
8 7.2
2.5 2.7
3
6 1.8 10
4 1 -2.0 -1.4 -0.4
-1.4
2 5
-1
0 2016/3 2017/3 2018/3 2018/3 2019/3 2020/3 2021/3
2016/3 2017/3 2018/3 2018/3 2019/3 2020/3 2021/3 -3 Forecast Plan
0
Forecast Plan
Operating income/ Operating profit OPM
◼ EMEA
(Instant noodles in Europe and Turkey)
Sales/ Revenue Operating income/profit & OPM
Bill. yen %
Bill. yen J-GAAP IFRS 20
8 7.5 9 J-GAAP IFRS
6.8 7.0 17.3
7 7
5.9 5.9 14.3 15
6
5
5 4.6 4.6
3 9.3 10
4 1.0 1.3
0.2 0.6
3 1 -0.4 0.0 -0.5
5
2 -1 2016/3 2017/3 2018/3 2018/3 2019/3 2020/3 2021/3
1 0.4 2.7 Forecast Plan
-3 0
0
2016/3 2017/3 2018/3 2018/3 2019/3 2020/3 2021/3 Operating income/ Operating profit OPM
Forecast Plan18
Growth Trend of Instant Noodles Business
Consolidated Sales Trend
(bil. Yen)
600
Overseas Businesses CAGR
(FY2010-FY2019)
Domestic Businesses excl. Instant Noodles +9.8%
Domestic Instant Noodles Business 496 CAGR
500
(FY2015-FY2019)
468
451 +10.3%
432 440
418 110
101
400 383
301 375 381 83 123 16% CAGR
74 118
(FY2010-FY2019)
52 51 54
53 +2.5%
117
102 CAGR
300 93 94
89 89 (FY2015-FY2019)
83 84 101 102 26%
+2.0%
200
CAGR
269 (FY2010-FY2019)
250 255 265 58%
235 239 241 240 222 226 -0.4%
100
CAGR
(FY2015-FY2019)
-2.0%
0
FY2010 FY2011 FY2012 FY2013 FY2014 FY2015 FY2016 FY2017 FY2018 FY2019
IFRS IFRS19
Investment Plan, and Financial and Capital Policies (1)
Capital Investment FY2017 FY2018 FY2019 FY2020
(bil. Yen) 5-Year Plan
Results Results Results Plan
◼ Domestic
Capital
- Investment aimed at saving labor and strengthening 150.0 36.3 52.0 57.6 49.2
Investment
safety/security management in the instant noodle
business, in the interests of sustained growth, etc. ◼ FY2019 Results ◼ FY2020 Plan
◼ Overseas - NISSIN FOOD PRODUCTS: - NISSIN FOOD PRODUCTS: Kansai
Kansai Plant Phase I and Plant Phase III
- Investment in strengthening production systems in
Phase II - NISSIN FOOD PRODUCTS: Ingredients
promising growth areas, etc.
- BonChi: New Yamagata Plant plant
◼ Group-wide
- NISSIN FOOD PRODUCTS: Frozen
- Investment in improvements/upgrades foods Shizuoka plant
- Overseas : Production line enhancement
Depreciation and Amortization through production increase
◼ FY2019 Reasons for YoY ◼ FY2020 Reasons for YoY increase
increase - Increase depreciation due to
- NISSIN FOOD PRODUCTS: impacts of application of IFRS 16
Operation of Kansai Plant Phase I (+3.2) FY2017 FY2018 FY2019 FY2020
(bil. Yen)
- BonChi: New Yamagata Plant - NISSIN FOOD PRODUCTS: Results Results Results Plan
Operation of Kansai Plant Phase I,
J-GAAP 15.4 17.9 - -
II and III
- NISSIN FOOD PRODUCTS: IFRS - 17.8 20.3 26.3
Ingredients plant
Cash Flow - NISSIN FOOD PRODUCTS: Chilled
and frozen foods Shizuoka plant Shareholder Returns
CF provided by operating activities Expected dividend payment: 11.4 bil. yen
Dividend per share (plan): 110 yen
(1H: 55 yen, Year-end: 55 yen)
Approx. 48.0 bil. yen
Cash Flow
Budget for investment
In the event of a shortfall in capital, usage
of cash and deposits, redemption of Capital investment: 49.2 bil. yen
investment securities and various type of
Business investment: Depends on deals
finance will be considered20
Investment Plan, and Financial and Capital Policies (2)
Shareholder Returns
(Dividends)
⚫ Dividend increase reflecting favorable financial performance, with an aim for achieving average payout ratio of 40% or above.
☝ FY2018 1H: 45 yen, Year-end: 45 yen, Total: 90 yen 5-Year FY2017 FY2018 FY2019 FY2020
☝ FY2019 1H: 55 yen (10 yen Increase), Year-end: 55 yen Plan Results Results Results Plan
(10 yen Increase), Total 110 yen (20 yen Dividend per Stable
Increase) 85 yen 90 yen 110 yen 110 yen
share dividend
☝ FY2020 1H: 55 yen, Year-end: 55 yen, Total 110 yen Payout ratio
Average
38.4%*1 32.2%*1 59.2%*2 44.1%*2
(Plan) 40% or above
*1 Based on J-GAAP *2 Based on IFRS
(Treasury stock)
⚫ Consider stock repurchase with agility according to changes in management and business environments
☝ FY2017 Executed stock repurchase in Nov.: 4,088,300 shares/ 22,935 mil. yen
☝ FY2018: Not executed
☝ FY2019: Cancelled 10% of the number of shares outstanding (May 24, 2018, 11,763,685 shares).
☝ FY2019: Consider the timing of stock repurchase, taking the market environment and business environment into consideration.
Strategic shareholdings
☝ Plan to reduce the number of shares held in view of increasing capital efficiency, and sold some of the shares in FY2017, FY2018 and
FY2019
☝ In FY2020, the Group will continue to consider the sale of strategic shareholdings in view of the market and business
environment. In accordance with internal investment rules, the Board of Directors is consulted over whether to continue to hold
the individual stocks.21
Market Capitalization
(bil. yen)
1,000
900 Market capitalization: Market base 866.9
Market capitalization: After deduction of treasury shares
800 803.3
724.8
694.2 791.6
700
621.4
768.5
600 546.8
515.1 642.2
500
428.3
400 369.6 369.4 363.6
344.4 651.5
571.5
300 513.1
483.1
410.8
200 354.5 341.0
348.0 324.5
100
0
2008/3 2009/3 2010/3 2011/3 2012/3 2013/3 2014/3 2015/3 2016/3 2017/3 2018/3 2019/3Essence of the MTBP FY2021(Initial)
23
24
Medium-Term Business Plan FY2021 : Target Figures
    Shift towards “profitability” from the current medium-term plan onwards
                                                                                                                                                     Becoming an
                                    Toward FY2016                                      Toward FY2021                                                   “EARTH
                                     “Evolution”                                       “Recognition” as                                                 FOOD
                                   towards a global                                    a global company                                               CREATOR”
                                      company
                                                                              Overseas operating                                         Overseas operating
                                                                                                          30% or higher                                              50% or higher
                               Overseas operating                              income ratio                                               income ratio
                                                          11%
                                income ratio
                                                                           FY2016                                                             FY2021
                                                                             Results                        (           Reference                )               Targets
                                                                             J-GAAP                         (            J-GAAP                  )                IFRS

 Earning           Sales/ Revenue                                         468.1         bil. yen            (        600.0         bil. yen      )         550.0            bil. yen

  power
 through
                   Adjusted Operating Income*1                               24.7       bil. yen            (          40.0        bil. yen      )             -            bil. yen

operations         (IFRS) Operating Profit                                                                                                                  47.5            bil. yen

                   Market Capitalization*2                                570.0         bil. yen
                                                                                                                                                                 1          tri. yen

 Value in
                   Net Income/ Net Profit*3                                  26.9       bil. yen
                                                                                                                                                              33.0          bil. yen

                                                                                                                                                                            % or
  capital          ROE                                                         7.4      %                                                                        8          higher
 markets
                   (J-GAAP) Adjusted EPS*4                                    196       yen                                                                      -          yen

                   (IFRS) Adjusted        EPS*5                               189       yen                      CAGR 10% or higher                           330           yen

                                                                                                         Payout ratio: 40% or higher on the average for the five-year period
     *1: Only under the J-GAAP: Adjusted operating income = Operating income under the J-GAAP - Impact of retirement benefit expenses
     *2: Market capitalization = Share price × Shares outstanding at end of year (excluding treasury stocks)
     *3: “Net income attributable to owners of parent” under the Japanese GAAP, “Profit attributable to owners of the parent” under IFRS
     *4: Adjusted EPS(J-GAAP)=Adjusted Operating income after tax + Equity earnings of affiliate companies + Amortization of goodwill (Including those contained in the equity
         method subsidiaries) - Net income attributable to non-controlling interests /Average number of shares outstanding (excluding treasury stocks)
     *5: Adjusted EPS = (IFRS Operating profit ± Other income, expenses ‐Tax expense - Profit attributable to non-controlling interests) / Average number of shares outstanding
         (excluding treasury stocks)
         The FY2016 values were estimated because there is no individual data.
Medium-Term Business Plan FY2021: Change in KPIs 25
(Segment Information)
⚫ Changes to Segment Targets Associated with the Shift to the International Financial Reporting Standards (IFRS) from Q1,
FY2019
FY2021
(IFRS) Revenue 550.0 bil. yen
Earning power (IFRS) Operating Profit 47.5 bil. yen
through
operations OP margin 8 % or higher
Ratio of operating profit from overseas business 30 % or higher
(Domestic) (Overseas)
FY2021 FY2021 FY2021 FY2021
(bil. yen) J-GAAP IFRS (bil. yen) J-GAAP IFRS
Plan Plan Plan Plan
Revenue 297.6 243.0 Revenue 80.8 80.8
Instant The
Operating Profit 29.5 29.1 Operating Profit 6.4 6.4
Noodles Americas
OP margin 9.9% 12.0% OP margin 7.9% 7.9%
Revenue 132.3 111.6 Revenue 53.7 53.7
Chilled/ Frozen,
Operating Profit 5.2 5.2 China
Confectionery, Operating Profit 5.1 5.1
Beverages (incl. H.K.)
OP margin 3.9% 4.7% OP margin 9.5% 9.5%
Key currency exchange rates assumed in the plan Revenue 24.1 24.1
Exchange rate (yen per unit of currency) Asia Operating Profit 0.5 2.0
Currency
FY2016 FY2021
OP margin 2.2% 8.3%
US$ 120.14 112.68
Revenue 8.3 8.3
BRL 30.60 28.00
CNY 18.85 17.39
EMEA Operating Profit 0.8 2.4
HK$ 15.49 14.53 OP margin 9.4% 28.9%
EURO 134.31 131.77
* Based on exchange rates as of the date of the creation of the mid-term plan
* The values for targets for the China segment are those expected by NISSIN FOODS HOLDINGS.26
Medium-Term Business Plan FY2021: Investment
Investment
Use capex and business investment by controlling them within the total amount of
250.0 billion yen for the five-year period of the medium-term plan
Capital Investment Business Investment (M&A)
FY2017-FY2021 (Plan) 150.0 bn yen FY2017-FY2021 (Plan) 100.0 bn yen
(Policy)
• Domestic: Investment aimed at saving
labor and strengthening safety/security
management in the instant noodle
business, in the interests of sustained
growth, etc.
• Overseas: Investment in strengthening
production systems in promising growth
areas
• General: Maintenance and upgrades27
Medium-Term Business Plan FY2021:Key Strategy Themes to Achieve Targets
◼ Focusing on five key themes in pursuit of business profitability
Domestic Overseas
1
Next Promoting
Instant noodles
stage Global Branding
3 2 Focusing on priority
Business
Laying stronger overseas locations
foundations for our
domestic profit base
4
products
Other
Establishing a second
pillar that generates
revenue and profits
5
Developing and strengthening
Platforms human resources for global
management28
Strategic Theme 1 Promoting Global Branding > Globalize CUP NOODLES
Actively rolling out CUP NOODLES, as a high value-added product that makes the most of
our strengths, to young people with a certain standard of living, in order to improve overseas
profitability
Sales price trends in Margin trends in
each country each country
x1.5 – 4 Approx. x2
Bag- CUP Bag- CUP
type NOODLEs type NOODLEs
[High margin] Worldwide population Middle-income population
CUP NOODLES > Bag-type instant noodles of young people in emerging countries
No decline in Increase
[Expanding target market] number of
young people
of 40% in
10 years
Young people with a certain
2015 2020 2025 2030 2010 2015 2020
standard of living
Rolling out global flavors (examples)
Seafood Tom Yum Goong
[NISSIN’s strengths]
Production technology and quality
control capabilities, based on expertise
in noodles, soup, ingredients,
containers, etc. Japan Hong Kong Thailand Japan29
Strategic Theme 1 Promoting Global Branding > Approach
• Approaching clearly defined target markets with initiatives including design, flavor and
promotion with the aim of expanding more efficiently and effectively, and increasing
overseas CUP NOODLES sales (units) by 50%
Overseas CUP NOODLES sales (units) in FY2021: Up 50%
(Compared to FY2016)30
Strategic Theme 2 Focusing on Priority Locations: BRICs
• As markets continue to grow in scale and standards of living continue to improve, we have
earmarked BRICs as priority locations where we expect to achieve growth by harnessing
NISSIN’s strengths in each area.
Income*1 to be generated in the priority
overseas locations accounts for: Approx. 70% in FY2021
(in income from overseas business)
Total demand for instant Middle-income population
noodles (unit basis)*2 in emerging countries*3
BRICs
Approx. 50% increase
in 10 years
Others Total global BRICs BRICs
demand Approx.
47% 102.7 billion 53%
70%
units
2010 2015 2020
BRICs Others
*1 Income = Operating income + Equity method income *2 Source: WINA/2014
*3 Source: NISSIN estimates based on data from various sources31
Strategic Theme 2 Focusing on Priority Locations: BRICs – China and India
✓ China: Making the most of our leading share of the growing market for upright cup-type noodle products
to expand our sales area
✓ India: Stepping up promotion of CUP NOODLES to rapidly growing population of middle-income earners,
as well as tapping into growth in bag-type instant noodle products
China India
Scale of market for Indo Nissin sales (units)
Market environment upright cup-type Market environment year on year*2
noodle products*1 (Jan-March)
◼ Thriving market for upright cup- Average annual ◼ Underlying recovery following a
type instant noodle products, growth rate one-off significant contraction
39% Up approx.
with significant growth year on due to market turmoil last year 100%
year ◼ Anticipated growth in cup-type
◼ Continuing trend towards noodle market in the future due
growth in middle-income to increase of middle-income
earners, particularly in urban earners
areas
Opportunities for NISSIN 2013 2014 2015 Opportunities for NISSIN 2015 2016
◼ Holding approx. 60% share of ◼ Our sales up 100% year on
the upright cup-type noodle year even after the
market comeback of the leading
◼ Still room for growth through manufacturer
expansion of sales area ◼ Growth being backed up by
food safety initiatives
Most popular: 2nd most popular: ◼ Still small scale, but NISSIN TOP CUP
Seafood Five-spice beef has a leading share of the RAMEN NOODLES
cup-type noodle market
*1 Source: Nielsen 2015 *2 Source: Internal data32
Strategic Theme 2 Focusing on Priority Locations: BRICs – Brazil and Russia
• Establishing strong foundations as market leader in both Brazil and Russia
✓ Brazil: Building on strong foundations to reinforce CUP NOODLES and establish a base of operations for
expansion into South America
✓ Russia: Strengthening support structure in order to secure an even greater market share and increase
income
Brazil Russia
Market share* Market share*
Market environment Market environment
◼ Total demand of 2.4 billion units ◼ Total demand of 2.0 billion
(10th place worldwide) Others units (11th place worldwide)
◼ Cup-type noodle market still 36% NISSIN ◼ Cup-type noodle market Others Mareven
accounts for around 4% - accounts for around 25% 54% 46%
64%
plenty of room for further
growth
Opportunities for NISSIN Opportunities for NISSIN
◼ Mareven Food (JV) has
◼ Capitalizing on Brazil NISSIN’s
excellent brand recognition
overwhelming market share to
develop cup-type noodle market Nissin Lamen ◼ Powerful nationwide sales and Rollton (bag)
delivery network
◼ Plans to launch a new CUP
NOODLES promotion project in fall ◼ Still scope for growth through
2016 increased cooperation on
technology, product development,
etc.
CUP NOODLES Rollton (tray)
*Source: Nielsen 201533
Strategic Theme 3 Laying Stronger Foundations for our Domestic Profit Base
Developing the domestic instant noodle market further, investing in sophisticating plants to
improve food safety and production efficiency, and achieving stable profit over the long term
Operating income from domestic JPY 29.5 bn*
JPY 25.3 bn
instant noodle business (FY2016 Actual) (FY2021 Plan)
Develop the domestic instant noodle market further Investing in sophisticating plants
Product proposals/communication aimed at specific Rebuilding aging facilities, with an eye to restructuring
target market domestic plants
◼ Encouraging the “next generation” ◼ Further improving food safety and security
Successful communication with young generation: ◼ Cutting costs by saving labor, conserving energy and
trend towards more experience of and interest in manufacturing in-house
eating noodles amongst target market
Kanto Plant
45 years old
Shiga Plant
◼ Encouraging female ◼ Tapping active seniors 43 years old
consumers
Shizuoka
Plant
Shimonoseki Plant
20 years old Using robots to put
41 years old
… etc. deep-fried tofu in bowl
Creating a “Century Brand Company”
*Operating income for FY2021 Plan is based on J-GAAP. IFRS will be adopted from 1Q of FY2019. So, based on IFRS, operating profit for FY2021 Plan is JPY
29.1 bn.Strategic Theme 4 Establishing a Second Primary Revenue Source: 34
Confectionary/Cereal Business
• As well as growing brands organically, we intend to strengthen cooperation to achieve
greater synergy, expand overseas operations and make the most of M&A, with the aim of
increasing sales to JPY 100.0 billion, including partners.
◼ Stepping up cooperation between three existing companies
- Appointing outside executives to oversee the
NISSIN CISCO confectionery business
- Promoting groupwide cooperation on sales, marketing,
procurement, etc.
◼ Launching overseas expansion initiatives
- Building on NISSIN’s overseas business foundations to
expand confectionery operations
- Strengthening import and export business
No.1 best selling Rapidly Brand with ◼ Making the most of M&A to expand strong brands even
cornflakes growing over 50 further
(unit base) major brand years history
(Sales)
JPY 100 bn
Additional
KOIKE-YA Inc. Organic growth centered initiatives
Bonchi around Japan
Approx. M&A,
JPY 65.0 bn imports,
Alliances
Vision
exports, etc.
Consolidation
Brand with
over 50 No.1 for No. 1 for
years history spicy flavors sour flavors
FY2016 FY2021Strategic Theme 4 Establishing a Second Primary Revenue Source: 35
Chilled and Frozen Food Business/Beverage Business
• Building on efforts to establish brands throughout the previous medium-term period in
order to increase profit growth domestically
NISSIN CHILLED FOODS
NISSIN YORK
No.1 value- No.1 in Tsukemen No.1 two-serving
added ramen (dipping noodles) yakisoba
noodles category (fried noodles) No.1 in
convenience
store channel
NISSIN FROZEN FOODS
No.1 in regular No.1 in fresh No.1 in spicy Japan’s first
category pasta category category drinking yoghurtStrategic Theme 5 Developing and Strengthening Human Resources for Global 36
Management
Having established a platform-based support structure, we intend to increase management
human resources and accelerate global management in the future, based on both human
resource development measures within the group and recruiting externally.
Expanding our pool of
management human resources
100 people 200 people Key posts
x2
(FY2016) (FY2021)
43
• Selection-based in-house (FY2021)
university program
• Promoting diversity
• Overseas trainee schemes Posts in FY2016
etc. 2016 2016 Posts added under
current medium-
19 6 term plan
Chief
representatives/ Business
Business companies
companies
Strengthening human
resources for global
management 2021 2021
• Recruiting external 24 Support 7
management
Chief
representatives/
Business
human resources Business companies companies
familiar with local 12
markets Platforms
• Developing local executive
employees
• Strengthening global capabilities
amongst management human Having established a global support structure
resources built on NISSIN’s expertiseSection 2 Domestic Business Strategy
38
NISSIN’s Position in Instant Noodles Industry in Japan

               Market Share of                                             NISSIN’s Domestic Instant Noodles Biz
         NISSIN FOODS GROUP: 52%                                              Twice as much as 2nd player’s
         Sales base,                                                  (JPY bn)   Sales (Instant Noodles in Japan)
the year ended March 31, 2018                                          300           NISSIN’s Instant Noodles Sales in Japan
                                                                                     2nd player’s Instant Noodles Sales in Japan
                                                                       250
        FY2018                   Acecook                               200
                                  8.0%                                 150
                                                                       100
                             Sanyo
                                                                        50
                             15.0%
                                              NISSIN FOOD      0
                                                                    FY2014     FY2015      FY2016 FY2017        FY2018   FY2019
                                 Toyo Suisan    PRODUCTS
                                                  43.5%   (JPY bn) OP and OPM (Instant Noodles in Japan) (%)
                                    24.8%                                                          NISSIN’s OP in Japan
                                           MYOJO            35           NISSIN’s OPM in Japan    2 player’s OP in Japan
                                                                                                                      nd
                                                                                                                               12.0
                                            FOODS           30                                                                 10.0
                                             8.0%
FY2013                                                      25
                                                                                                                                               8.0
                                                                      20
                                                                                                       2nd player’s OPM in Japan               6.0
                                                                      15
      Total                                  NISSIN FOODS             10
                                                                                                                                               4.0

  24% 48%                                      Group Total             5                                                                       2.0

                                                 51.5%                 0                                                                0.0
                                                                             FY2014  FY2015   FY2016     FY2017     FY2018    FY2019
   Note: MYOJO FOODS is a 100% subsidiary of NISSIN FOODS
                                                              (Sources: NISSIN: NFP+MYOJO, 2nd Player: Domestic instant noodles segment )
    (Source: Nikkei Value Search )                                                   Fiscal Year (FY) ended at March 31 of each year, J-GAAP bases

             Annual demand in volume: 5.78 billion, Annual consumption in Japan : 45.7 servings/person
                (Population of Japan: 126.5 mil Source: WINA (January 2018 - December 2018) ,IMF(population)
39
Power of NISSIN’s Brands in Japan
NISSIN is ranked No. 3 in Japan Brand Recognition Ranking
Consumer Market (B to C), appraised by general consumers in 2019
2010: 11th TV Commercial
2011: 5th Success
Brand ranking 2012: 8th
2013: 9th TV Commercial Likability
1 Amazon 2014: 17th Rating in FY2019
(April 2018 - March 2019)
2015: 3rd
2 YouTube Corporate
2016: 25th
3 NISSIN 2017: 6th 1 KDDI
2018:7th
4 MUJI 2 SoftBank
2019:3rd
3 NTT docomo
5 Google
2010: 30th 4 Coca –Cola
6 TOYOTA 2011: 27th
2012: 14th 5 Kao
7 NITORI 2013: 15th 6 NISSIN FOODS
8 DAISO 2014: 21st 7 P&G
2015: 24th
9 SUNTORY 8 Recruit
2016: 7th
2017: 5th 9 Hazuki Company
10 Rakuten
2018:52th 10 Kirin
Source: Brand Japan, 2019:22nd
NIKKEI BP Consulting
Among 1,000 brand names, “Brand Japan,” a
renowned survey company, makes a ranking list by Source: CM Soken Consulting
using four indicators: Friendliness, Convenience,
Uniqueness and Innovativeness40
Growth Strategy of Instant Noodles Business-1
Solid growth opportunities Population Pyramid in Japan
Years old
Male Female
✓ Increase core target pool and 95-
90-94
approach to new customer
85-89
targets of cup-type noodles 80-84
75-79
New Generation
Core Target 70-74
Ages from 10-19 65-69
60-64
“Active Senior” 55-59
Senior gen. enjoying an 50-54
economically affluent active life 45-49
40-44
35-39
30-34 Current
Female 25-29
Core
Target
20-24
15-19
10-14
“Next Generation” 5-9
Young gen. which is expected to 0-4
expand our core target pool -10%
5%
-5%
0%
0% 5%
5% 10%
%: Population of each bracket / Population total
Communication tailored to next generation Source: Bureau of Statistics, Ministry of Internal Affairs and Communications. Figures in Oct. 1 st, 2014
-TV commercials
-SNS
-Web ads41
Growth Strategy of Instant Noodles Business-2
“Active Senior” Female
Senior gen. enjoying an
economically affluent active life
Featuring ethnic flavor
Targeting for active senior and health conscious consumers
targeting at female
“Next Generation”
Young gen. which is expected to New Generation
Core Target
expand our core target pool Ages from 10-19
Communication tailored to next
generation
-TV commercials
-SNS
-Web ads
Brand extension42
Core Brands of NISSIN FOOD PRODUCTS
CHICKEN RAMEN, CUP NOODLE and DONBEI achieved
Record-high revenue for FY2019.
Since 1958 Since 1971 Since 197643
Growth Strategy of NISSIN’s Domestic Other Businesses
◼ Confectionery and Cereal ◼ Chilled and Frozen Noodles
Granola Focusing on high value-added products in
competitive markets by leveraging our accumulated
.
50.0 noodle-related expertise.
43.3
40.0 36.9 39.3
30.0 24.5
20.0 . 37.0
14.6
10.0 4.9 6.1 9.4
0.0
2010 2011 2012 2013 2014 2015 2016 2017 2018 Chilled and frozen noodles are businesses operated by
Source:Japan Snack Cereal Foods Association NISSIN CHILLED and NISSSIN FROZEN, respectively.
Biscuit (sablé)
Long-seller product since 1965 with ◼ Beverages
renewed brand image.
Lactobacillus and yogurt drink
Granola and biscuit businesses are
operated by NISSIN CISCO Co., Ltd.
Cultivate value strategy to add
Deep-fried rice cakes an appeal with “Food for
.
Specified Health Uses”
Making “BonChi Co., ” one of the major The first drink
rice cracker companies, a consolidated yogurt launched in
company since the 1st quarter of this fiscal Japan and still
year
. ended March 31, 2017 growing
Potato chips
Owning 34.53% of “KOIKE-YA Inc. ” a
second largest potato chips player and Beverage business is operated by NISSIN YORK Co., Ltd.
joining forces to expand its business.Section 3 Overseas Business Strategy
45
Global Demand Trend of Instant Noodles

 Unit: Billion servings
 120.0

                   Worldwide: Approx. 103.6 bil. servings
                                                                                             106.0104.0
                                                                            98.2 101.8                        97.5 97.5 100.1 103.6
 100.0
                                 92.1 94.7 91.3 92.2 95.9
                          86.0
  80.0
                  80.0
         69.8

  60.0

  40.0

  20.0

   0.0
         CY2003 CY2004 CY2005 CY2006 CY2007 CY2008 CY2009 CY2010 CY2011 CY2012 CY2013 CY2014 CY2015 CY2016 CY2017 CY2018

     (Source: World Instant Noodles Association) (Jan.- Dec.)
     Figures up to CY2013 might not be exactly correct since WINA restates and endorses only past five years including the latest year.
46
Cup Composition Rates and GDP/Capita
U.K. Mainland China H.K. Worldwide Average
Russia Cup-type
16% 22%
47% 26%
53% 27% Bag-type
73% 78%
74% 84%
Korea
US$ 42,558
US$ 11,327 GDP/capita -
US$ 48,514
US$ 9,608
34% 33% U.S.A.
67%
34%
India US$ 31,346 66%
1% Mexico
US$ 62,606
4%
99% Japan
96%
US$ 2,036
31%
69% US$ 9,807
US$ 39,306
Thailand Philippines Brazil
Vietnam
15% Singapore Indonesia 3%
5% 11%
85% 15% 7%
95% 97%
85% 89%
US$ 7,187 93%
US$ 2,551 US$ 8,968
US$ 64,038 US$ 3,871 US$ 3,104
(Volume Base, Source: World Instant Noodles Association in CY2018) (Jan.- Dec.)(GDP/Capita, Source: IMF website)47
CUP NOODLES Strategy- 1
Actively rolling out CUP NOODLES, as a high value-added product that makes the most of
our strengths, to young people with a certain standard of living, in order to improve overseas
profitability
Sales price trends in Margin trends in
each country each country
x1.5 – 4 Approx. x2
Bag- CUP Bag- CUP
type NOODLEs type NOODLEs
[High margin] Worldwide population Middle-income population
CUP NOODLES > Bag-type instant noodles of young people in emerging countries
No decline in Increase
[Expanding target market] number of
young people
of 40% in
10 years
Young people with a certain
2015 2020 2025 2030 2010 2015 2020
standard of living
Rolling out global flavors (examples)
Seafood Tom Yum Goong
[NISSIN’s strengths]
Production technology and quality
control capabilities, based on expertise
in noodles, soup, ingredients,
containers, etc. Japan Hong Kong Thailand Japan48
CUP NOODLES Strategy- 2
• Approaching clearly defined target markets with initiatives including design, flavor and
promotion with the aim of expanding more efficiently and effectively, and increasing
overseas CUP NOODLES sales (units) by 50%
Overseas CUP NOODLES sales (units) in FY2021: Up 50%
(Compared to FY2016)49
Overseas Expansion(wholly-owned/equity-method/investing)
As of June 30, 2019
The Americas
The U.S.
Mexico
Brazil
China
Hong Kong
Main Land China
EMEA
Europe Asia
Russia Singapore
(equity-method)
India
Thailand
Viet Nam
Philippines
(equity-method)
Thailand
(equity-method)
Due to the adaption of IFRS from Q1 FY2019, operating profit includes non-amortization of goodwill
(including affiliates accounted for using equity method), gain (loss) on investments
accounted for using the equity method, and extraordinary gains and losses.50
Relationship with Premier Foods plc
⚫ March 24, 2016
Entered into a conditional co-operation agreement with Premier Foods plc
: on utilization by both parties of their respective distribution networks, joint development of products,
cooperation in research and development, manufacture by one party of the other party's products and
others.
⚫ Pursuant to the terms of the conditional co-operation agreement,
NISSIN FOODS HOLDINGS has the right to appoint a non-executive director to the Board of Premier for
so long as it holds an interest in shares representing 15 percent or more of the ordinary issued share
capital of Premier.
- As of March 23, 2018, Shinji Honda is appointed as a non-executive director and as NISSIN’s
managing executive officer(CSO).
- Percentage of shares acquired: 19.6% (As of March, 2019)
⚫ February 2017
Super Noodle in Pots is one of the first successes of NISSIN’s collaboration with Premier Foods.
They are available in the classic Super Noodles flavors - Chicken, Curry, Bacon and BBQ Beef.
Outline of Premier Foods
Name: Premier Foods plc
Location: Hertfordshire, UK
Business: Production and distribution of processed foods, cooking source and confectionary51
Growth Drivers by Geographical Area
(JPY bn)
Fiscal March March March March March March March
Year 2016 2017 2018 2018 2019 2020 2021
(Actual) (Actual) (Actual) (Actual) (Actual) (Forecast) (Mid-term Growth Drivers
J-GAAP J-GAAP J-GAAP IFRS IFRS IFRS Plan)IFRS
Sales/
48.3 60.4 64.5 62.5 63.4 64.0 67.5 Brazil:
Revenue ✓ Significant growth by
The
expanding cup-type
Americas
OP/OI 1.1 2.3 2.0 2.4 -5.2 27 3.7 noodle market through
CUP NOODLES strategy
Sales/ CUP
Revenue
40.9 36.0 42.6 40.1 41.4 44.5 47.0 Mainland China: NOODLES
China ✓ Secure dominant market
Strategy
(incl. H.K.) share in the growing
OP/OI 4.1 3.4 3.6 4.1 3.8 3.8 4.7 premium instant noodle
market
Sales/ India: Growth potential
7.2 9.0 9.4 9.2 11.4 11.7 13.0 backed up by vast
Revenue
population and middle-
income earners at 8
Asia metropolitan cities
OP/OI (2.0) (1.4) (1.4) (0.4) 1.8 2.5 2.7 Thailand: CUP NOODLES
sales grow thanks to the
change of retail industry
Sales/ ✓ Under the transition
4.6 4.6 5.9 5.9 6.8 7.0 7.5
Revenue period from stable profit
EMEA base to expansion of
OP/OI (0.4) 0.0 (0.5) 0.2 0.6 1.0 1.3 sales and profit
In light of changes in the business environment and the issues of each region/business, we have revised segment targets for March 2021.52
Brazil: Overview of Business
History of Brazil Business
1965 Local instant noodles company was established by Taiwanese (Named “MIOJO AIMENTOS”)
1972 Capital injection from Ajinomoto Co., Ltd.
1975 Capital injection from NISSIN FOODS HOLDINGS →JV btw. Ajinomoto & NISSIN (55:45)
1983 Change in ownership (50:50) and name: NISSIN AJINOMOTO ALIMENTOS LTDA.
2002 Started to manufacture cup-type instant noodles
2013 Started operation of new factory, “Gloria do Goita”
2015 (October) Became a 100% subsidiary of NISSIN by acquiring 50% for 32.5 billion yen
Financial Performances of NFB*1 Instant Noodles Market Transition
(Million Brazilian Real) (Source: World Instant Noodles Association) (Jan.- Dec.)
Dec. March Billion serving Serving per capita
FY 2014 2019 (bar chart) (line chart)
(J-GAAP) (IFRS) 2.5 14.0
12.0
2
Approx. Approx. 10.0
Sales
700.0 ×1.2 1.5 8.0
1 6.0
*1: NFB =NISSIN FOODS DO BRASIL LTDA. Market size: 11.4 servings 4.0
0.5 2.37 bil. per capita 2.0
The operating income margin is expected to be
above 9% in the fiscal year ended March 2020. 0 0.0
We target to achieve 10% for the medium term.
Note: Up until FY2015, fiscal years of NFB had been from Jan. to Dec.
From FY2016, its fiscal term has been changed to “from April to March”53
Brazil: Overview of Business
NISSIN’s market share (unit base) Cup/Bag instant noodle composition (unit base)
Worldwide average Brazil market
◼ BRAZIL NISSIN CY2016 CY2020
◼ Others Cup type
3%
28% 21% Cup type US$9,895
62% 10%
Bag type 79%
Overwhelming share Growth potential
Bag type Relatively high GDP per capita
Source: NISSIN CY2018 97%
[ Average of world market CY2016 ] [ Brazil market CY2016→CY2020 ]
Source: NISSIN Source: NISSIN Source: Calculated by NISSIN
Economy seemed to hit the bottom
Contributed by CUP NOODLES sales expansion
New CUP NOODLES was launched in Sept. 2016
BRAZIL NISSIN
Approx.
• High name recognition as No. 1 player Sales (BRL)
+40%
• Offer food sampling to have consumers
realize its quality and value
• Have consumers feel a sense of familiarity
to the product by leveraging social media
Gain a good response and confidence mainly
in cities in southeast and south areas
Capabilities in technology and
Enhance marketing 14/3 15/3 16/3 17/3 18/3 19/3
product development54
China: Overview of Business
100 million
Instant noodle market (unit base) Instant noodle market of tall cup-type
servings
444
(unit base)
450 404.3 402.5
385.2 389.6
400
350
300
1.4 bil. people 250
200
Large population 150
100
40.3 bil. 50
0
servings/year CY2014 CY2015 CY2016 CY2017 CY2018
◼ Source: WINA/2018 Source: WINA/2018 3/15 3/16 3/17
Large demand Expanding tall cup-type
Getting Shrinking-instant
(Instant noodles) instant noodles market size
noodles market moving again
Increased 70%
◼ inSource:
2 yearsNISSIN
Hong Kong Mainland China ◼ Source: NISSIN
• Further improvement of business base
• Brand development in the rapidly growing
through business diversification
premium market
• Further penetration of CUP NOODLES brand
• Expansion of sales and distribution networks
• Business diversification (manufacture and
Instant noodles Frozen Foods Potato chips sale of potato chips)
Joint venture with
Kagome, a fruit beverage • Quality control that is characteristic of a
manufacturer(from July Japanese company
2018)
Listed on the Hong Kong Stock Exchange Main Board (December 11, 2017)
*The management policy of the China segment is a role expected by NISSIN FOODS HOLDINGS.55
China: Production Capacity Enhancement and Sales Offices
⚫ 35 sales offices and 6 admin. offices in distributor’s offices
as of March 2019
Large portion of each amount below is
to be appropriated for capital investment.
Zhejiang Plant Manufacture instant noodles
Completed in May 2017
(浙江日清)
Approx. 5.7 bil. yen
Fujian Plant Manufacture instant noodles
(福建日清) In operation from April 2016
Approx. 4.0 bil. yen
Guangdong Plant
(広東日清)
Manufacture packaging materials
Dongguan Plant In operation from May 2015
(東莞日清)
Approx. 2.4 bil. yen
Zhuhai Plant
(珠海永南) Winner Plant
NISSIN Plant in H.K. (Cup) (永南食品)
NISSIN Plant in H.K.
(香港日清 グラノーラ) (香港日清 カップ麺)
Manufacture granola with NISSIN Plant in H.K. (Bag) Manufacture instant noodles
products sales having In operation from April 2017
commenced in January 2019
(香港日清 袋)
Approx. 6.0 bil. yen
HK$30.0 million
*The management policy of the China segment is a role expected by NISSIN FOODS HOLDINGS.56
India: Overview of Business
8 metropolitans Population Instant noodle market size
(unit base)
2011 Extended UA (000’ people) 100 million
servings Industry-wide
1.3 bil. Delhi 21,753 70.0
60.0
voluntary recall
people Greater Mumbai 20,748 50.0
40.0
Kolkata 14,618
Large population 30.0
Chennai 8,918 20.0
10.0
Bangalore 8,729
0.0
Growth rate Hyderabad 7,749
7.2% Ahmedabad 6,352
High rate of economic growth Pune 5,050 Recovery from industry-wide voluntary recall
Source:“INDIA STATS : Million plus cities in India as per Census 2011
Expected growth rate: more than 10%
Population concentration in metropolitans
Source: WINA/2018
Expand sales of bag-type noodles
• Increased coverage ratio after the industry-wide Cup Noodles with Japanese quality
voluntary recall launched
11INR 22INR • Sales growth supported by the large population
• Introduction of “SEAFOOD”, which is a
• Growth potential seen in the low eating rate global flavor, in October 2017
Further penetration of the CUP NOODLES
50INR • Expansion in large cities where high and middle Seafood
income households are concentrated
50INR
• Development in public facilities such as airports
• An increase in brand recognition and repeat
45INR customers57
Promote local personnel to senior executives in major overseas areas
Build local area-based strategies based on management familiar with
culture and business customs, etc.
INDO NISSIN FOODS PRIVATE LTD. President: Gautam Sharma Since Jan. 2014
He has worked for several global consumer goods manufacturers and until recently served as the president of a local Indian
subsidiary of a leading U.S. manufacturer. He has enormous connections in India and developing more attractive new products
tailored to local tastes.
NISSIN FOODS (U.S.A.) CO., INC. President: Michael J. Price Since Oct. 2018
He worked for a leading food company in the U.S. for many years. Served as the general manager of divisions for the
beauty and restaurant businesses. Joined NISSIN FOODS (U.S.A.) in 2015. Served as Vice President in charge of
the sales division. Took office as president.
NISSIN FOODS DE MEXICO S.A. DE C.V. President: Luis Javier Gomez Martinez Since Sep. 2017
He worked in sales, logistics and marketing for many years at a food and consumer goods manufacturer in Mexico.
He also has extensive management experience.58 Developing and Strengthening Human Resources for Global Management ◼ Global training, etc. of the NISSIN FOODS Group “Brand marketing in the digital age” (2016 - ) • It consists of three parts: “What is CUP NOODLE?” “Mechanism of brand marketing in the digital age” and “Workshop.” • We provide the training by visiting Brazil, the United States, India, Mexico and Asia. “Global IT meeting 2019” (Nov.11-12, 2019) • Eleven overseas IT managers including those in charge at overseas companies discuss their activities and issues in sessions related to IT vision, IT strategy, and security. “Survival training on a deserted island” for new management level employees (Aug.29-31, 2019) • 27 new management-level employees of Group companies in Japan, and 4 management-level employees in local subsidiaries in the China/Hong Kong segment participated in the training on a deserted island. “Global Finance meeting 2018” (Nov.12–15, 2018) • Financial training for 15 employees including those in charge of accounting overseas.
You can also read


