Property Watch - Property Industry Ireland
←
→
Page content transcription
If your browser does not render page correctly, please read the page content below

Property Watch Q2’16
From Property Industry Ireland, the most influential property organisation in Ireland

Inside this Issue:
Government launches wide-ranging Housing
Action Plan with a supply target for
the private housing sector of
25,000 per annum by 2020

Census 2016 shines light on housing shortages
with low growth of the housing stock and almost
260,000 vacant houses

Dublin prime office rents the eighth most
expensive in Europe with rents at around
€619 - €643 per m2

Investment turnover highest on record
in Q2’16, with the acquisition of
Blanchardstown Centre resulting
in turnover of
€2.2 billion

AIB - a key player in the Irish real estate investment market
AIB is actively supporting home buyers, SMEs, corporates, developers and investors in the property market

Introduction            One of the main purposes of Property Watch is to make
                        the Irish property market as transparent as possible. It
                        provides a handy map for those looking to find the
                                                                                      Approximately 50% of house sales in Ireland are funded
                                                                                      without a mortgage. Therefore, the CSO Residential
                                                                                      Property Price Index is only counting half the activity in
                        sources of the most recent information on all parts of        the housing market in any month.
The improved coverage   the property sector.
                                                                                      In September, the CSO will launch a new Residential
of the CSO Property     Access to timely and accurate data on the property
                        market is vital both for policy-makers and potential
                                                                                      Property Price Index (RPPI) for Ireland. The new
                                                                                      property price index will be based on Stamp Duty
Price Index from        investors to make informed decisions. Of course,
                        published data on market activity is backwards looking
                                                                                      returns made to the Revenue Commissioners and
                                                                                      will now cover all market purchases of houses and

September will mean     and can – at best – give a snapshot of an often very
                        fast-moving sector, but, when used properly, a
                                                                                      apartments by households, both cash and
                                                                                      mortgage-based transactions.

better house
                        collection of facts and figures will always give a
                        better indication of future trends than anecdotes             This will undoubtedly help increase the accuracy of the
                        and guesswork.                                                data which is put into the public domain. Interestingly,
price data              In Ireland, we remain heavily indebted to the estate
                                                                                      the CSO notes that the physical characteristics of the
                                                                                      dwellings will be obtained by matching the Stamp Duty
                        agencies who publish statistics from their own                returns with Building Energy Rating (BER) certification
                        transactions to provide that information. A leaf through      data provided by the Sustainable Energy Authority of
                        Property Watch shows that, without the support of             Ireland (SEAI). Locational characteristics of the
                        estate agency firms, our knowledge of the market would         dwellings will be obtained by matching to the
                        be severely limited. Of course, there are still gaps in the   GeoDirectory and Census 2011 Small Area Population
                        data, and I hope that Property Watch will give agencies       Statistics (SAPS).
                        an indication of where there is a gap in the publicly-
                        available market information which they can fill.              Houses, by their nature, are seldom identical. As
                                                                                      generations of owners make their mark on a property, it
                        One of the most newsworthy property datasets is the           looks less and less like its neighbour’s and so its market
                        monthly Residential Property Price Index, published by        value will never be identical to that in the same
                        the CSO. It is designed to measure the change in the          neighbourhood or even the same street. There is an
                        average level of prices paid for residential properties       inherent danger in trying to determine the price trends
                        sold in Ireland. While the monthly report inevitably          of all houses or apartments in Ireland. Therefore, a
                        gathers massive media coverage, especially when the           larger sample size is vital to ensuring that the individual
                        monthly headline figure shows a severe escalation or           characteristics of the houses sold each month can
                        drop in house prices, very few people investigate what        be accounted for.
                        the CSO actual measures.
                                                                                      Dr Peter Stafford
                        It is compiled using data on mortgage drawdowns               Director, Property Industry Ireland
                        provided on a monthly basis by eight of the main
                        mortgage lending institutions. The data is recorded at
                        the point at which the sale occurs, so it gives a fairly
                        timely report on what is taking place. However, as the
                        CSO itself acknowledges, “not all residential property
                        transactions are funded by a mortgage (i.e. they are
                        cash based) and these transactions are excluded
                        from the scope of the index.”

                                                                                                                                                    2
Property                             Irish employment levels breaking the 2 million barrier
                                     in Q2’16 for the first time since Q4’08 is one factor
                                                                                                 of European cities. If this upward trend continues, this
                                                                                                 development could damage the city’s competitiveness.

Overview
                                     explaining the robust activity in the property market.
                                     With employment growth recorded in twelve out of            The notable difference outside of Dublin is the level of
                                     fourteen sectors across the economy and an additional       office rents. There is a strong development pipeline
                                     56,200 persons at work over the past year, this will have   in Cork where prime rents are less than half the
                                     lifted consumer confidence, increased incomes and            corresponding levels in Dublin, while in Galway, where

Rising rents at risk of              resulted in more spending and investment. This is all
                                     good news for the property market.
                                                                                                 rents are almost 25% lower than in Cork, the office
                                                                                                 market was exceptionally quiet in Q2. Activity in the
                                                                                                 Limerick office market was subdued, with take-up
damaging Dublin city’s               The housing challenge continues as supply edges
                                     upwards. The strong growth in commencements - up
                                                                                                 levels almost unchanged. Of the four main markets,
                                                                                                 prime rents are lowest in Limerick at €172/m².

competitiveness
                                     49% QoQ - is welcome, but has yet to translate into
                                     supply on the ground. The more modest growth in             Prime rents in the Dublin industrial market have
                                     house completions to under 3,500 units nationally in        increased throughout H1 2016, and are expected to
                                     Q2’16 shows the scale of the housing supply challenge       reach €94/per m² during H2 2016. Rents in Cork are
                                     when set against the targets in the Action Plan for         expected to be in excess of €85/m² for new
                                     Housing and Homelessness. The Plan contains                 developments.
                                     ambitious targets to double the annual level of
                                     residential construction to 25,000 homes and deliver        The reality is that Brexit happened at the end of Q2 and
                                     47,000 units of social housing in the period to 2021.       while the uncertainty it created began well in advance of
                                     Achieving these targets will be conditional on the most     the 23rd June, total investment market activity was
                                     pressing issues being addressed by policy makers to         estimated at around €2.3 billion in Q2’16, more than
                                     ensure confidence returns to housebuilders and               three times the corresponding level in the same period
                                     house buyers.                                               of 2015. CBRE suggest that Q2’16 had the largest
                                                                                                 quarterly turnover on record, reflecting the largest single
                                     Meanwhile the volume of residential property                asset sale ever in Ireland of the Blanchardstown Centre
                                     transactions fell YoY, while national and Dublin house      for a reported €950 million.
                                     prices (CSO) recorded annual growth rates of 7% and
                                     5% respectively, with prices outside Dublin up by 9%.       The proposed sale of the Project Tolka loan portfolio
                                     Lending activity for house purchase is increasing           by NAMA is now expected to happen much later than
                                     strongly, with the average mortgage drawdown for first       planned (summer 2015), and other loan portfolios in line
                                     time buyers at €182,894 in Q2’16, almost 5 times            for disposal later this year include Projects Gem, Ruby
                                     average annual earnings. The finding which is of most        and Emerald, all of which are expected to sell at
                                     concern is the quarterly increase of 4% in residential      substantial discounts.
                                     rents across the board (Daft.ie), implying the upward
                                     pressure on rents continues.                                Despite uncertainty and mixed reports, Brexit should
                                                                                                 positively affect Ireland’s attractiveness for FDI. The
                                     Reports on the Dublin office market were mixed, with         magnitude of the effect is however unknown and any
                                     one view expressed that take-up levels were below           changes in demand will likely be gradual, but the Dublin
                                     normal in Q2’16. Supply remains constrained,                office (and residential) market will need to ensure
                                     particularly for Grade A office accommodation. Rents         any new demand from firms relocating can be
                                     have therefore continued to increase significantly           accommodated. Conversely, there is the risk that less
Annette Hughes                       and, although they were unchanged QoQ for most              investment will be forthcoming from UK sources, and
Director, DKM Economic Consultants   contributors, prime office rents are currently reported      this could jeopardise commercial (and housing)
                                     by CBRE to be the eighth most expensive in a survey         projects relying on non-domestic sources of finance.

                                                                                                                                                              3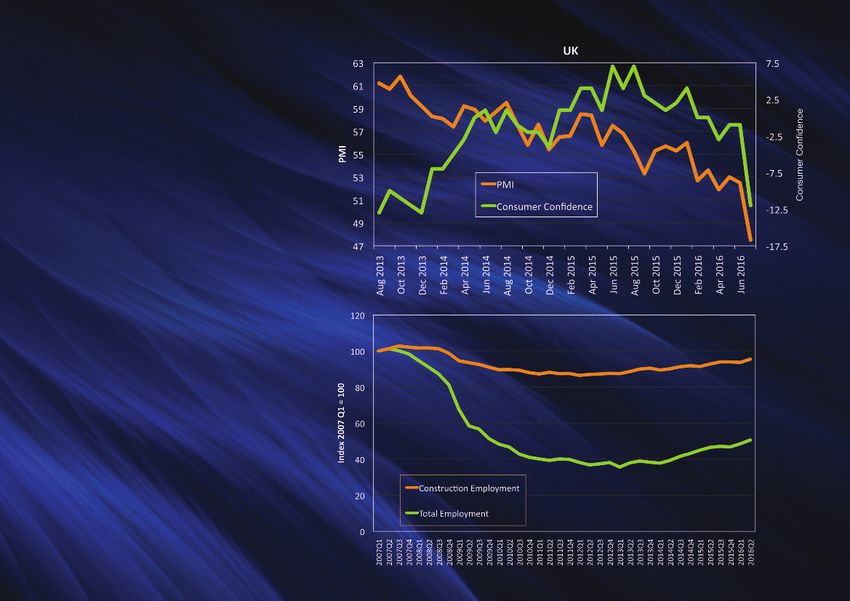
Latest               The much anticipated Housing Action Plan
                     is published
                                                                                   However, as an immediate response, the Plan also
                                                                                   committed to providing funding support for a dedicated

News
                                                                                   Student Housing Officer to work with the USI, local
                     The Housing Action Plan promised by Government                authorities, AHBs and housing providers as well as
                     was published on the 19th July 2016, well within the          others stakeholders, to identify and expand short-term
                     timeframe of 100 days set out in the Government               capacity enhancing measures in the student
                     Programme. The plan, ‘Rebuilding Ireland – an Action          accommodation sector and to assist students in finding
                     Plan for Housing and Homelessness’, provides a                appropriate accommodation. The intention here is to
Housing, Student     multi-stranded, action-oriented approach to achieving
                     many of the Government’s key housing objectives,
                                                                                   identify new accommodation not currently available for
                                                                                   rent. The USI expects to increase to 1,000 the number

Accommodation,       as set down in the Programme for a Partnership
                     Government. These include to significantly increase the
                     supply of social housing, to double the output of overall
                                                                                   of additional places via the “digs” service they run
                                                                                   which last year assisted a total of 600 students to find
                                                                                   rooms in private homes.
2016 Census and      housing from current levels to at least 25,000 per annum
                     by 2020, to service all tenure types, and to tackle           In addition the range of wider initiatives in the Action
                     homelessness. It is a comprehensive, albeit ambitious,        Plan includes the potential for Higher Education
the Cost of Unused   plan that addresses all aspects of the housing system
                     and contains 84 time-bound actions across a range of
                                                                                   Institutions to access low cost funding from the Housing
                                                                                   Finance Agency in a similar manner to approved

Accommodation        Government departments and agencies. Its success
                     will be measured by how quickly it is implemented and
                     thus the work of the new dedicated Housing Delivery
                                                                                   housing bodies (AHBs), further funding from the Irish
                                                                                   Strategic Investment Fund (ISIF), fast-tracking large
                                                                                   student accommodation complexes through the
                     Office, set up to measure and report on progress               planning process and the provision of access to large
                     regularly, is likely to be closely monitored.                 publicly owned zoned sites at reasonable prices.

                     A national student accommodation strategy to be               2016 Census of Population - average annual
                     delivered in the first half of 2017                            population growth of 0.7% between 2011 and 2016

                     As another academic year commences, the issue of              Preliminary results from Census 2016 were released in
                     student accommodation is back on the agenda. The              July and showed that the Irish population reached 4.76
                     special topic in this issue examines the role for the         million in April 2016, 3.7% above the previous Census
                     private sector in addressing the shortage of bespoke          population figure for 2011. The largest proportional
                     student housing stock. The Housing Action Plan                intercensal increases were recorded in the counties of
                     identified the expanded provision of student                   Meath (+5.9%), Dublin (+5.7%) and Kildare (+5.6%). The
                     accommodation as a key area to be addressed. It               populations of the large counties of Cork and Galway
                     identifies the importance of providing dedicated and           also expanded but at lower rates of 4.5% and 3.2%
                     additional student accommodation to avoid putting             respectively. Population growth was recorded in all
                     additional pressures on the private rental sector,            other counties over the intercensal period with the
                     particularly in and around the many universities and          exception of the western counties of Donegal (-1.5%),
                     third-level institutions in urban areas. With this in mind,   Mayo (-0.2%) and Sligo (-0.1%).
                     the Government has committed to the development of a
                     national student accommodation strategy in the first half      Such demographic changes can have significant
                     of 2017, led by the Department of Education and Skills        implications for the residential stock, particularly where
                     in conjunction with the Higher Education Institutions         substantial population growth has occurred. In this
                     (HEIs), the Department of Housing, Planning,                  regard, the Census 2016 housing statistics show that
                     Community and Local Government (DHPCLG) and                   despite population growth of 3.7% since 2011, Dublin’s
                     other key stakeholders.                                       housing stock rose by only 1% over the period. This
                                                                                   illustrates the seriousness of the shortage of housing in
                                                                                   the Capital and may partially explain the sustained
                                                                                   upward pressure on residential rents and prices which
                                                                                   has arisen over the past number of years.

                                                                                                                                                4
Housing stock increased by 18,981 between 2011              these 36,732 dwellings are available for immediate
and 2016; yet the level of housebuilding completions        occupancy and one suspects that a number of them
increased by 51,329 over the same period                    are still tied up with receivers and a further amount are
                                                            believed to be vacant, but not available, due to their
The Census also reported preliminary housing figures         elderly owners transitioning into nursing homes.
which indicated that the housing stock was 2.023
million dwellings in April 2016, which represented an       Commercial market - The cost of leases for
increase of 18,981 dwellings since the previous Census      unused accommodation for State Agencies
in 2011. This contrasts with statistics from the DHPCLG
which show that 51,329 dwellings were completed in          An interesting analysis of the annual accounts prepared
the same period. The difference of 32,348 dwellings is      by the Comptroller and Auditor General for a selection
substantial. While the stock figure should include units     of state agencies reveals the substantial cost to the
lost through obsolescence of dwellings during the five       State from the payment of leases for unused
year period, it is unlikely that 32,348 dwellings were      accommodation. The analysis by the Sunday
lost, particularly given the housing shortage that has      Independent (14th August) concluded that more than
prevailed in recent years. One explanation may be that      €1 million has been spent by seven state agencies on
units built and remaining vacant at the time of the last    leases for unused accommodation due to
boom would have been counted as vacant in the 2011          amalgamations and staff cuts which left those agencies
Census but would have been connected for electricity        with leases for office space that they no longer require.
post the year in which they were built. This would imply    Based on an estimated average office rent of €250 per
the measure of house completions may overstate the          square metre (€23.22/sq foot) across the country, this is
true level of housebuilding in the intervening years, due   equivalent to 4,000m2 for those seven agencies alone.
to the peculiar issues to do with the surge in vacant       The agencies included a number of Education and
dwellings left over after the construction boom. The        Training Boards across the country, the National
Housing Agency estimated a figure of 23,250 dwellings        Transport Authority, the Law Reform Commission, Safe
complete and vacant and a further 10,000 dwellings          Food Ireland, the Health Research Board and IDA
near completion in the 2010 Survey of Unfinished             Ireland. Indeed the figure excludes the cost of breaking
Developments. These 33,250 dwellings could have been        leases on unused buildings which was reported, for
connected for electricity, and hence regarded as            example, to have cost IDA Ireland €9.4 million this year
‘completed’, as they become occupied in the years           for an unused building in Ballsbridge.
following 2010.
                                                            Although the analysis relates to only seven agencies,
In a related perspective, the level of vacant dwellings     the report does raise the question about the State’s
both in Dublin and across the country is problematic for    property portfolio and the full extent of the cost of
the residential market. Almost 13% of the Irish housing     leases on office accommodation which is surplus to
stock was vacant in April 2016, down from 14.4% in          requirements. The office portfolio of the State is
2011. The total number of vacant dwellings was              comprised of 368 leases in 315 buildings, according to
259,562 in April 2016, around 30,000 below the              figures from the Office of Public Works, which provide a
corresponding figure in 2011. The highest vacancy rate       total of almost 360,000m2 of accommodation (41% of
was in Leitrim (29.5%) and the lowest vacancy rate was      the total State portfolio). Separately, in regard to the 59
in Kildare at 6.3%. The vacancy rate in Dublin was          per cent of the State portfolio which is owned, the OPW
6.9%, which amounted to 36,732 dwellings. These             developed and implemented a coordinated disposals
vacancy rates are problematic, especially in the context    policy on surplus property during 2015. It has previously
of the extremely weak housing supply which currently        been suggested by some AHBs that some of these
pertains in Dublin, where the average additional housing    disposals could be suitable for conversion to social
requirement has been estimated by the Housing Agency        housing accommodation.
at almost 9,400 on average in the period 2014-2018.
The real question is how many of

                                                                                                                          5
Economic                Last year, Irish GDP grew by a staggering 26.3%, higher
                        than any other developed country in the world. The
                                                                                    The full implications of Brexit are still unknown as it will
                                                                                    depend on, amongst other things, the future trading

Outlook
                        majority of this growth however came from the               relationship between the UK and the EU. For 2016, Irish
                        movement of Intellectual Patents (IP) into Ireland. As      growth will still be high due to the strong performance in
                        Ireland is a relatively small economy, these assets have    the first half of this year but it may start to slow over the
                        a much bigger impact on GDP making it much more             coming months. The exchange rate is already having a
                        volatile. As a result this headline rate provides a poor    negative impact on those firms exporting into the UK.
                        reflection of underlying growth in the Irish economy.        Since the beginning of this year, sterling depreciated
A potential slowdown    Other measures however, do suggest that the economy
                                                                                    by 15% against the euro. This rapid weakening and
                                                                                    unprecedented uncertainty puts those exporting into the
in the UK could bring   grew steadily in the first half of this year. While tax
                        receipts were lower than expected in July, they are still
                                                                                    UK at a competitive disadvantage. It also puts domestic
                                                                                    firms under pressure as they are now facing the
many challenges         8.5% higher than they were in the first seven months
                        last year. Growth in consumer spending has been
                                                                                    prospect of cheaper UK imports entering the Irish
                                                                                    market. An Ibec survey of members on Brexit found that
for Ireland             strong and was up 5% in Q1’16. Investment (excluding
                        intangibles and transport) on the other hand, was down
                                                                                    the exchange rate was by far their biggest concern.
                                                                                    Only a quarter of exporters have hedging arrangements
                        4% year-on-year in Q1 primarily due to a decrease in        in place and this protection will expire in the near future.
                        housing which fell by 5.2%. Exports in the first five         Over the coming months, it is likely that sterling will
                        months of this year were only up by 1%. This slowdown       depreciate further which will put increased pressure
                        in trade was due to a fall-off in pharma exports which      on Irish business.
                        saw a record year in 2015.
                                                                                    A clearer picture of the impact of Brexit on the UK
                        CSO figures showed annual employment growth of               will unfold over the coming months as more data is
                        2.9% in Q2. This was ahead of expectations, with more       released. Expectations of a slowdown have emerged in
                        than two million people now in employment for the first      the UK as both businesses and consumers re-evaluate
                        time since 2008.This progress was spread across the         their position. In July, PMI’s and consumer confidence
                        economy with positive employment growth in 12 of the        were down. The Bank of England has cut its growth
                        14 sectors. Construction continued to be a strong           forecasts for 2017 from 2.3% to 0.8% in light of Brexit,
                        performer as it was up 8.7%. However, compared to           the largest downgrade in more than 20 years. Estimates
                        total employment it still has a lot more catching up to     suggest that a 1 percentage point fall in UK growth
                        do before it reaches peak levels.                           leads to a knock on in Ireland of between one-quarter
                                                                                    and one-third of a percentage point. A potential
                                                                                    slowdown in the UK could therefore bring many
                                                                                    challenges for Ireland.

                                                                                                                                                   6
UK PMI and Consumer Confidence
Employment Index Ireland
7Residential For the second quarter in a row, commencements
experienced doubt digit QoQ growth as the number of
The total number of loan approvals rebounded
impressively to 9,419 in Q2’16, with QoQ and YoY
Market
residential units commenced amounted to 3,065. This growth of 58% and 22% respectively. Such a quarterly
increase led to a robust annual growth rate of 33%. Of upsurge can be predominantly credited to an increase in
the total, just fewer than 40% or 1,179 commencements the number of loans approved for house purchases
were one-off units. From a regional point of view, (+58%), while the less numerous top-up/re-mortgage
Activity
Dublin continued to record the highest level of loan approvals were 60% higher. The value of loan
commencements in Ireland, accounting for 28% of the approvals also rose sharply, with high quarterly and
national total. This was followed closely by the Mid-East annual growth rates recorded in Q2’16. In total, €1.86
(Kildare, Meath and Wicklow) where commencements billion worth of loans were approved in Q2’16, an
rose to 790 in Q2’16. This may be a reflection of increase of 66% relative to the previous quarter. The
construction activity spilling over to commuter belt vast majority of these loan approvals related to house
Commencements counties due to viability issues in Dublin. Following a
remarkable start to 2016, the annual rate of growth in
purchases (€1.65 billion) following striking QoQ and YoY
growth of 66% and 28% respectively.
continue to record registrations eased to 12% in Q2’16, with 1,291
registrations in the quarter. The total number of mortgage drawdowns rose by 11%
double digit The level of completions in Q2’16 rebounded strongly to
YoY in Q2’16 to reach 6,803. Further examination of
the data shows that the number of house purchase
growth as loan 3,498, which represented an annual increase of 17%. As
expected, Dublin accounted for the largest share of this
drawdowns increased by 24% QoQ, and by 6% YoY.
The top-ups/re-mortgage segment also experienced
approvals rise total, with 28% of all completions for Q2’16 recorded
in the Capital. The next highest shares were recorded
noteworthy growth of 27% QoQ and 52% YoY. From a
monetary perspective, drawdowns in Q2’16 amounted
in the South West and the Mid-East (both 14%). to a value of €1.29 billion, having registered a YoY in-
Completions for 2016 year-to-date amounted to crease of 18% along with a robust QoQ growth of 29%.
6,642, which was 18% higher relative to the same A similar QoQ growth rate was recorded for drawdowns
period in 2015. relating to house purchases. For the second quarter in a
row, the average mortgage drawdown for first time
The 2016 Census provided an up to date estimate buyers increased, reaching €182,894 in Q2’16, which
for the housing stock of 2,022,895, which has led to corresponds to almost 5 times average annual earnings.
revisions to the quarterly estimates included in Such an improvement reflected QoQ and YoY growth of
previous Property Watch publications. 3% and 7% respectively.
The level of transactions recorded in the Property
Price Register rose to 10,928 in Q2’16, which was an
improvement of 19% relative to the previous quarter. Of
these transactions, Dublin accounted for just over 30%
of the total, while both Carlow and Monaghan
accounted for the lowest shares (both 0.8%).
8Residential Market Activity
Q4’15 Q1’16 Q2’16 QoQ YoY Loan Approvals Q4’15 Q1’16 Q2’16 QoQ YoY
Units Granted Planning 4,017 3,091 N/A -23% -4% Total Number of Loan Approvals 7,219 5,956 9,419 +58% +22%
- Houses 2,754 2,534 N/A -8% +1% - House Purchase 6,185 5,149 8,126 +58% +19%
- Apartments 1,263 557 N/A -56% -20% - Top-Ups/Re-mortgages 1,034 807 1,293 +60% +49%
Total Loan Approval €m €1,352 €1,121 €1,859 +66% +32%
Commencements 1,742 2,059 3,065 +49% +33% - House Purchase €m €1,188 €998 €1,654 +66% +28%
of which one-offs 765 803 1,179 +47% +30% - Top-Ups/Re-mortgages €m €164 €123 €204 +67% +80%
Registrations* 859 1,263 1,291 +2% +12% Mortgage Drawdowns
Total Number of Drawdowns 7,993 5,447 6,803 +25% +11%
Completions** 3,752 3,144 3,498 +11% +17% - House Purchase 6,780 4,634 5,767 +24% +6%
- Top-Ups/Re-mortgages 1,213 813 1,036 +27% +52%
Transactions*** 13,316 9,215 10,928 +19% -2% Total Drawdowns €m €1,438 €999 €1,286 +29% +18%
- House Purchase €m €1,264 €888 €1,141 +28% +14%
National Housing Stock (000s) 2,019 2,020 2,023 0% 0% - Top-Ups/Re-mortgages €m €174 €111 €145 -31% +59%
FTB Drawdown - Average €172,188 €177,331 €182,894 +3% +7%
Regional Commencements Q2’16 Regional Completions Q2’16 Regional Transactions Q2’16
800 4,000
700 3,500
600 1,200 3,000
500 1,000 2,500
400 800 2,000
300 600 1,500
200 400 1,000
100 200 500
0 0 0
Border
West
Midlands
MidEast
Dublin
SouthEast
SouthWest
MidWest
Border
West
Midlands
MidEast
Dublin
SouthEast
SouthWest
MidWest
Border
West
Midlands
MidEast
Dublin
SouthEast
SouthWest
MidWest
Source: www.environ.ie Source: www.environ.ie Source: www.propertypriceregister.ie
*Mid-West includes all of Tipperary. *Mid-West includes all of Tipperary.
*Registrations refer to the number of units registered with Home Bond and Premier Guarantee. **Completions are measured as connections to ESB. *** Transactions exclude properties that are not full market price and those under €20,000 and over €5 million.
There have been some revisions to earlier data following updates on the PPR. QoQ refers to the latest quarter on quarter percentage change (Q2 on Q1). YoY refers to the latest year on year percentage change (Q2 2016 on Q2 2015).
Loan Approval and Mortgage drawdown data from www.bpfi.ie 9Residential Asking prices for residential properties increased at
the national level in Q2’16 according to Daft.ie. The
An analysis of the Property Price Register (not mix-
adjusted) found that the national average transaction
Property
strongest growth rates occurred outside of Dublin where price was €236,363, which represented a YoY increase
prices rose by 10% YoY. The corresponding rise in the of 10%. This was well below the average transaction
quarter was 3%. Asking price growth was more modest price of €388,320 recorded in Dublin, with the Capital
in Dublin at 1% YoY and 1% QoQ, and this is further registering YoY growth of 20%. When Dublin is
Prices
evidence of the two-speed recovery in Irish residential excluded, the national average transaction price falls
asking prices which has emerged in recent quarters. considerably to €168,374, highlighting the effect of the
Overall YoY price growth for the country was 6% Capital on national prices.
in Q2’16.
Mix-adjusted transaction prices, as produced by Daft.ie,
According to MyHome, asking prices on the national portrayed a different picture in Q2’16 with prices outside
Modest quarterly scale continued to grow in Q2’16. Prices rose by 5%
YoY and a similar YoY increase was recorded in Dublin.
the Capital rising by 3% QoQ. This contrasted with
Dublin where prices fell by 1% QoQ. Cumulatively
growth in residential Both the national and Dublin series recorded quarterly
growth of between 2% and 3%.
prices rose by 1% QoQ at the national level. Compared
to Q2’15, transaction prices were up by 1% in Dublin
prices while rents Based on price valuations recorded by Sherry
and 8% outside Dublin, which contributed to a YoY
national growth rate of 5% in the quarter.
rise strongly FitzGerald, residential property prices increased by 1%
QoQ both nationally and in Dublin in Q2’16. The The pace of growth in the RTB’s standardised rent index
national index increased 4% YoY, which was above the eased considerably at both the national and Dublin
2% YoY growth reported in Dublin. Knight Frank‘s levels in Q1’16. Rents nationally rose at a weakened
Prime Dublin Residential index showed that prices in rate of 1% QoQ, but remained 9% above the same
the Capital experienced a YoY increase in Q2’16 of 5%. period in 2015. In the Capital, rents were stable on a
This index also recorded a modest QoQ expansion of quarterly basis, but also stood 9% above levels in
1% in the Capital. Q1’15. Daft.ie’s analysis for Q2’16 produced slightly
different results with rents in Dublin and across the rest
Q2’16 recorded further growth in the CSO’s residential of the country rising at a stronger rate of 4% QoQ.
price index (based on mortgage-based transactions Rents in Dublin, the rest of the country and at the
only), with national and Dublin house prices recording national level all stood 11% above Q2’15 as upward
YoY growth rates of 7% and 5% respectively. However, pressure on rents continues.
the highest YoY rate of growth was recorded in the
national excluding Dublin index with prices up by 9%.
On a quarterly basis, prices rose by 2% in Dublin but
remained flat in the rest of the country.
10Residential Property Prices Average Sold Price by
ASKING PRICES Q4’15 Q1’16 Q2’16 QoQ YoY County Q2 2016
Daft.ie National MAAA* (€) €204,175 €210,333 €214,954 +2% +6% Dublin €388,230
Daft.ie Dublin MAAA* (€) €306,613 €312,642 €314,311 +1% +1% Wicklow €309,866
Daft.ie National ex. Dublin MAAA* (€) €164,838 €171,045 €176,799 +3% +10% Kildare €264,142
MyHome National MAAA* (€) €205,031 €207,596 €212,725 +3% +5% Meath €228,200
MyHome Dublin MAAA* (€) €285,921 €290,301 €296,190 +2% +5% Cork €201,853
PRICE VALUATIONS Galway €179,370
Sherry FitzGerald: National (Index 1999 =100) 123.2 124.7 126.5 +1% +4% Kilkenny €173,344
Sherry FitzGerald: Dublin (Index Q4 1996 =100) 402.9 405.6 409.6 +1% +2% Louth €163,383
Wexford €147,519
Knight Frank Prime Dublin Residential 134.0 135.9 136.6 +1% +5% Carlow €147,064
(Index Dec 2012 = 100) Limerick €146,266
PRICES BASED ON MORTGAGE TRANSACTIONS Kerry €145,833
CSO National (Index 2005=100) 86.7 86.5 87.1 +1% +7% Clare €137,946
CSO Dublin (Index 2005=100) 86.6 85.2 87.0 +2% +5% Offaly €139,395
CSO National ex. Dublin (Index 2005=100) 82.5 83.3 82.9 0% +9% Waterford €136,389
SOLD PRICES Laois €130,359
PPR National Average €227,612 €235,706 €236,363 0% +10% Tipperary €124,572
PPR Dublin Average €377,981 €368,980 €388,320 +5% +20% Monaghan €123,276
PRR National ex. Dublin Average €168,490 €168,992 €168,374 0% +7% Donegal €122,436
Daft.ie National MAAA* €199,139 €200,258 €203,024 +1% +5% Westmeath €119,943
Daft.ie Dublin MAAA* €303,773 €309,616 €306,347 -1% +1% Mayo €116,657
Daft.ie National ex. Dublin MAAA* €158,958 €158,263 €163,346 +3% +8% Cavan €105,874
RESIDENTIAL RENTS Sligo €105,169
RTB National Standardised Rents €917 €922 N/A +1% +9% Leitrim €88,651
RTB Dublin Standardised Rents €1,311 €1,314 N/A 0% +9% Roscommon €80,922
Daft.ie National MAAA* (€) €979 €998 €1,037 +4% +11% Longford €76,976
Daft.ie Dublin MAAA* (€) €1,435 €1,464 €1,520 +4% +11% Source: Property Price Register, DKM Analysis.
Transactions price data excludes properties that are not full market price
Daft.ie National ex. Dublin MAAA* (€) €727 €740 €770 +4% +11% and those under €20,000 and over €5 million, but includes VAT. Not Mix-Adjusted.
** Transactions price data excludes properties that are not full market price and those under €20,000 and over €5 million but includes VAT. Not Mix-Adjusted.
* MAAA = Mix-Adjusted Annual Average.
QoQ refers to the latest quarter on quarter percentage change.
YoY refers to the latest year on year percentage change.
11Commercial Dublin office take-up recorded between 37,200m²
(CBRE) and 66,300m² (Cushman & Wakefield Research)
The vacant stock in Dublin was reported at between
231,500m² (JLL) and 400,200 m² (Cushman & Wakefield
Office
in Q2’16 bringing the H1’16 take-up to between Research) in Q2’16. The stock has thereby continued
87,600m² (Lisney) and 126,200m² (Cushman & Wakefield the downward trend since the first PII Property Watch
Research). Commercial office take-up was therefore data in Q3’15. A lot of the available supply is however
significantly lower compared to H1’15 which saw take- substandard or was occupied previously. Consequently
Market
up between 92,900m² (Cushman & Wakefield Research) all but one contributor (Lisney) recorded lower vacancy
and 133,000m² (Lisney). The volume of take-up has rates in Dublin in Q2’16 ranging from 6.7% (JLL) to
however been below normal as several sizeable 12.0% (Cushman & Wakefield Research). The Dublin
Prime rents in Dublin
transactions are in negotiations and are expected to be city centre vacancy rate was lower than the overall rate
signed during the next quarter (CBRE). ranging between 3.3% (JLL) and 8.7% (Lisney). By the
are the eighth most
end of June, one agent reported that 27 office schemes
Given the continuing constrained supply situation, the or 345,000m² were under construction in Dublin, of
market conditions have favoured landlords seeking which 22% had been pre-let (CBRE).
expensive in Europe
longer leasing periods (20 to 25 years with a 10 to 12
year commitment) and offering shorter rent free periods Brexit is causing a great deal of uncertainty for the
(less than six months/city centre and less than a property market in Ireland. While reports on the specific
year/suburbs). Rents have therefore increased impacts have been mixed, the result should positively
significantly during the last few years and this trend has affect Ireland’s attractiveness for foreign direct
continued throughout H1’16. According to the Lisney investment in the medium- and long-term. The
rental index for Dublin, rents increased 17.7% in the 12 magnitude of the effect is however unknown and any
months to June 2016 with city centre rents increasing changes in demand will likely be gradual. Some financial
by 18.7%. Since early 2013 the city centre rent index services firms, technology companies and other
has increased 110.6% though the rate of increase is organisations may decide to relocate to alternative and
stagnating (Linsey). Dublin prime rents did however Euro-denominated cities in order to stay in the internal
remain constant between Q1 and Q2 for most market. Consequently the Dublin office (and residential)
contributors, with rents recorded between €603 per m² market will need to ensure any new demand can
(Lisney) and €646 per m² (JLL). However, prime office be accommodated.
rents are currently reported by CBRE to be the eighth
most expensive in a survey of European cities. Conversely, with regard to the availability of finance,
there is the risk that less investment will be forthcoming
The IT and Pharma / Health sectors accounted for the from UK investment companies and financial
largest proportions of the total Q2’16 take-up (30% and institutions, and any finance made available from UK
24% respectively) as the five largest deals were in these sources could be very costly. This could jeopardise
industries (Lisney). Looking at H1’16, the State and the commercial (and housing) projects relying on
Financial sector dominated take-up representing 31% non-domestic sources of finance.
and 30% of all transactions respectively (Lisney). Of the
65 transactions in Q2’16 reported by CBRE, 28 were
signed by Irish occupiers, 21 by American companies
and 8 by UK companies (CBRE).
12Snapshot of Dublin Office Property Market Indicators
Dublin Take-Up (‘000m2) Q4’15 Q1’16 Q2’16 YTD Dublin Vacancy Rates (%) Q4’15 Q1’16 Q2’16 QoQ
CBRE 75.2 52.4 37.2 89.2 CBRE 9.4 8.6 8.4 -0.2pp
Cushman & Wakefield Research 45.0 59.9 66.3 126.2 Cushman & Wakefield Research
Sherry Fitzgerald 14.1
13.0 -0.9pp
13.2 -0.9pp
12.0 -0.9pp
-1.2pp
JLL 90.8 45.1 49.8 95.0 JLL 10.2
7.8 -0.9pp
8.0 -0.9pp
6.7 -0.9pp
-1.3pp
Knight Frank 87.5 67.2 40.4 107.6 Knight Frank 8.8 8.3 8.2 -0.1pp
Lisney 91.6 44.0 43.6 87.6 Lisney 11.2 10.9 11.0 +0.1pp
Dublin City Centre Take-Up (‘000m2) Dublin City Centre Vacancy Rates (%)
CBRE 53.1 39.8 31.2 71.0 CBRE 7.4 6.9 6.6 -0.3pp
Cushman & Wakefield Research 11.8 25.3 27.5 52.8 JLL 3.7 3.7 3.3 -0.4pp
JLL 54.5 24.2 27.3 51.5 Lisney 9.3 8.7 8.7 0.0pp
Knight Frank 46.6 31.4 23.7 55.1 Dublin CBD Vacancy Rates (%)
Lisney 58.8 37.0 27.0 64.0 CBRE 6.0 5.8 6.1 +0.3pp
Dublin Vacant Stock/Availability (‘000m2) Cushman & Wakefield Research 8.9 10.0 8.9 -1.1pp
Cushman & Wakefield Research 435.1 439.9 400.2 Lisney 7.8 8.2 8.3 0.1pp
JLL 268.9 275.3 231.5 Dublin Office Yields (%)
Lisney 396.2 385.8 390.0 CBRE 4.65 4.65 4.65 0.0pp
Dublin City Centre Rents (€/m ) 2
Q4’15 Q1’16 Q2’16 QoQ Cushman & Wakefield Research 4.25 4.25 4.25 0.0pp
CBRE 592 592 619 +5% JLL 4.50 4.50 4.50 0.0pp
Cushman & Wakefield Research 592 592 592 0% Knight Frank 4.50 4.50 4.50 0.0pp
JLL 592 646 646 0% Lisney 4.25 4.25 4.40 +0.2pp
Knight Frank 619 619 619 0%
Lisney 480 492 537 +9%
Dublin Prime Rents (€/m2)
CBRE 592 619 619 0%
Cushman & Wakefield Research 592 592 592 0%
JLL 592 646 646 0%
Knight Frank 619 619 619 0%
Lisney 592 592 603 +2%
QoQ refers to the latest quarter on quarter percentage or percentage point change (Q2 on Q1). YTD refers to 2016 to date, i.e. the latest two quarters
13Industrial Based on data from three agents, industrial take-up in
Dublin totalled between 46,000m² (JLL) and 54,988m²
JJM Transport Unit comprising 6,050m² in Damastown
Industrial Park (Lisney). Based on the transactions
Property
(CBRE) in Q2’16 bringing take-up in the first half of 2016 reported by one agent, most (53%) ranged between
to between 97,100m² (JLL) and 119,700m² (CBRE). The 1,858m² and 4,645m² with transactions between 929m²
level of take-up in H1’16 is therefore much lower and 1,858m² accounting for 15% of the total in Q2’16
compared to the same period in 2015 which recorded (CBRE). Another agent stated that lettings dominated,
Market
between 182,100m² (Lisney) and 219,964m² (Cushman accounting for 58% of total take-up in the quarter (JLL).
& Wakefield Research) of take-up. Take-up is however in In volume terms take-up was significantly lower (-39%)
line with the mid-year average over the past five years in Q2’16 compared to Q2’15 and compared to Q1’16
of 102,200m² (JLL). This development is due to the (-33%), even though the number of transactions
continued scarcity of high quality modern industrial remained constant (40 in total) according to Lisney.
facilities in prime locations as opposed to a lack of Q2’16 also saw more lettings than sales, for the first
Still a scarcity of demand according to CBRE. time since 2012 (Lisney). A third agent reported a
similar story, with lettings and sales accounting for
modern industrial Prime industrial rents have continued to increase
throughout 2016 reaching between €80 (Lisney) and €85
approximately 60% and 40% of transactions
respectively, with the majority of sales being less than
facilities in good (CBRE) per m². Additionally CBRE expect prime rents to
increase to €94/per m² during the second half of 2016.
1,000m² and centred in the South West region (Lisney).
Consequently sales prices remained below replacement
locations This development in prime rents is highly likely as
speculative warehouse projects in Dublin Airport
costs, but the gap is expected to close (Lisney).
Logistics Park and the North City Business Park are The UK referendum in June to leave the European Union
expected to seek rents of €96/per m² and €108/per m² has caused some uncertainty in the sector but the
respectively (Lisney). As prime industrial rents increase, full extent of the effect on the Irish market remains
more speculative developments will start to emerge unknown. The outcome of the referendum will affect
which will ease supply pressures. Many occupiers will, some occupiers in the short term especially if they are
however, have to employ ‘design to build’ solutions in net exporters to the UK and therefore vulnerable to
the meantime to satisfy their requirements, according exchange rate fluctuations. The extent of any
to CBRE. The supply shortage is therefore likely to expansions or relocations is therefore difficult to
continue into the second half of 2016 pushing rents gauge, until the terms of Brexit are fully known.
up and increasing pre-letting negotiations.
Similarly to Q1’16, transactions centred around the
North East corridor with 35% of all sales and lettings in
Q2’16 and 22% of all activity in H1’16 occurring there
according to CBRE. In contrast to several quarters in
2015, there were no lettings or sales of facilities
exceeding 9,290m² recorded in Q2’16 (CBRE). The
largest transaction in Q2’16 was the sale of the former
14Snapshot of Dublin Industrial Property Market Indicators
Dublin Take-Up (‘000m2) Q4’15 Q1’16 Q2’16 YTD
CBRE 115.6 64.7 55.0 119.7
Cushman & Wakefield Research 102.9 59.4 45.5 104.9
JLL 97.5 51.1 46.0 97.1
Lisney 86.0 60.9 50.1 111.0
Dublin Vacant Stock/Availability (‘000m2)
Cushman & Wakefield Research 633 582 N/A
Dublin Prime Rents (€/m ) 2
Q4’15 Q1’16 Q2’16 QoQ
CBRE 75.0 80.0 85.0 6%
Cushman & Wakefield Research 75.0 81.0 81.0 0%
JLL 78.0 80.7 80.7 0%
Lisney 78.0 78.0 80.0 3%
Dublin Vacancy Rate (%)
Cushman & Wakefield Research 15.6 14.3 14.0 -0.3pp
Dublin Yields (%)
CBRE 5.75 5.75 5.75 0.00pp
Cushman & Wakefield Research 5.75 5.75 5.75 0.00pp
JLL 6.00 5.25 5.25 0.00pp
Lisney 5.90 5.70 5.70 0.00pp
QoQ refers to the latest quarter on quarter percentage or percentage point change (Q2 on Q1).
YTD refers to 2016 to date, i.e. the latest two quarters. N/A = not available.
15Commercial Information on the regional property market in the main
urban areas – Cork, Galway and Limerick – is based
In terms of new developments in the pipeline, in the
Regional
region of 64,200m² of office development is reported to
on data provided by Cushman & Wakefield Research. be under construction in the Cork market, according to
Lisney also monitors the Cork property market and Lisney, comprising 3,000m² in the mixed use
their data is also included. development under construction at the Capitol site on
the Grand Parade and 32,500m² at the Central Plaza in
Market
There is a consensus amongst the two agents around Mahon, both being brought to the market by John
the level of take-up in the Cork office market in Q2’16, Cleary Developments. Meanwhile, CIE has signed
with both Lisney and Cushman & Wakefield Research contracts with Clarendon Properties and BAM Ireland,
reporting a figure around 4,000m². However Lisney for development of a mixed use density and relatively
suggest that take-up levels doubled while Cushman & high-rise scheme, on its six-acre portion of its station
Wakefield Research suggest that they more than halved site at Horgan’s Quay in the city. This project is at the
in the quarter. This may be a timing issue in regard to early pre-planning stages.
Strong development when transactions are recorded. However, the total
take-up in H1’16, according to Cushman & Wakefield
pipeline in Cork where Research, was 13,700m², over twice the estimate from
Lisney of 6,100m². According to Lisney, the professional
Rents in the Cork industrial market expected to
be in excess of €85/m² for new developments
prime rents are less services sector dominated, accounting for 30% of total
transactions in the first six months, and were followed Total take-up in Cork in Q2’16 was reported at 2,750m²
than half the levels
by the IT and pharmaceutical sectors. In regard to the compared with 2,350m² in Q1’16. The total represented
other locations, the Galway market was exceptionally a quarterly increase of 17% but was well down on the
quiet with no take-up recorded in the quarter, while 5,750m² recorded in Q4’15. The quantum of stock
in Dublin activity in the Limerick market remain subdued, with
take-up levels almost unchanged in the quarter.
available in Q1’16 was up only marginally in the quarter,
from 206,600m² in Q1’16 to 210,000m². This is just over
half of the total available stock in the Dublin office
Between 88,450m² and 94,000m² of space was market, according to Lisney data. Much of the available
available in Cork at the end of Q2’16, almost unchanged stock is reported to be older stock or in less sought
from the position at the end of 2015. An analysis by after locations, with a limited supply of modern well
Lisney suggests that over 40% of the stock is in the located units on the market. The vacancy rate for the
city centre, much of which is older stock in need of overall market was estimated at 16.3%, ranging from
refurbishment. Limerick was not far behind Cork with an around 7% in the West suburbs to over 25% in the
estimated 71,450m² of available accommodation, North suburbs. The first spec-built warehouse in the
almost 5% above the corresponding level in Q1’16. The Cork area for a number of years was completed in Little
Galway market had a substantially lower amount of Island by the O’Connell Group with the rent sought at
vacant stock at 15,450m² in Q2’16, while the office €81/m². This is above the prevailing market rent but
vacancy rate overall was in single digits at 5.1%. rents in excess of €85/m² are expected to be the levels
Elsewhere, vacancy rates were in double digits, ranging required to support any new development,
from 15.7% to 18.6% overall in Cork and were higher, at according to Linsey.
19.5%, in Limerick overall, although they were closer to
30% in the Limerick Shannon Free Zone.
The notable difference outside of Dublin, when
compared with the Dublin market, is the level of office
rents. With prime rents in Dublin reported to be the eight
most expensive in Europe, office rents in Cork, Galway
and Limerick are substantially lower. Prime rents were
highest in Cork at €290/m², less than half the
corresponding level in Dublin. They were lower in
Galway at €220/m² and lowest in Limerick at €172/m².
16Regional Market Indicators
OFFICES INDUSTRIAL
TAKE-UP (m2) Q4’15 Q1’16 Q2’16 YTD Q4’15 Q1’16 Q2’16 YTD
Cork* 4,880 2,050 4,050 6,100 5,700 2,350 2,750 5,100
Cork 1,550 9,700 4,000 13,700 4,100 1,100 6,250 7,350
Galway 2,250 2,600 0 2,600 200 1,750 350 2,100
Limerick 5,700 1,100 1,150 2,250 13,950 3,700 8,300 12,000
VACANT STOCK/AVAILABILITY (m2)
Cork* 95,000 97,300 93,797 217,000 206,600 210,000
Cork 85,550 94,300 88,450 152,650 157,650 164,450
Galway 13,600 14,200 15,450 42,500 43,450 50,950
Limerick 66,800 68,300 71,450 166,800 169,100 173,100
PRIME RENTS (€/m2) Q4’15 Q1’16 Q2’16 QoQ Q4’15 Q1’16 Q2’16 QoQ
Cork 250 270 290 +7% 55.0 55.0 70.0 27%
Galway 220 220 220 0% 54.0 54.0 75.0 39%
Limerick 172 172 172 0% 43.0 43.0 48.0 12%
VACANCY RATE (%)
CORK
Cork Overall* 15.6 19.3 18.6 -0.7pp
Cork Overall 15.6 16.7 15.7 -1.0pp
Cork City Centre 16.2 18.5 16.7 -1.8pp
Cork Suburbs 15.2 15.5 14.9 -0.6pp
GALWAY
Galway Overall 4.5 4.7 5.1 +0.4pp
Galway City Centre 5.5 5.2 6.1 +0.9pp
Galway Suburbs 3.9 4.3 4.4 +0.1pp
LIMERICK
Limerick Overall 18.2 18.7 19.5 +0.8pp
Limerick City Centre 16.8 17.7 19.2 +1.5pp
Limerick Suburbs 14.5 14.0 14.7 +0.7pp
Limerick Shannon Free Zone 29.7 29.7 29.7 0.0pp
*Source is Lisney. All other data from Cushman & Wakefield Research.
QoQ refers to the latest quarter on quarter percentage of percentage point change (Q2 on Q1). YTD refers to 2016 to date, i.e. the latest two quarters.
17Investment Perhaps the main repercussions of Brexit will be felt in
the investment market. To quote from Lisney’s Q2’16
Retail Park in Naas for €25.5 million and the Kilkenny
Retail Park for €23.5 million. One other major Dublin
Market
Investment Update shopping centre expected to attract significant interest
from international investors is the Liffey Valley Shopping
“Investment is a confidence business and Centre which is expected to be put up for sale by owners
uncertainty hammers confidence.” Hines, the Grosvenor Group and HSBC Alternative
Investment with an estimated asking price of €600
However, this review of investment market activity in million. There was also substantial activity in the offices
Turnover in Q2 the Property Watch since the first issue in Q3’15 has
demonstrated the substantial acquisitions made in the
sector which accounted for 36% of the total turnover in
Q2’16. The most substantial transaction was the sale of
largest level on record, Irish commercial property market by a mix of domestic
and international funds. According to an analysis of
PWC’s building of 21,000m² in Spencer Dock for a
reported €240 million.
notwithstanding investment activity in H1’16 by CBRE and Allsop, just
6% of the total value of income producing commercial Meanwhile the sale of the Project Jewel loan portfolio by
uncertainty
property purchased for less than €1 million, and 13% of NAMA, comprising the Dundrum Town Centre and loans
assets purchased above €1 million, went to UK financial attached to 50% stakes in the Ilac Centre in Dublin City
around Brexit
institutions and pension funds. As the Brexit plans unfold, and the Pavilions Shopping Centre in Swords, to UK
the uncertainty generated plus the depreciation of the property group Hammerson and its joint venture partner
Sterling exchange rate may adversely impact future Allianz Real Estate for €1.85 billion last year, concluded
investment decisions by UK investors in Ireland. in July 2016.
The reality is that Brexit happened at the end of the The proposed sale of the Project Tolka loan portfolio by
second quarter and while the uncertainty it created NAMA is now expected to happen much later than
began well in advance of the 23rd June, the total planned (summer 2015) due to the complex nature of the
investment market activity was estimated at €2.3 billion loans in the portfolio. The most significant assets are the
(JLL) in Q2’16, more than three times the corresponding Burlington Plaza office complex on Burlington Road in
level of investment in the same period of 2015. JLL Dublin, the Clarion Hotel and the Belfield headquarters of
estimate the mid-year investment total at €2.95 billion, Paddy Power and the former Harcourt Street children’s
versus their total figure for 2015 of €3.4 billion. Once hospital. Other loan portfolios in line for disposal by
again Dublin accounted for the vast majority of turnover NAMA later this year include Project Gem, which is
in Q2’16, estimated at between 90% (CBRE) and 92% reported to have a face value of around €4 billion, while
(JLL) of the total. However, according to the CBRE/Allsop the preferred bidders, Oaktree Capital, were selected by
analysis of investment activity in H1’16, Dublin accounted NAMA for projects Ruby and Emerald, a package of
for 56% of transactions in H1’16, with a further 15% loans with a combined face value of €4.7 billion. All three
located elsewhere in Leinster. portfolios are expected to sell at a substantial discount.
CBRE suggest that turnover in Q2’16 was the largest
quarterly turnover on record. This reflects the sale of the
Blanchardstown Centre by Green Property to Blackstone
for a reported €950 million, the largest single asset sale
ever in Ireland, accounting for around 45% of CBRE’s
total Q2 turnover estimate of €2.1 billion. This deal made
Retail the dominant sector, although other notable, albeit
much smaller, retail transactions which took place in
regional towns included the sale of the Bridgewater
Shopping Centre in Arklow for €32.5 million, the Globe
1819
AIB                   AIB continues to be very active across the property
                      market spectrum, supporting consumers, SMEs,
                                                                                 As well as supporting our local market teams, the
                                                                                 Property Lending Unit continues to provide larger ticket

supporting
                      corporates, developers and investors.                      funding for the commercial property investment market
                                                                                 in Ireland.
                      AIB has been particularly busy providing mortgage
                      finance at market- leading rates and remains the largest    Property is a key sector for AIB and for the Irish

the
                      provider of new mortgages in the market this year with a   economy. We has been working closely with SME and
                      34% share of new mortgage business drawn down by           corporate customers facilitating the development of
                      the end of May 2016.                                       nursing homes, primary care centres, hotels and
                                                                                 manufacturing capacity. We have also facilitated the
                      Across the country, 19 local market teams have been        financing of the transfer of leasehold to freehold

Property
                      supporting personal and business customers with            particularly for retailers.
                      commercial property investment finance. This has been
                      supported by our Property Lending Unit which is the        AIB is also supporting student housing this year with
                      bank’s centre of excellence for property. This unit was    a number of key transactions and is also actively

Market in
                      established more than a year ago and has a team of         supporting the development of social and affordable
                      property specialist lenders supported by a number of       housing working closely with approved housing bodies
                      chartered surveyors and engineers who work closely         (AHBs) and experienced developers. We have been
                      alongside the lenders providing specialist support to      exclusive finance partner with the Irish Council for
                      them and to our customers.                                 Social Housing over the past 3 years and are

Ireland
                                                                                 sponsoring its finance conference in Kilkenny on
                      The Property Lending Unit has also been busy providing     Oct 20th and 21st this year.
                      finance and supporting a number of residential and
                      commercial development property transactions. AIB          We are focused on meeting the financing needs of our
                      continues to be committed to working with capable          existing and prospective customers operating in the
                      parties to deliver homes in locations where demand is      property market, as well as providing the appropriate
                      evident and developments are economically viable. We       sector expertise to our SME and corporate customers
Providing finance      are also supporting commercial office development in
                      Dublin City Centre with strong partners and covenants.
                                                                                 requiring finance for development of their business
                                                                                 model regardless of the sector.
across the property   Development of housing supply and suitable
                      commercial office space are important for both Foreign      We have an active pipeline and continue to look for

market spectrum       Direct Investment and the Irish corporate and
                      SME market.
                                                                                 lending opportunities in the commercial and residential
                                                                                 investment and development markets.

                                                                                                                                            20
Contact Details for the AIB Property Lending
Unit are as follows:
Donall O’Shea,
Head of Property Lending Unit
Tel; 01 7720302
Email; donall.a.o’shea@aib.ie
Derek O’Shea,
Head of Residential Development & Specialist Assets
Tel; 01 6414431
Email; derek.p.o’shea@aib.ie
Ciaran Mooney,
Head of Commercial Real Estate Investment
Tel; 01 7726355
Email; Ciaran.e.mooney@aib.ie
Contact details for our Local Market
teams are as follows:
Joanna McFadden
Head of New Business Dublin & East
Tel; 086 7947804
Email; Joanna.p.mcfadden@aib.ie
John Heapes
Head of New Business Galway & West
Tel; 086 381 2554
Email; John.heapes@aib.ie
Michael Hayes
Head of New Business Cork & South
Tel; 086 465 8530
Email; Michael.g.hayes@aib.ie Unit
21You can also read


