Industry Training Profiles
←
→
Page content transcription
If your browser does not render page correctly, please read the page content below
Industry Training Profiles
Introduction
Presented in this section are 19 industry training profiles. They combine industry intelligence and economic
analysis with training data to build a more complete picture of the relationship between industry skills needs,
employment opportunities and skills training.
Each of the 19 industry training profiles1 examines the following areas:
Economic context including employment, economic output and business base; and current workforce
breakdown by age group and qualification level
Summary of training challenges gleaned from industry intelligence including structural changes and
areas of skills shortage
Overview of training performance 2012 compared to 2011, including a 'dashboard' of key measures
Training breakdown of significant trends in specific occupations, qualifications or the demographic
profile of students
Provider analysis including shifts in market share.
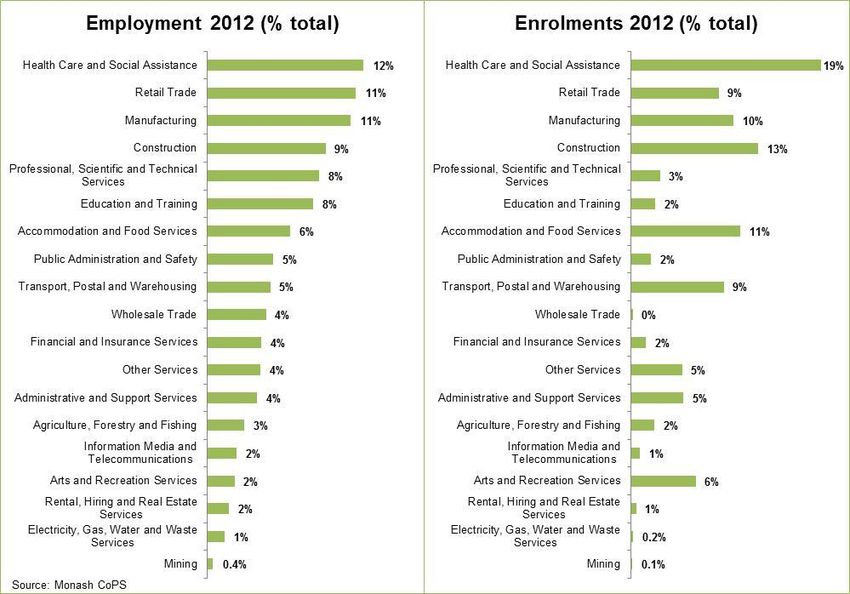
The table below shows training in government subsidised qualifications, sorted highest to lowest by 2012
enrolments (excludes foundation training). Rank by industry share of Victorian employment and equivalent
2008 ranks are also displayed.
Analysis of 2012 data shows a high correlation between share of employment and share of training delivery
in Victoria's largest industries:
Fifty-three per cent of training was delivered in the five highest employing Victorian industry sectors,
which account for 50 per cent of all Victorian jobs – Health Care and Social Assistance, Retail Trade,
Manufacturing, Construction and Professional, Scientific and Technical Services.
Health Care and Social Assistance, forecast to remain Victoria’s largest industry employer through to
20172, saw the highest enrolment growth for industry-specific training in 2012 (16,200 additional
enrolments in 2012 when compared with 2011).
In addition to the 414,000 enrolments in industry-specific training, there were 91,000 enrolments in
Cross-industry training, which encompasses a broad range of skills applicable to all Victorian industries.
1
The industry profiles are aligned to the Australian and New Zealand Standard Industrial Classification 2006 (ABS cat no.
1292.0). Classification of qualifications against industry and occupational outcomes have been developed in consultation with
Victorian industry and training market stakeholders. Where a specific qualification is relevant across several industries,
enrolments have been proportionally allocated across industries using employment data as a guide. Qualifications which are
considered to be cross-industry (i.e. potentially relevant across all industries) have been excluded from these industry profiles.
2
DEECD subscribes to the Monash CoPS Economic Forecasts Model which provides employment and output forecasts down to
the 3-digit ANZSIC level, occupational forecasts down to the 4-digit ANZSCO as well as high level aggregation forecasts of
hours worked, and ASCED qualifications attained. This report utilises the COPS five year forecast to 2017 for analysis in the
VET Industry Profiles.
Victorian Training Market Quarterly Report Full Year 2012 1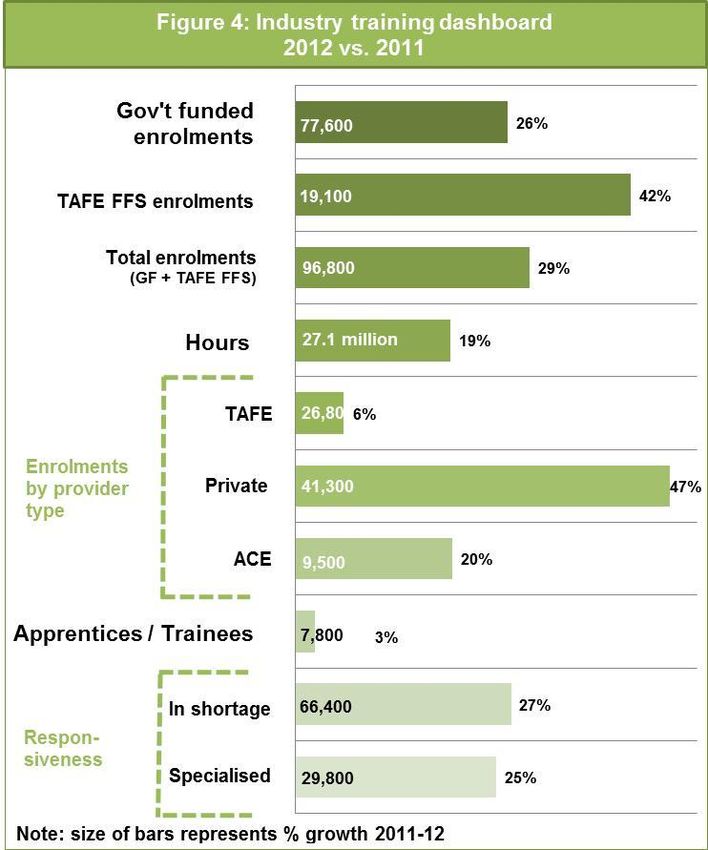
Industry Training Profiles

Table 4.1: Industry-specific training and employment: 2012 vs. 2008
                                        2012 Enrolments                Training Rank             Employment rank
ANZSIC Industry
                                      Number           Share           2012            2008        2012           2008
Health Care and Social
Assistance                               77,600        18.7%                1              2           1               3
Construction                             52,000        12.5%                2              1           4               4
Accommodation and Food
Services                                 44,600        10.8%                3              4           7               7
Manufacturing                            41,800        10.1%                4              3           3               1
Transport, Postal and
Warehousing                              38,000         9.2%                5            10            9              9
Retail Trade                             36,000         8.7%                6             5            2              2
Arts and Recreation Services             26,700         6.4%                7             7           16             16
Administrative and Support
Services                                 21,600         5.2%                8              6          13             13
Other Services                           21,000         5.1%                9              9          12             11
Professional, Scientific and
Technical Services                       12,000         2.9%               10             8            5               5
Education and Training                   10,100         2.4%               11            12            6               6

Agriculture, Forestry and Fishing         9,800         2.4%               12            11           14             14

Public Administration and Safety          8,400         2.0%               13            13            8             10

Financial and Insurance Services          6,300         1.5%               14            15           11             12
Information Media and
Telecommunications                        3,900         0.9%               15            14           15             15
Rental, Hiring and Real Estate
Services                                  2,300         0.6%               16            17           17             17
Electricity, Gas, Water and Waste
Services                                    950         0.2%               17            16           18             18
Wholesale Trade                             900         0.2%               18            18           10              8
Mining                                      550         0.1%               19            19           19             19

Industry-specific training             414,400         100.0%              -              -            -              -
Cross-industry training *               91,000              -              -              -            -              -

Total industry training                505,300              -              -              -            -              -

* Cross-industry training (e.g. business administration, recordkeeping, computing) has been removed from the industry-specific
analysis as this training develops business skills which are transferable across many industry sectors.

                                    Victorian Training Market Quarterly Report Full Year 2012                                2
Industry Training Profiles
Table 4.2: Industry share of Victorian employment and vocational training 2012
Significant trends in industry sectors include:
Health Care and Social Assistance is Victoria's largest employing industry with 12 per cent of all jobs.
In 2012 19 per cent of training was delivered to this industry, up from 17 per cent in 2011. While some
of the recent demand for training in this industry is driven by regulatory compliance, strong enrolment
growth should prepare Victoria to respond to forecast jobs growth (employment in Health Care and
Social Assistance is anticipated to grow by 16,200 jobs by 2016-17), as well as help combat industry
skills shortages.
Victoria’s Professional, Scientific and Technical Services and Education and Training industries are the
5th and 6th largest industry employers respectively. In both industries, however, over 50 per cent of
employees hold higher education qualifications. This compares with a Victorian average of 29 per cent
of the workforce, and explains the relatively low representation of these industries in vocational training.
In 2012, enrolments in courses aligned to the Professional, Scientific and Technical Services industry
made up 3 per cent of vocational training compared with 8 per cent of employment; enrolments in
Education and Training qualifications accounted for 2 per cent of vocational training while this industry
accounted for 8 per cent of Victorian jobs.
Transport, Postal and Warehousing training continues to experience strong enrolment growth and is
now the 5th largest vocational training segment (up from 10th largest in 2008). Given the strategic
importance of this industry to Victoria, with supply chain activities spanning Victoria’s industries, this
should help position the industry to meet its growing skill needs.
Cross-industry training, of relevance to all Victorian industries, represents a significant proportion of
vocational training activity. These courses cover a range of skills which are used by all industries, such
as Business Administration and Management, Human Resources, Accounting Services and Information
Technology. Course enrolments have seen growth of 9,500 in 2012, or 12 per cent when compared
with 2011.
Victorian Training Market Quarterly Report Full Year 2012 3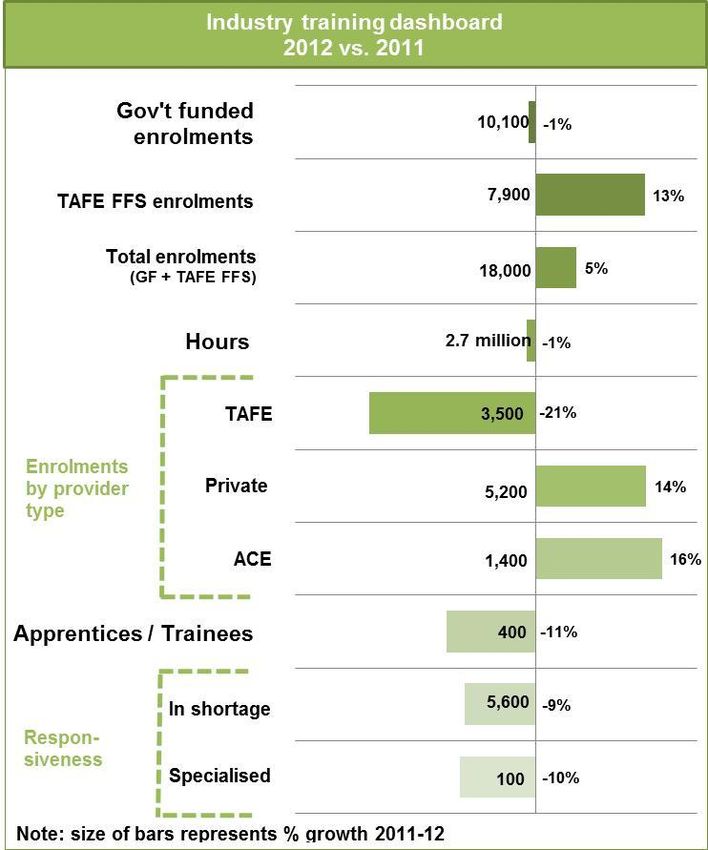
2                                                                                                                                                                                                                                 Industry Training Profiles

                                                                                                                                                                                                                                                        Industry Training Profiles
                                                            Table 4.3: Industry training delivery, government subsidised enrolments 2008–2012 (sorted by highest enrolments 2012)
                                                                                                                                                                                                            % change         % change
                                                              ANZSIC Industry (Code)                                        2008            2009            2010              2011              2012
                                                                                                                                                                                                            2008-2012        2011-2012

                                                            Health Care and Social Assistance                              29,900          36,100          45,800            61,400            77,600            160%             26%

                                                            Construction                                                   31,900          33,000          42,500            47,800            52,000             63%              9%

                                                            Accommodation and Food Services                                25,200          29,900          29,000            35,500            44,600             77%             26%

                                                            Manufacturing                                                  27,000          23,500          27,200            33,800            41,800             54%             24%
Victorian Training Market Quarterly Report Full Year 2012

                                                            Transport, Postal and Warehousing                              11,300          15,000          17,100            28,000            38,000            236%             36%

                                                            Retail Trade                                                   19,900          18,600          23,400            33,200            36,000             81%              8%

                                                            Arts and Recreation Services                                   13,500          14,700          19,000            27,500            26,700             97%             -3%

                                                            Administrative and Support Services                            15,100          11,400          14,400            20,600            21,600             43%              5%

                                                            Other Services                                                 12,600          13,200          17,600            19,400            21,000             67%              8%

                                                            Professional, Scientific and Technical Services                13,100          12,900          12,700            12,400            12,000              -8%            -3%

                                                            Education and Training                                          6,700           8,400            9,100           10,200            10,100             50%             -1%

                                                            Agriculture, Forestry and Fishing                               7,800           7,600            7,900             9,500             9,800            25%              3%

                                                            Public Administration and Safety                                4,000           3,200            5,500             7,900             8,400           110%              6%

                                                            Financial and Insurance Services                                1,000           1,400            1,700             6,700             6,300           504%             -7%

                                                            Information Media and Telecommunications                        2,100           3,000            3,500             3,800             3,900            82%              3%

                                                            Rental, Hiring and Real Estate Services                           600             650            1,000             1,600             2,300           272%             48%

                                                            Electricity, Gas, Water and Waste Services                        800             700             850              1,000              950             22%             -8%

                                                            Wholesale Trade                                                   550             350             550                850              900             64%              6%

                                                            Mining                                                            400             350             300                300              550             38%             92%

                                                            Industry-specific training                                    223,500         234,000         279,300           361,400           414,400              85%            15%

                                                            Cross-industry                                                 52,600          51,100          57,400            81,500            91,000             73%             12%

                                                            Total industry training                                       276,100         285,100         336,800           442,800           505,300              83%            14%

                                                            Please refer to individual industry profiles for a full description of these trends in enrolments.

                                                                                                                                                                 Victorian Training Market Quarterly Report Full Year 2012                                           4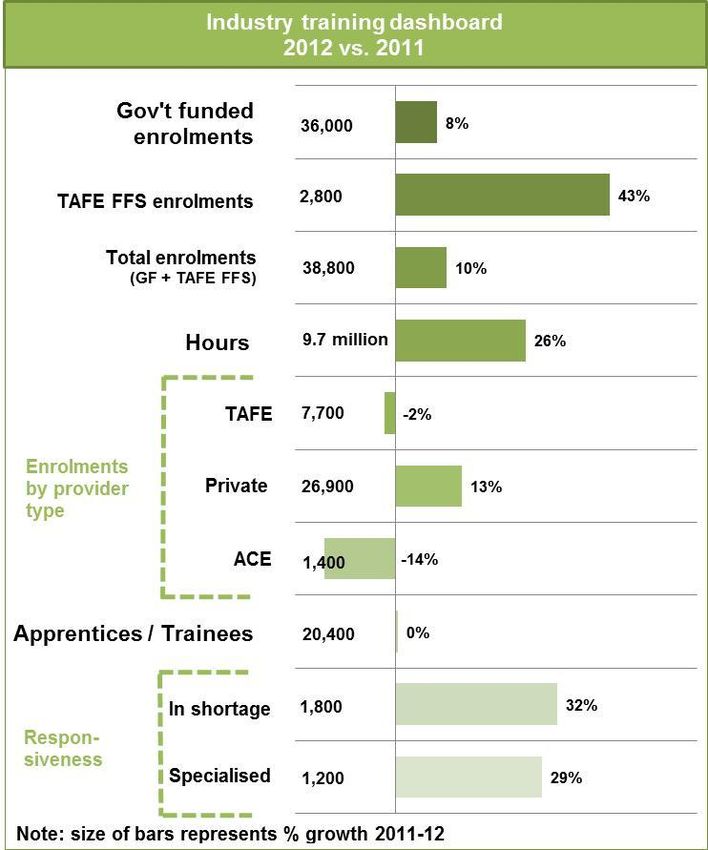
Industry Training Profiles
Accommodation and Food Services
Industry Overview
Figure 4.1: Industry share, 2011-12 With output of $9.3 billion in 2011-12, Accommodation
and Food Services makes up approximately 3 per cent
9% of the Victorian economy while accounting for 6 per cent
of the total workforce.
6%
There are close to 22,000 Accommodation and Food
4%
3% Services operations in Victoria, of which approximately
70 per cent are in Melbourne. The majority of
businesses in this sector are small, accounting for 91
per cent of all operators across Victoria.
Employment Businesses Economic VET
Output enrolments Forecasts for the industry anticipate jobs growth of
Source: Monash CoPS, ABS, SVTS approximately 1,300 over the next five years, increasing
to 176,900 in 2016-17.
Growth will be concentrated in the Food and Beverage Services sector, by far the largest employing
sector. Food and Beverage accounts for just under 90 per cent of all jobs in this industry, with the
remainder in Accommodation.
Accommodation and Food Services has the youngest age profile across all Victorian industries, with 38
per cent of employees aged 24 or younger (compared with an average of 16 per cent across all
industries). This reflects the high proportion of students working in this industry. The industry also has
the highest proportion of employees with no post-school qualifications.
Tourism businesses, closely aligned to this industry sector, are operating in a challenging environment.
Victoria’s second largest international export, tourism in particular is weighed down by the continuing
strength of the Australian dollar.3 Domestic tourism, however, has been more resilient, with domestic
overnight visitors to and within Victoria increasing by 7 per cent in 2011-12, and Melbourne now
attracting more interstate overnight visitors than Sydney.4
Growth opportunities do exist in the tourism industry, however, linked in part to ongoing growth in Asia.
Victoria’s China Tourism Strategy, released in 2012, outlines the importance of the Chinese visitor
market to Victoria and outlines a strategy to increase visitation across the state – including regional
Victoria.
Figure 4.2: Forecasts to 2016-17 and 2011-12 current workforce age and qualifications
3
Government of Victoria 2012a, p. 8
4
Government of Victoria 2012b, p. 22
Victorian Training Market Quarterly Report Full Year 2012 5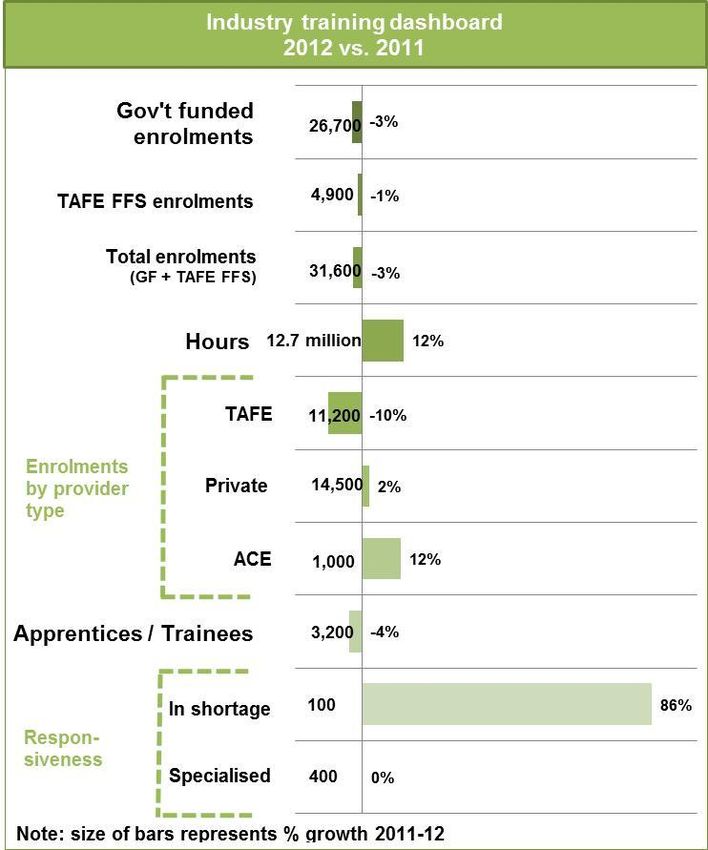
Industry Training Profiles
Key training challenges for the industry
Skill shortages have been identified in the occupations Café and Restaurant Managers,
Chefs and Pastrycooks.
Balancing work placements with classroom learning is important in the Accommodation
and Food Services industry in order to develop work ready graduates in a sector which is
characterised by casual workers and itinerant workforce.
Employment forecasts indicate a demand for higher level skills in an industry which has
below average levels of educational attainment. In particular, an additional 2,000 jobs are
forecast for employees with vocational qualifications at Diploma level and above.
Available career opportunities and pathways need to be promoted to workers within
Hospitality and Tourism as a way of building retention in industries with traditionally high
levels of employee churn.
Training Delivery Overview5
Figure 4.3: Industry training comparisons Government subsidised enrolments in
2008 2009 2010 2011 2012 Accommodation and Food Services courses
Accommodation and reached 44,600 in 2012, an increase of 26 per
Food Services 25,200 29,900 29,000 35,500 44,600 cent when compared with 2011. This is higher
Year-on-year %
change - 19% -3% 22% 26%
than the average seen across all industries.
% change across all TAFE fee for service delivery accounted for 22
industries - 3% 18% 32% 14%
per cent of industry enrolments, down slightly
from 23 per cent in 2011 – although overall the
number of fee for service enrolments increased
by 16 per cent.
The occupation with the largest increase in
enrolments was Waiters, with enrolments up by
more than 6,000 between 2011 and 2012, to
18,500 (an increase of 49 per cent). Courses
aligned to the occupation Waiter accounted for
one third of all Accommodation and Food
Services training in 2012.
All three skill shortage occupations in the
Accommodation and Food industry saw
enrolment growth in 2012. There were an
additional 2,900 enrolments in courses aligned to
Café and Restaurant Managers, an increase of
46 per cent to 9,200. Pastrycook enrolments
grew by 500 to 1,300, while enrolments in Chef
related courses increased by 400 to 1,300.
Occupations seeing a decline in enrolments in
2012 included Kitchenhands, with enrolments
decreasing by 1,400 to 9,000.
Apprentice and trainee enrolments showed a
slight increase in 2012, up by 700 enrolments.
5
Scope of data is nationally accredited and recognised training at AQF level 1 and above. Comparisons with all-industry
training exclude foundation training but include vocational courses which do not align to a single ANZSIC industry (e.g.
business and administration). Commentary refers to government subsidised activity unless otherwise stated.
Victorian Training Market Quarterly Report Full Year 2012 6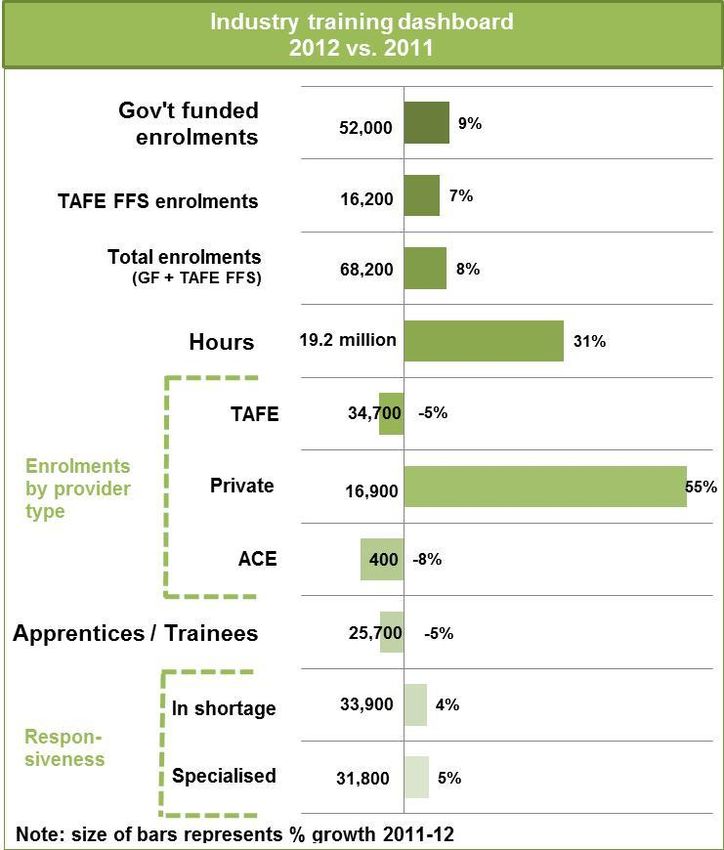
Industry Training Profiles
Training Breakdown
Women are more likely than men to enrol in Accommodation and Food Services qualifications,
accounting for 57 per cent of industry enrolments (up from 53 per cent in 2010).
Women comprise the majority of enrolments linked to the occupations of Pastrycook (85 per cent of the
total), Waiter and Kitchenhand (61 per cent of enrolments respectively). Men, on the other hand, make
up a higher proportion of Chef enrolments, 59 per cent of the total.
Figure 4.4: Government subsidised enrolments
Qualification level 2012 Age group 2012 Top qualifications 2012
(% change since 2011) (% total)
Certificate III in Hospitality 18,500
32,300
15 to 19 45% Certificate II in Hospitality 6,400
20 to 24 19%
Certificate IV in Hospitality 5,900
Certificate III in Hospitality
-12% 4,500
9,000 52% (Commercial Cookery)
25 to 44 24%
Certificate II in Hospitality (Kitchen
2,300
-14% 3,300 Operations)
45 to 64 11% These 5 courses accounted for 84% of all
Cert I-II Cert III-IV Diploma & Above government funded training in the industry
The age profile of those enrolling in Accommodation and Food Services courses is younger than
average, with approximately two-thirds of enrolments by those aged 15 to 24 years. This is in line with
the industry’s younger than average employment profile.
Enrolments at Certificate III–IV level continued to show strong growth in 2012, while Certificate I–II and
Diploma+ level enrolments declined. Certificate III–IV level enrolments now account for 72 per cent of
the total, up from 60 per cent in 2011.
Certificate III in Hospitality had the highest number of enrolments in the sector, with enrolments
increasing by more than 6,000, to 18,500 between 2011 and 2012. This course accounted for 41 per
cent of all Accommodation and Food Services enrolments in 2012, up from 35 per cent in 2011.
The proportion of employed students in this industry increased slightly in 2012, representing 70 per cent
of enrolments compared with 67 per cent in 2011.
For Accommodation and Food Services related training, the main reasons students were completing a
vocational training qualification were to get extra skills for their current job or to get a job. Around 62 per
cent of students undertaking a course related to Accommodation and Food Services held at least a Year
12 or equivalent qualification.
Victorian Training Market Quarterly Report Full Year 2012 7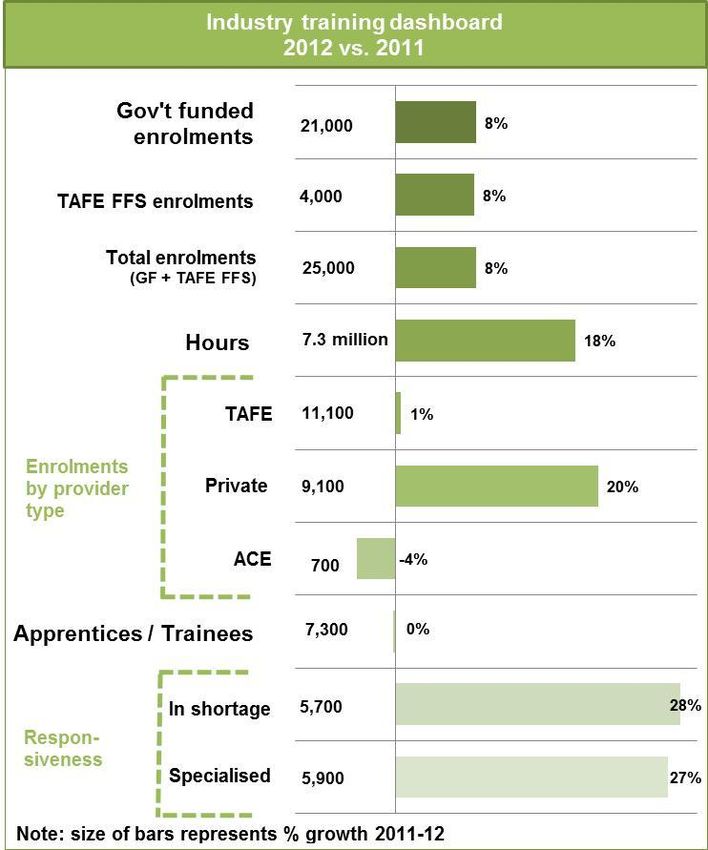
Industry Training Profiles
Training Provision Figure 4.5: Training provider share of enrolments
Private providers deliver the majority of
Accommodation and Food Services training, 53 per Provider share 2012
(change in percentage points since 2011)
cent of the total – a proportion which has remained
relatively stable in 2012. 53%
ACE providers have significantly increased their
share of delivery in this industry over the last 12
29%
months. Enrolments more than doubled in 2012,
up by 4,500 enrolments to 7,600, and ACE 17%
providers now account for 17 per cent of delivery
(up from 9 per cent in 2011). ACE providers are -9% 1% 8%
more likely to deliver training related to Waiters and
TAFE Private ACE
Kitchenhands than any other occupation.
There were 167 training providers delivering
Enrolments by Funding Band 2011 - 2012
government subsidised vocational training in
Accommodation and Food Services in 2012, 8
more than in 2011. Of these, a majority (99
providers) delivered less than 100 enrolments in Y2012 12% 11% 13% 7% 56%
2012.
Fifty-five per cent of Accommodation and Food
Services enrolments involved some classroom Y2011 12% 15% 8% 11% 54%
based delivery. Thirty-nine per cent included
employment based training and a further 15 per
cent involved recognition of prior learning, A B C D E
recognition of current competency, or credit
transfer.
In the Accommodation and Food Services industry 23 per cent of enrolments were funded at subsidy
levels A and B, equating to 9,800 enrolments. There has been a 5 percentage point decline in bands A
and B between 2011 and 2012. In 2012, bands D and E represented 63 per cent of all government
subsidised enrolments or 28,400 enrolments. The share of bands D and E declined by 2 percentage
points over this same period.
Victorian Training Market Quarterly Report Full Year 2012 8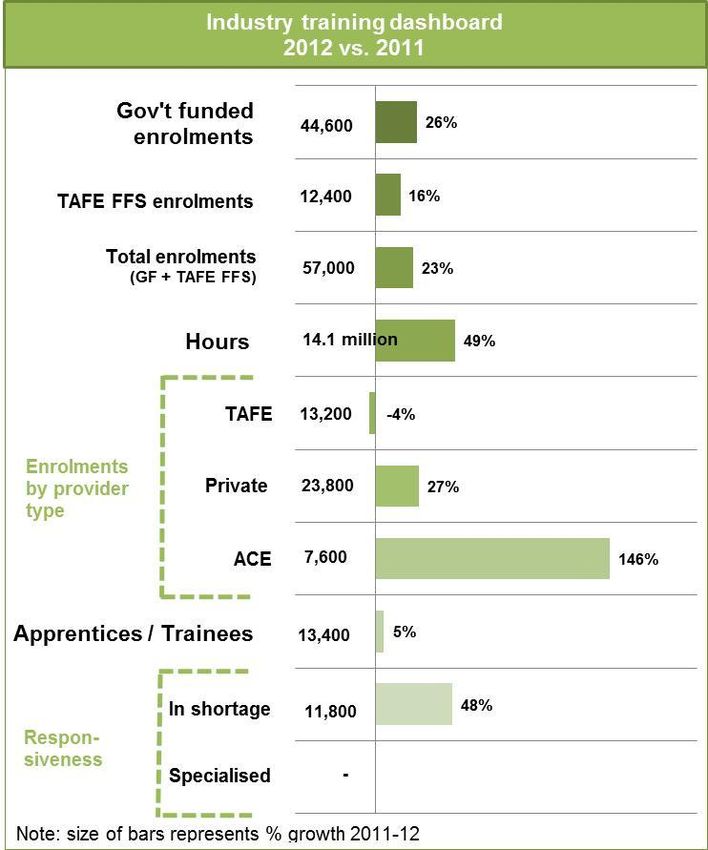
Industry Training Profiles
Administration and Support Services
Industry Overview
Figure 4.6: Industry share, 2011-12
4% The Administration and Support Services industry is
4% 4%
made up of Packaging Services, Travel Agency and
3% Tour Arrangement Services, Employment Services,
Building Cleaning, Pest Control and Gardening Services
and Other Administrative Services.
With output of $8.4 billion in 2011-12, Administration
and Support Services made up approximately 3 per cent
Employment Businesses Economic VET of the Victorian economy while accounting for 4 per cent
Output enrolments
Source: Monash CoPS, ABS, SVTS
of the total workforce.
Employment is forecast to increase by approximately
5,100 persons over the next five years, to 111,000 by
2016-17.
Building Cleaning, Pest Control and Gardening Services is the largest sub-sector by employment size,
accounting for approximately 41 per cent of all jobs in this industry, followed by Employment Services (29
per cent share).
Administration and Support Services has the fifth highest proportion of employees with no post-school
qualifications, and the highest proportion of employees with Certificate I-II qualifications of all Victorian
industries.
Figure 4.7: Forecasts to 2016-17 and 2011-12 current workforce age and qualifications
Key training challenges for the industry
The key challenges are ensuring enrolments are aligned to industry demand. This
includes:
o Call and Contact Centre enrolments that have grown significantly, yet this
sector is highly exposed to overseas competition via outsourcing
o Tourism, where job prospects are dampened by the high Australian dollar,
without subsequent changes in enrolment demand
Victorian Training Market Quarterly Report Full Year 2012 9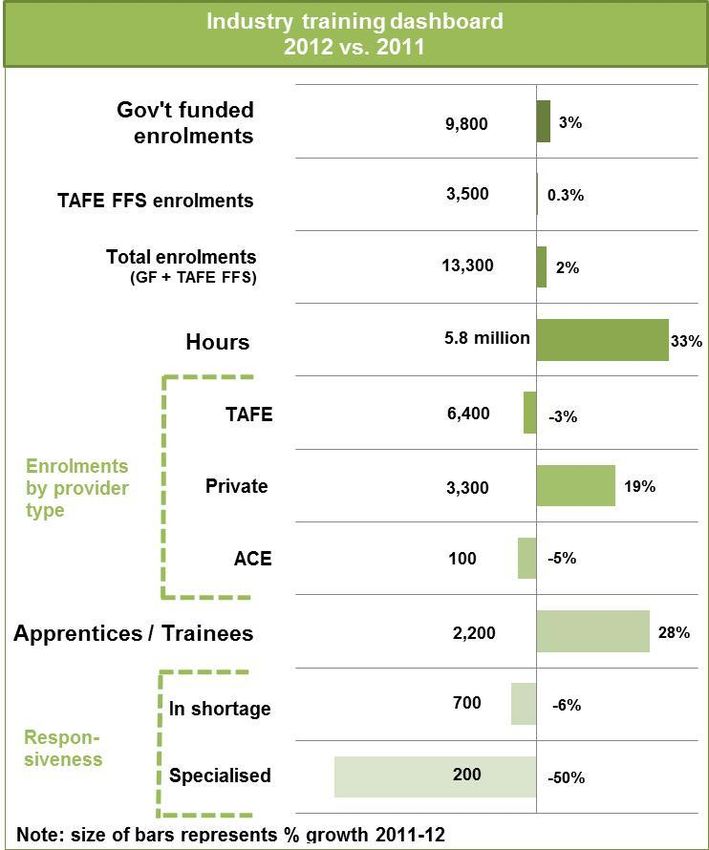
Industry Training Profiles
Training Delivery Overview6
Figure 4.8: Industry training comparisons Growth in government subsidised enrolments
2008 2009 2010 2011 2012
in Administration and Support Services
Administrative and courses has slowed. Enrolments reached
Support Services 15,100 11,400 14,400 20,600 21,600 21,600 in 2012, an increase of 5 per cent from
Year-on-year % 2011. This is considerably lower than the
change - -24% 26% 43% 5%
average for all industries, and growth over the
% change across all
industries - 3% 18% 32% 14%
previous two years.
The number of TAFE fee for service
enrolments increased by 21 per cent in 2012.
TAFE fee for service delivery now accounts
for 16 per cent of industry enrolments.
The occupation with the largest increase in
enrolments was Call or Contact Centre Team
Leader. Enrolments jumped by approximately
2,000 (65 per cent) between 2011 and 2012.
Enrolments related to Call or Contact Centres
now account for 55 per cent of all
Administration and Support Services training.
In percentage terms, enrolments in courses
related to the Tourist Information Officer
occupation showed strong growth in 2012, up
by over 700 per cent to almost 500
enrolments.
Enrolments in courses related to the Garden
Labourer occupation saw the largest decline
in 2012, down by about 600 (50 per cent).
Trainee enrolments decreased by about 700
(9 per cent) in 2012. This was largely due to a
decline in trainee enrolments relating to
Tourism Services, Call or Contact Centres
and Commercial Cleaning.
Training Breakdown
Women are slightly more likely than men to enrol in Administration and Support Services qualifications,
accounting for 54 per cent of industry enrolments (up from 51 per cent in 2010).
Figure 4.9: Government subsidised enrolments
Qualification level 2012 Age group 2012 Top qualifications 2012
(% change since 2011) (% total)
Certificate IV in Customer Contact 5,200
16,400
15 to 19 17% Certificate III in Customer Contact 4,800
Certificate III in Asset Maintenance
20 to 24 23%
2,000
(Cleaning Operations)
-21% -6% Certificate II in Customer Contact 1,800
14%
25 to 44 41%
2,800 2,400 Diploma of Events 1,200
45 to 64 18% These 5 courses accounted for 70% of all
Cert I-II Cert III-IV Diploma & Above government funded training in the industry
6
Scope of data is nationally accredited and recognised training at AQF level 1 and above. Comparisons with all-industry
training exclude foundation level training but includes vocational courses which do not align to a single ANZSIC industry (e.g.
business and administration). Commentary refers to government subsidised activity unless otherwise stated.
Victorian Training Market Quarterly Report Full Year 2012 10Industry Training Profiles
The age profile of those enrolling in Administration and Support Services courses is fairly consistent with
the Victorian average.
Enrolments at Certificate III–IV level continued to show strong growth in 2012, while Certificate I–II and
Diploma+ level enrolments declined. Certificate III–IV level enrolments now account for 76 per cent of
the total, up from 70 per cent in 2011.
Certificate IV in Customer Contact had the largest increase in enrolments in 2012 (up 2,000), followed by
Certificate III in Asset Maintenance (Cleaning Operations) (up 600). Certificate III in Tourism (Visitor
Information Services) grew to almost 300 enrolments.
Certificate III and IV in Customer Contact now account for 46 per cent of all Administration and Support
Services enrolments, up from 43 per cent in 2011.
For Administrative and Support Services related training, the top three reasons students were completing
a vocational training qualification was because it was a requirement of their job; to get a job or to get
extra skills for their current job. Around 69 per cent of students undertaking an Administrative and
Support Services related course held at least a Year 12 or equivalent qualification.
Training Provision Figure 4.10: Training provider share of enrolments
The enrolment share of private providers rose by
about 10 percentage points and now delivers three Provider share 2012
quarters of Administration and Support Services (change in percentage points since 2011)
training – a proportion which has been increasing 74%
since 2009.
There were 135 training providers delivering
government subsidised vocational training in
Administration and Support Services in 2012, 3 25%
more than in 2011. Of these, 95 delivered less -1%
than 100 enrolments in 2012. -9% 10%
2%
Fifty-seven per cent of Administrative and Support
TAFE Private ACE
Services enrolments involved some classroom
based delivery. Thirty per cent included
employment based training and a further 15 per Enrolments by Funding Band 2011 - 2012
cent involved recognition of prior learning,
recognition of current competency, or credit
transfer. Y2012 2%
5% 23% 35% 34%
In the Administrative and Support Services industry
7 per cent of enrolments were funded at subsidy
levels A and B, equating to 2,200 enrolments. Y2011 3%8% 19% 30% 40%
There has been a 3 percentage points decline in
bands A and B between 2011 and 2012. In 2012,
bands D and E represented 69 per cent of all
government subsidised enrolments or 15,100 A B C D E
enrolments. The share of bands D and E declined
by 1 percentage point over this same period.
Victorian Training Market Quarterly Report Full Year 2012 11Industry Training Profiles
Agriculture, Forestry and Fishing
Industry Overview
Figure 4.11: Industry share, 2011-12 Currently accounting for 3 per cent of Victoria’s industry
output in 2011-12, the Agriculture, Forestry and Fishing
(Agricultural) sector contributed nearly $8.6 billion to the
Victorian economy.
Forecasts to 2017 expect output in the Agricultural
sector to remain fairly static.
At present the industry employs around 79,400 people
(3 per cent of Victoria's workforce).
Forecasts also suggest that over 16,000 jobs could be
created by 2017, primarily driven by opportunities in the
Fishing sub-sector.
In 2011- 2012, the largest employing Agricultural sub-sectors were Sheep/Beef/Grain (employs one third
of the workforce) and Dairy Cattle (employs one quarter of the workforce).
There are over 46,000 businesses in operation within the sector, primarily based around Wimmera,
Mallee and the Western District. The sector forms 8 per cent of Victoria’s total number of businesses, but
this has declined by around 1,860 since 2009 when it represented 9 per cent of Victoria’s business base.
With over half of the workforce with no post-school qualifications and heavy reliance on an older
workforce, the industry faces several training challenges.
Figure 4.12: Forecasts to 2016-17 and 2011-12 current workforce age and qualifications
Key training challenges for the industry
Address identified skills shortages in the following occupations: Agricultural Consultant,
Agricultural Scientist, Arborist, Agricultural and Horticultural Mobile Plant Operator.
The industry is subject to numerous structural changes including those attributed to
climate change and the introduction of carbon tax, technological advancements and the
high Australian dollar. The industry has relatively low levels of attainment of accredited
qualifications compared to other industries, and also struggles to attract new entrants. It is
also dependent on a predominantly ageing workforce and thus requires rapid cross-
skilling and up-skilling to maintain competitiveness.
Continuing rationalisation of farms into larger corporate structures and competition is
changing the pattern of demand for on-farm skills including the need for professionally
trained farm managers with a range of production and operational skills.
Certain regional areas lack local training providers and the challenge remains in delivering
training via alternative means like online and practical learning.
Victorian Training Market Quarterly Report Full Year 2012 12Industry Training Profiles
Training Delivery Overview7
Figure 4.13: Industry training comparisons Enrolments in Agriculture, Forestry and
2008 2009 2010 2011 2012
Fishing related courses accounted for 9,800
Agriculture, Forestry government subsidised enrolments in 2012, up
and Fishing 7,800 7,600 7,900 9,500 9,800 by 3 per cent since 2011.
Year-on-year % TAFE fee for service enrolments made up 26
change - -3% 4% 20% 3%
% change across all
per cent of all enrolments within the
industries - 3% 18% 32% 14% Agricultural industry and has remained static
over 2011 – 2012.
Enrolments at TAFE providers declined in
2012 following historically high enrolments in
2011.
Twenty-two per cent of enrolments in this
industry were for apprenticeships/
traineeships, equating to 2,200.
In 2012, nearly 700 of all government
subsidised enrolments (7 per cent) were in
occupations identified as in skills shortage.
Over 500 of these enrolments were related to
occupations in Arboriculture, with the rest in
Agricultural Consultancy and Science. The
share of enrolments in occupations in shortage
decreased by 6 per cent following historically
high enrolments in 2011.
The largest volume of enrolments in
Agriculture is in skill sets related to safety and
compliance.
Two per cent of enrolments were in
occupations categorised as specialised.
Training Breakdown
Training interest in this industry has been
primarily male dominated. Seventy-nine per
cent of all Agricultural related enrolments are
from males
The 7,700 enrolments by men in 2012 are up
by 4 per cent since 2011. In 2012, enrolments
by females fell marginally by 1 per cent to
2,100.
Seventy-six per cent of enrolments (7,300) in
courses related to the Agricultural industry are
at Certificates III–IV levels, up by 22 per cent
since 2011.
7
Scope of data is nationally accredited and recognised training at AQF level 1 and above. Comparisons with all-industry
training exclude foundation level training but includes vocational courses which do not align to a single ANZSIC industry (e.g.
business and administration). Commentary refers to government subsidised activity unless otherwise stated.
Victorian Training Market Quarterly Report Full Year 2012 13Industry Training Profiles
Figure 4.14: Government subsidised enrolments
Qualification level 2012 Age group 2012 Top qualifications 2012
(% change since 2011) (% total)
Certificate III in Agriculture 2,900
7,300
15 to 19 16% Certificate IV in Agriculture 1,300
Certificate III in Production
20 to 24 14%
900
Horticulture
-34% 22% -18%
Certificate II in Agriculture 600
25 to 44 38%
1,400
1,100 Diploma of Agriculture 500
45 to 64 29% These 5 courses accounted for 64% of all
Cert I-II Cert III-IV Diploma & Above government funded training in the industry
There has been a significant uptake of Certificate IV in Agriculture (up by 63 per cent) and Certificate III in
Production Horticulture (up by 84 per cent) over 2011–2012 which may explain the rise in enrolments at
Certificates III–IV levels.
Enrolments at Certificates I–II level and Diploma+ levels have fallen over the same period (by 34 per cent
and 15 per cent respectively). This may be attributed to the fall in enrolments in the Certificate II in
Agriculture (down by 25 per cent) and Diploma of Agriculture (down by 13 per cent).
38 per cent of enrolments in 2012 were from the 25–44 age group, followed by the 45–64 age group who
accounted for 29 per cent of enrolments. Both age groups reported a rise in enrolments over 2011–2012
(25–44 age group up by 2 per cent; 45–64 age group up by 13 per cent).
For Agriculture, Forestry and Fishing related training, the top three reasons students were completing a
vocational training qualification was because it was a requirement of their job; to get extra skills for their
current job or for personal interest or self-development. Around 48 per cent of students undertaking a
Agriculture, Forestry and Fishing related courses held at least a Year 12 or equivalent qualification.
Victorian Training Market Quarterly Report Full Year 2012 14Industry Training Profiles
Training Provision Figure 4.15: Training provider share of enrolments
There were 43 training providers delivering
government subsidised vocational training related to
the Agriculture, Forestry and Fishing industry in
2012.
In 2012, Private Registered Training Organisations
(RTOs) made up nearly half of the providers (49 per
cent) delivering training in courses related to this
industry.
The number of ACE providers has risen over 2011–
2012 by 20 per cent, whereas private RTOs have
fallen by 9 per cent.
TAFE provider share of government subsidised
training has fallen from 82 per cent of enrolments in Enrolments by Funding Band 2011 - 2012
2008 to 65 per cent in 2012, whereas the share of
private RTOs has increased from 16 per cent of
enrolments in 2008 to 34 per cent in 2012. Y2012 5% 83% 11%
Forty-one per cent of Agriculture, Forestry and
Fishing enrolments involved some classroom based
delivery. Twenty per cent included employment Y2011 4% 82% 14%
based training and a further 41 per cent involved
recognition of prior learning, recognition of current
competency, or credit transfer.
A B C
In the Agriculture, Forestry and Fishing industry 89 per cent of enrolments were funded at subsidy levels
A and B, equating to 8,700 enrolments. There has been a 3 percentage point growth in bands A and B
between 2011 and 2012.
Victorian Training Market Quarterly Report Full Year 2012 15Industry Training Profiles
Arts and Recreation Services
Industry Overview
Figure 4.16: Industry share, 2011-12 Employment in the Arts and Recreation Services
industry represented 58,300 workers in 2011-12.
5% Almost half the workers in the industry are employed in
the Sports and Recreation Activities sector with the
remainder shared across Heritage, Creative and
2% Performing Arts and Gambling Activities.
1% 2%
Employment growth of 1,100 is anticipated over the next
five years, with the majority in the Creative and
Performing Arts sector.
Employment Businesses Economic VET
Output enrolments Forecasts indicate the industry’s share of Victorian
Source: Monash CoPS, ABS, SVTS output will rise slightly over the next few years, to 3 per
cent of the total by 2016-17.
Arts and Recreation Services has approximately 7,400 enterprises in Victoria.
A number of sectors in this industry, particularly the Sports and Recreation Activities sector, are highly
reliant on a volunteer workforce, which poses challenges for worker retention and skill acquisition.
The industry’s workforce is also characterised by a younger than average employee profile.
The Arts and Recreation industries play important role culturally, socially and economically in Victoria,
both in Melbourne and in Victoria’s regions. Businesses operating in this sector require workers with a
diverse range of skills, from technical ability through to business acumen, in order to success in a
commercial environment.
The Recreation sector is focusing on increasing participation in sport and physical activities in line with a
greater focus on preventative health in Australia.
Figure 4.17: Forecasts to 2016-17 and 2011-12 current workforce age and qualifications
Key training challenges for the industry
There are no identified skill shortage occupations specific to this industry, although
identified shortages in the occupation Community Worker affect the Arts and Recreation
industry. Emerging shortages have also been flagged in aquatics skills, particularly in
regional locations.
Business, management and customer service skills are increasingly required by
employees in arts and entertainment sectors, in addition to their technical skills and artistic
skills.
Providing information about job prospects and career outcomes is important in this
industry, via services such as the Victorian Skills Gateway, to ensure prospective students
are making well-informed choices about their future career.
Victorian Training Market Quarterly Report Full Year 2012 16Industry Training Profiles
Training Delivery Overview8
Figure 4.18: Industry training comparisons Enrolments in Arts and Recreation courses were
2008 2009 2010 2011 2012 26,700 in 2012, representing a slight decline of 3
Arts and Recreation per cent when compared with 2011 enrolments.
Services 13,500 14,700 19,000 27,500 26,700
Year-on-year % While enrolments in Arts and Recreation courses
change - 9% 29% 45% -3% have declined, student contact hours in this
% change across all
industries
industry have increased by 12 per cent,
- 3% 18% 32% 14%
representing a trend towards more time intensive
training.
Courses in Community Recreation and Activity
(aligned to the shortage occupation Community
Worker) have shown a high rate of growth in
2012, up by over 80 per cent since 2011 –
although this is off a very small base.
Training Breakdown
There are a diverse range of qualifications in the
Arts and Recreation services industry, covering
Sports and Recreation, Music and Performing
Arts, Arts Administration and some elements of
Horticulture (Parks and Gardens and Sports
Ground Maintenance).
Courses aligned to the Sports and Recreation
sector comprise a majority of Arts and Recreation
enrolments, 70 per cent in 2012. Creative and
Performing Arts is the next most popular sector in
terms of course enrolments, 22 per cent of the
total. Enrolments in Performing Arts declined in
2012, down by 10 per cent, while Sports and
Recreation enrolments remained relatively flat,
increasing by 3 per cent.
Fitness Instructor courses continue to attract the most enrolments in this industry, with enrolments
relating to this occupation increasing by 18 per cent in 2012 (an additional 1,700 enrolments). This
represents a significant slowdown in growth when compared to the 2010 to 2011 period that saw an
increase of 128 per cent.
Enrolments linked to the occupation Sportspersons showed the largest decline in 2012, down by 1,500
enrolments (or 79 per cent), driven largely by lower enrolments in Certificate II in Sport (Career Oriented
Participation).
Figure 4.19: Government subsidised enrolments
Qualification level 2012 Age group 2012 Top qualifications 2012
(% change since 2011) (% total)
Certificate III in Fitness 5,600
17,800
15 to 19 41% Certificate IV in Fitness 4,700
Certificate III in Sport and
20 to 24 23%
1,300
Recreation
-34%
8%
Diploma of Music 950
5,400 25 to 44 25%
3,500
Diploma of Visual Art 850
-7%
45 to 64 9% These 5 courses accounted for 51% of all
Cert I-II Cert III-IV Diploma & Above government funded training in the industry
8
Scope of data is nationally accredited and recognised training at AQF level 1 and above. Comparisons with all-industry
training exclude foundation level training but includes vocational courses which do not align to a single ANZSIC industry (e.g.
business and administration). Commentary refers to government subsidised activity unless otherwise stated.
Victorian Training Market Quarterly Report Full Year 2012 17Industry Training Profiles
The proportion of enrolments in Certificate III-IV level qualifications has increased over the last 12
months, with 67 per cent of enrolments at this level compared with 60 per cent in 2011. The proportion of
those choosing to study at Certificate I-II level has fallen by 6 percentage points over the same period,
with the proportion of Diploma+ enrolments remaining relatively stable.
Apprentice and trainee enrolments comprise 12 per cent of total enrolments in Arts and Recreation
courses. Gardener and Greenkeeper (working in the Sports and Recreation sector) qualifications are the
most popular apprenticeship enrolments.
Women account for 43 per cent of enrolments in this industry, up from 40 per cent in 2011. Women are
more likely than men to enrol in courses aligned to Visual Arts and Crafts Professionals and Copywriters
(women accounted for 73 per cent and 68 per cent of enrolments in these courses in 2012), while men
account for a majority of enrolments in courses aligned to Music Professionals, Sports Development
Officers and Outdoor Education Guides. Women account for just 1 per cent of enrolments in
Greenkeeper courses and no enrolments aligned to Sportspersons.
For Arts and Recreation Services related training, the main reasons students were completing a
vocational training qualification was for personal interest or self-development or to get a job. Around 62
per cent of students undertaking Arts and Recreation Services related courses held at least a Year 12 or
equivalent qualification.
Training Provision Figure 4.20: Training provider share of enrolments
Private training providers deliver just over half of all
training in Arts and Recreation Services (54 per Provider share 2012
(change in percentage points since 2011)
cent), with TAFE Institutes accounting for 42 per
cent. ACE providers make up the remaining 4 per 54%
cent of enrolments, a proportion which has
42%
remained constant from 2011.
Of the top ten Arts and Recreation services
occupations in terms of 2012 enrolments, TAFE -3% 3%
providers delivered a majority of training aligned to
the occupations Visual Arts and Crafts 4%
Professionals, Copywriters, Forestry Workers,
TAFE Private ACE
Horse Trainers and Gardeners.
Private providers delivered a majority of training
linked to Fitness Instructors, Music Professionals,
Sports Development Officers and Outdoor
Adventure Guides.
78 providers delivered government subsidised
training in Arts and Recreation qualifications in
2012, down from 80 in 2011. Of these, just under
half (36 providers) delivered less than 100
enrolments in 2012.
Sixty-seven per cent of Arts and Recreation
Services enrolments involved some classroom
based delivery. Ten per cent included employment
based training and a further 14 per cent involved recognition of prior learning, recognition of current
competency, or credit transfer.
In the Arts and Recreation Services industry 16 per cent of enrolments were funded at subsidy levels A
and B, equating to 6,300 enrolments. There has been a 1 per cent decline in bands A and B between
2011 and 2012. In 2012, bands D and E represented 74 per cent of all enrolments or 19,700 enrolments.
The percentage share of bands D and E increased by 7 percentage points over this same period.
Victorian Training Market Quarterly Report Full Year 2012 18Industry Training Profiles
Construction
Industry Overview
Figure 4.21: Industry share, 2011-12 Construction contributed $21.6 billion to Victoria’s
output in 2011-12, representing 7 per cent of the
total and forecast to grow to 8 per cent in output
terms through the next five years to 2016-17.
Construction employs approximately 251,000
people, the industry is expected to grow in
employment by approximately 13 per cent or 33,000
jobs in Victoria over the next five years.
Most of this growth is anticipated in the Construction
Services sector, representing 75 per cent of all
growth to 2016-17.
It is estimated that there are currently around 89,000 Construction businesses operating across Victoria,
of which 60 per cent are sole traders. Approximately 5 per cent of firms have turnover greater than $2
million per annum.
Overall, the sector fared reasonably well during the recent Global Financial Crisis, mainly as a result of
large-scale public infrastructure investment as part of the government’s stimulus and infrastructure
program, and construction activity related to the mining boom.
However, house building in particular, and commercial construction to a lesser extent has suffered due to
lower consumer confidence levels suppressing demand.
The workforce is predominantly younger in age with 67 per cent aged 44 or below (all-industry average is
62 per cent).
The industry is almost exclusively staffed by males, who represent 92 per cent of the workforce. Females
are more prevalent in the older age categories, with 52 per cent in the 45+ age group.
The industry is also predominantly one with a full-time workforce – 84 per cent of employees in the sector
are full-time, compared to 69 per cent on average across all industries.
Currently, 64 per cent of the Construction industry holds a qualification at a Certificate I or above level.
For the sector there remains concern that the language, literacy and numeracy (LLN) skills of existing
workers and new entrants are limited in segments of the industry.
Figure 4.22: Forecasts to 2016-17 and 2011-12 current workforce age and qualifications
Victorian Training Market Quarterly Report Full Year 2012 19Industry Training Profiles
Key training challenges for the industry
There are a prevalence of skills shortages in this sector including: Air-conditioning and
Mechanical Services Plumber; Air-conditioning and Refrigeration Mechanic; Bricklayer;
Building Associate; Building Inspector; Carpenter; Civil Engineering Draftsperson; Civil
Engineering Technician; Construction Estimator; Electrical Engineering Technician;
Electrician (General); Electronic Instrument Trades Worker (General) and (Special Class);
Fibrous Plasterer; Floor Finisher; Gasfitter; Glazier; Joiner; Mechanical Engineering
Technician; Plumber (General); Roof Tiler; Solid Plasterer; Wall and Floor Tiler.
Population growth and recent interest rate reductions are expected to kick-start the
housing market, again putting pressure on the labour market for experienced workers in
the sector.
There is a need to support industry to utilise alternative assessment processes and
recognition of prior learning to manage registration requirements.
Providing training opportunities around new regulatory changes, and up-skilling of existing
workforce is required in the sector.
To ensure training packages reflect new technologies and materials on the market, the
training market needs to provide continued opportunity for workers to be trained using the
latest technologies.
Shifting demand in the Construction industry requires a broad range of transferrable skills,
creating demand for increasingly multi-skilled workers.
Attraction of more females into the industry, especially into some of the in shortage
occupation areas can support the industry to meet future skills demand.
Training Delivery Overview
Figure 4.23: Industry training comparisons Construction related courses accounted for
2008 2009 2010 2011 2012
52,000 enrolments in 2012, growing 9 per cent
Construction 31,900 33,000 42,500 47,800 52,000
since 2011.
Year-on-year % Over 65 per cent of these enrolments were in
change - 3% 29% 12% 9%
% change across all occupations identified as in skills shortage, and
industries - 3% 18% 32% 14% included related occupations such as Electricians,
Plumbers, Carpenters and Joiners.
TAFE fee for service training represented around
16,200 enrolments in 2012, with growth of 7 per cent
since 2011.
Student contact hours have grown markedly in the
sector increasing 31 per cent between 2011 and
2012 to 19.2 million student contact hours,
representing a shift towards more time intensive
courses.
Apprenticeships and traineeships in the sector
declined in 2012, falling 5 per cent to
approximately 25,700 apprentices and trainees.
Sixty-five per cent of this decline related to
apprenticeships in Carpentry, Bricklaying and
Electrical. This reflects a slowdown in the
industry, with growth in Construction output
negative in 2011-12 (about -3 per cent) and the
third lowest of all Victorian industries.
Victorian Training Market Quarterly Report Full Year 2012 20Industry Training Profiles
Training Breakdown
Vocational training in the Construction sector is
predominately at the Certificate III and IV level,
with around four out of five construction courses
or approximately 42,500 enrolments at these
qualification levels.
Figure 4.24: Government subsidised enrolments
Qualification level 2012 Age group 2012 Top qualifications 2012
(% change since 2011) (% total)
42,500 Certificate III in Carpentry 6,500
15 to 19 31% Certificate III in Electrotechnology 6,400
Electrician
20 to 24 32%
Certificate III in Plumbing 5,500
-19%
14% 28% Certificate III in Civil Construction
4,900
Plant Operations
25 to 44 29%
7,300 Certificate III in Painting and
2,900
2,200
Decorating
45 to 64 7% These 5 courses accounted for 51% of all
Cert I-II Cert III-IV Diploma & Above government funded training in the industry
There has been a decrease in the proportion of qualifications studied at Certificate I-II level since 2011,
with a subsequent rise in Certificate III-IV and Diploma and above.
The gender profile of students studying Construction related courses is in the main male (97 per cent). By
age group nearly two-thirds of students are aged between 15 and 24 years, a younger student profile
than the all-industry average.
Enrolments in four of the top five Construction related qualifications grew between 2011 and 2012, with
the largest growth seen for the Certificate III in Painting and Decorating. This course grew from around
700 to 2900 enrolments over this time period.
There was a marked increase in the Certificate II in Plumbing (Pre-apprenticeship) growing by around
700 enrolments between 2011 and 2012.
The Certificate III in Plumbing declined slightly over this period, falling by 80 enrolments.
For Construction related training, the top three reasons students were completing a vocational training
qualification was because it was a requirement of their job; to get a job or to get extra skills for their
current job. Around 60 per cent of students undertaking a Construction related course held at least a
Year 12 or equivalent qualification.
Victorian Training Market Quarterly Report Full Year 2012 21Industry Training Profiles
Training Provision Figure 4.25: Training provider share of enrolments
Private Registered Training Organisations' (RTOs)
share of government subsidised vocational training Provider share 2012
(change in percentage points since 2011)
has increased from 12 per cent of enrolments in
2008 to 32 per cent in 2012. 67%
There were 78 training providers delivering
government subsidised training related to the
Construction sector in 2012, of which 16 had over 32%
1,000 enrolments in the year.
-10%
Seventy-eight per cent of Construction enrolments 10%
involved some classroom based delivery. Ten per 1%
cent including employment based training and a TAFE Private ACE
further 13 per cent involved recognition of prior
learning, recognition of current competency, or
credit transfer.
In the Construction industry 96 per cent of
enrolments were funded at subsidy levels A and B,
equating to 46,000 enrolments. There has been a
marginal decline in bands A and B between 2011
and 2012, with a corresponding increase in band C.
Victorian Training Market Quarterly Report Full Year 2012 22Industry Training Profiles
Education and Training
Industry Overview
Figure 4.26: Industry share, 2011-12
There are nearly 6,600 businesses currently operating
in this sector.
At present, the Education and Training industry
accounts for 5.7 per cent of Victoria’s industry output.
Forecasts to 2017 suggest output in the sector will
remain relatively stable.
There are approximately 6,600 Education and Training
organisations in Victoria. Approximately 30 per cent of
businesses in this sector are medium or large,
contrasting with most other industries where businesses
are predominately small.
Currently employing around 224,400 people (nearly 8 per cent of Victoria’s workforce), employment in
the industry is forecast to grow by 8 per cent by 2017, creating as many as 18,600 jobs.
Presently, the majority (over 58 per cent) of those employed in this sector fall under the Preschool/
School Education sub-sector, followed by about 28 per cent under Tertiary Education.
The majority of the workforce has higher education qualifications (58 per cent). The workforce also
generally tends to be spread evenly across all age bands.
Figure 4.27: Forecasts to 2016-17 and 2011-12 current workforce age and qualifications
Key training challenges for the industry
Population and social factors have led to an increase in demand for educators.
Furthermore, Victoria has invested well in its tertiary education sector, thereby attracting
large numbers of foreign students. Advancements in technology and changes in workforce
structure have led to rising demand for educators in the vocational training sector.
Address identified skills shortages in Early Childhood (Pre-primary School) Teacher and
Vocational Education Teacher. There is specific demand for skilled educators in areas of
Nursing, Electrotechnology, Automotive and Construction.
Victorian Training Market Quarterly Report Full Year 2012 23Industry Training Profiles
Training Delivery Overview9
Figure 4.28: Industry training comparisons Education and Training related courses
accounted for 10,100 enrolments in 2012.
Between 2011 and 2012, government
subsidised enrolments in courses related to
this industry experienced a marginal fall
(down by one per cent), whereas, enrolments
in TAFE domestic fee for service reported a
13 per cent rise.
Over 5,600 of these overall enrolments (56
per cent) were in occupations identified as in
skills shortage.
Enrolments in Education courses related to
skills shortage occupations have gone up by
20 per cent since 2011.
Training Breakdown
55 per cent of all Education related
enrolments are from females; the 5,600
enrolments in 2012 are up by 7 per cent since
2011. In 2012, enrolments by males were
4,500, down by 9 per cent since 2011.
85 per cent of enrolments (8,600) in courses
related to the Education industry are at
Certificate III–IV level. However, enrolments
in Certificate III–IV level courses have fallen
by 5 per cent over 2011 – 2012. Enrolments
in Diploma+ courses have fallen as well.
Figure 4.29: Government subsidised enrolments
Qualification level 2012 Age group 2012 Top qualifications 2012
(% change since 2011) (% total) Certificate IV in Training and
5,300
Assessment
8,600
15 to 19 15% Certificate III in Education Support 1,400
20 to 24 11%
Certificate IV in Education Support 450
-5% -10% Certificate II in Outdoor Recreation 300
445%
25 to 44 43%
Certificate III in Business
250
950 Administration (Education)
550
45 to 64 30% These 5 courses accounted for 76% of all
Cert I-II Cert III-IV Diploma & Above government funded training in the industry
There has been a significant rise in enrolments (445 per cent) at Certificate I–II level over the same period,
primarily driven by enrolments in Certificate II in Outdoor Recreation (up by 2116 per cent since 2011).
Nearly half the enrolments (43 per cent) in 2012 were from the 25–44 age group, followed by the 45–64
age group who accounted for 30 per cent of enrolments. However, there were fewer enrolments from both
age groups compared to numbers in 2011 (down by 1 per cent and 9 per cent respectively).
The 20–24 age group has seen the highest rise in enrolments since 2011 (10 per cent) and currently
9
Scope of data is nationally accredited and recognised training at AQF level 1 and above. Comparisons with all-industry
training exclude foundation level training but includes vocational courses which do not align to a single ANZSIC industry (e.g.
business and administration). Commentary refers to government subsidised activity unless otherwise stated.
Victorian Training Market Quarterly Report Full Year 2012 24Industry Training Profiles
account for 11 per cent of enrolments in courses related to the Education and Training industry.
For Education and Training related courses, the top three reasons students were completing a vocational
training qualification was to get a job, for personal interest or self-development or to get extra skills for their
current job. Around 74 per cent of students undertaking an Education and Training related course held at
least a Year 12 or equivalent qualification.
Training Provision Figure 4.30: Training provider share of enrolments
There were 166 training providers delivering
government subsidised vocational training related
to the Education and Training industry in 2012.
In 2012, private Registered Training Organisations
(RTOs) made up over half of the providers (63 per
cent) delivering training in courses related to this
industry.
Both the number of private RTOs and ACE
providers have risen over 2011–2012 (up by 16 per
cent and 7 per cent respectively). TAFE providers
have remained the same.
Private RTOs share of government subsidised
training has increased from 12 per cent of
enrolments in 2008 to 52 per cent in 2012.
In the Education and Training sector 90 per cent of
enrolments were funded at subsidy levels B and C,
equating to 8,800 enrolments. There has been a 3
percentage point growth in bands B and C between
2011 and 2012.
Seventy-seven per cent of Education and Training
enrolments involved some classroom based
delivery. Seven per cent included employment
based training and a further 12 per cent involved
recognition of prior learning, recognition of current
competency, or credit transfer.
Victorian Training Market Quarterly Report Full Year 2012 25You can also read