OUR STRATEGY AND PERFORMANCE REVIEW - TFG ...
←
→
Page content transcription
If your browser does not render page correctly, please read the page content below

OUR STRATEGY AND PERFORMANCE REVIEW

OUR
STRATEGY AND
PERFORMANCE
REVIEW

Chief Executive Officer’s report                     52
Strategy overview                                    56
Chief Financial Officer’s report                     66
Segmental performance review                         72

                       TFG Integrated annual report 2018
                                                           51
                                   www.tfglimited.co.za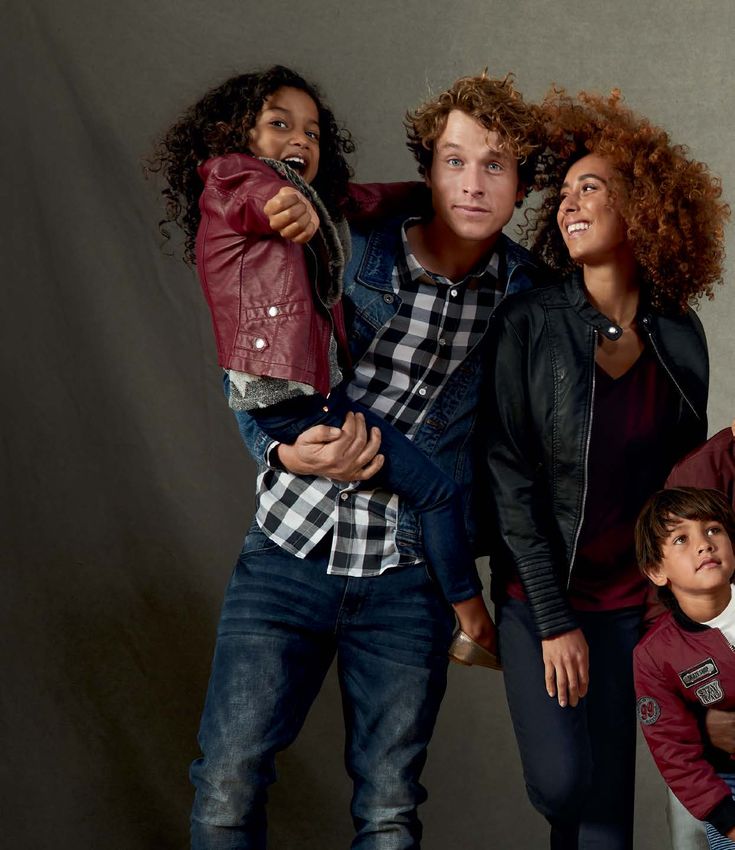
CHIEF EXECUTIVE
          OFFICER’S REPORT
                         DOUG MURRAY

     I am pleased to present my 11th and last report as            SIGNIFICANT CHANGES DURING THE YEAR
     Chief Executive Officer of TFG. After 33 years with           The following significant changes occurred within the
     the Group, I will step down as CEO at our AGM on              Group during the year:
     3 September 2018 and retire from the Group at the
     end of September 2018. I do, however, look forward            •   As was announced on SENS on 25 May 2017, with a
     to continuing to be involved in the Group, initially as a         further update on 14 July 2017, the Group acquired,
     consultant through to September 2019 and thereafter               through a wholly owned subsidiary, the entire issued
     as a non-executive director.                                      ordinary and preference share capital of Retail Apparel
                                                                       Group (RAG). The effective date of the acquisition
     The 2018 financial year marked a very challenging trading         was 24 July 2017 and as a result, eight months’
     environment, with political and economic uncertainty              trading of RAG has been included in the Group’s 2018
     clouding both the South African as well United Kingdom            performance.
     economies, two of the three major economies in which we       •   A R2,5 billion accelerated bookbuild was successfully
     trade. High unemployment and low GDP growth continued             launched on 31 July 2017 to fund the acquisition of
     to constrain South Africa’s growth while the country              RAG. As a result, 17 241 380 ordinary shares were
     remained politically unsettled for the majority of the year       issued at R145 per share, a 0,9% premium to the
     with corruption continuing to negatively impact business          30-day VWAP of R143,68 as at the close of trade on
     and consumer confidence.                                          31 July 2017.

     While we are encouraged by the recent political               •   In addition, and as was announced on SENS on
     events which are positive for the country, we acknowledge         7 November 2017, the Group acquired, through
     that the economic fundamentals of a country do not                its United Kingdom subsidiary TFG Brands
     change overnight and continued effort is required both            (London) Limited, the entire issued share capital
     by government as well as business to restore the                  of Hobbs. The effective date of the acquisition was
     country’s economy.                                                25 November 2017 and four months’ trading of Hobbs
                                                                       has been included in the Group’s 2018 performance.
     Against the backdrop of these challenging trading             •   The Group accelerated the put/call arrangement to
     circumstances, we are pleased with the good results               acquire the remaining c.15% shareholding owned by
     produced by the Group for the year, which come on the             management in TFG Brands (London) Limited. The
     back of several years of good turnover and earnings               transaction was effective 15 December 2017.
     growth. The salient features of the year are highlighted on
     page 53, with further detailed information on our financial
     performance provided in our Chief Financial Officer’s
     report on page 66.

52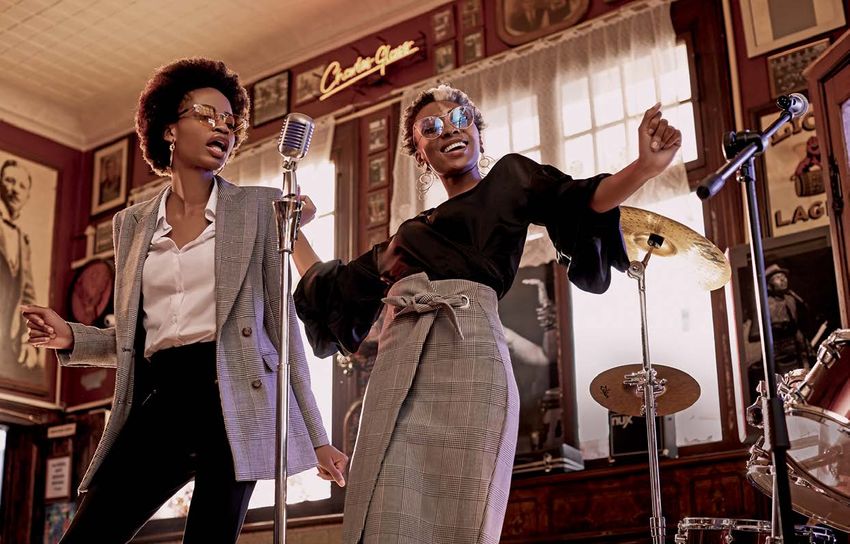
OUR STRATEGY AND PERFORMANCE REVIEW
                                                                                  CHIEF EXECUTIVE OFFICER’S REPORT / CONTINUED

SALIENT FEATURES

    R28,6 billion                                                  +3,5% to 745,0 cents
    GROUP TURNOVER                                                 TOTAL DIVIDEND PER SHARE

    +9,6%                                                          R223,75
    GROWTH IN HEADLINE EARNINGS EXCLUDING                          SHARE PRICE AT 31 MARCH
    ACQUISITION COSTS                                              (March 2017: R154,49)

    +3,4% to 1 136,5 cents                                         20,67
    HEPS (EXCLUDING ACQUISITION COSTS)                             PRICE EARNINGS RATIO AT 31 MARCH
                                                                   (March 2017: 13,94)

    +5,0% to 420,0 cents                                           R52,9 billion
    FINAL DIVIDEND PER SHARE                                       MARKET CAPITALISATION AT 31 MARCH
                                                                   (March 2017: R33,9 billion)

STRATEGIC DEVELOPMENTS DURING THE YEAR                             PROFIT
The consistency of and the ongoing focus on our strategic
objectives and the strong desire both by management as         •    Gross margin was expanded in TFG Africa as well as in
well as employees to execute these strategies, continues            the Group despite tough trading conditions.
to benefit the Group.                                          •    The Group’s free cash flow significantly improved
The key highlights of our strategic performance during the          coming off a high base in the previous year.
past financial year were the following:                        •    Quick response units within TFG Manufacturing grew
                                                                    by 50% to 3,6 million units for the year.

    CUSTOMER                                                   •
                                                                   GROWTH
•    The Group’s continued investment in analytics created
     further opportunities to improve our customer             •    The acquisition of RAG enabled the Group to establish
     experience and customer engagement levels.                     an Australian TFG platform.
•    Our customers were provided with additional online        •    The iconic British brand Hobbs was acquired,
     brand offerings as we continued the e-commerce                 complementing the current brands in the Group’s
     roll-out during the year.                                      TFG London platform.
•    Our loyalty programme, TFG Rewards, was further           •    An additional four brands launched their online selling
     entrenched with both our existing customers and                during the year, bringing the total number of brands
     new customers acquired during the year.                        available online to our customers throughout the
•    The Group’s Voice of Customer (VoC) programme was              Group to 20.
     expanded to include all TFG Africa’s brands.              •    Trading space within TFG Africa grew by 3,5% net
                                                                    (4,9% new) during the year.
                                                               •    The Group now trades through 4 034 outlets in
    LEADERSHIP                                                      32 countries across five continents.

•    The succession for the Chief Executive Officer position   The strategic achievements listed above cannot be
     was finalised in March 2018 with the appointment          achieved without good communication throughout
     of Anthony Thunström, our current Chief Financial         the business, quality management teams and quality
     Officer, as CEO Designate.                                employees executing the strategy. A key enabler and
•    The process to recruit a new Chief Financial Officer is   focus area for the Group going forward will be continued
     currently well advanced.                                  investment in digital transformation, to ensure that the
•    The Group received accreditation status as a training     Group is well positioned to continue to deliver on its
     provider offering a retail qualification for customer-    strategic pillars and objectives.
     facing employees.
•    Our Voice of Employee (VoE) platform was introduced
     during the year, encouraging employees to freely share
     their ideas and feedback for business improvement.
                                                                                             TFG Integrated annual report 2018
                                                                                                                                 53
                                                                                                         www.tfglimited.co.za
•                                                             SUSTAINABILITY
         PERFORMANCE REVIEW TFG AFRICA
                                                                   We continued to position our sustainability strategy in the
     TFG Africa had pleasing turnover growth during the year       shared value space, with a strong focus on supply chain
     in a difficult trading environment. We are particularly       development. This enables us to focus on the creation of
     satisfied with the performance of clothing, growing at        shared value – in both financial and social terms – within
     9,4% for the year on the back of 8,6% turnover growth in      our core supply chain operations.
     the previous year. Overall, TFG Africa achieved turnover
     growth of 6,3% for the year with same store turnover          Our strategy is underpinned by four pillars:
     growth of 2,2%.
                                                                   •   Local Supply Chain Development
     Gross margin also improved to 47,8% from 46,4% at             •   Environment Efficiency
     March 2017, a good performance in a deflationary product      •   Accountability, Ethics and Governance
     price environment and in a market categorised by high         •   Drive Empowerment
     levels of discounting.
                                                                   The links between our business strategy and sustainability
                                                                   strategy are highlighted on page 57 of this report. Further
         PERFORMANCE REVIEW TFG LONDON                             information on our sustainability initiatives, progress and
                                                                   approach can be found in our sustainability overview
     As has been well publicised, retail trading conditions in
                                                                   report, which is available on our website.
     the United Kingdom have been extremely tough against a
     background of difficult Brexit negotiations and constrained
                                                                   RISK OVERVIEW
     economic growth. Against this backdrop, we consider the
                                                                   The most significant risks to the Group, identified in the
     performance of TFG London to be satisfactory.
                                                                   2018 report, are similar to those identified in previous
                                                                   years and are listed in the Risk Committee report on
     Encouragingly, our online turnover continued to grow
                                                                   page 110. The following risks increased in significance
     at a fast pace, enabling us to largely offset the declining
                                                                   during the year:
     footfall in standalone outlets. The ongoing implementation
     of Phase Eight’s business model into Whistles,
                                                                   •   Threat of cyber attacks: Globally, the risk related
     underpinned their continuing positive turnaround while
                                                                       to IT environments continues to increase with the
     the acquisition of Hobbs in November last year has now
                                                                       introduction of further legislation, threat of cyber
     created a substantial retail platform for TFG London.
                                                                       attacks and the increased reliance on technology.
                                                                       TFG continues to invest in and improve IT processes,
     The focus going forward will be on creating a shared
                                                                       providing regular updates to the Operating Board and
     service structure, similar to that of TFG Africa and
                                                                       Risk Committee.
     TFG Australia, and the continued implementation
                                                                   •   The change in the VAT rate and the limited transitional
     of the business model into Whistles and Hobbs.
                                                                       period: The increase in the VAT rate was identified as a
                                                                       significant risk to TFG Africa. The risk was successfully
         PERFORMANCE REVIEW TFG AUSTRALIA                              reduced through establishing dedicated project teams
                                                                       to handle the transition.
     We were delighted to acquire RAG during the year which
     we believe is a quality asset with a quality management       Managing the risk of fashion and ensuring the desirability
     team. Despite the perceived negativity around Australian      of merchandise remain key risks for all retailers.
     retail, RAG produced a good result for the year with          The Group’s buying processes, in-house design and
     consistent strong growth, ahead of our expectation and        manufacturing capability, and focus on quick response and
     ahead of peer groups.                                         replenishment, are key differentiators in the mitigation of
                                                                   these risks.
     The transition of the business into TFG has gone well
     and we are confident about the future growth prospects        Further information on our risks, risk methodologies
     of the five brands: Connor, Johnny Bigg, Rockwear,            and combined assurance process can be found in our
     Tarocash and yd.                                              Risk Committee report on page 106.

     Furthermore, we are excited that we will be testing one of
     our TFG Africa brands in Australia later this year.

54
OUR STRATEGY AND PERFORMANCE REVIEW
                                                                                 CHIEF EXECUTIVE OFFICER’S REPORT / CONTINUED

OUR PEOPLE                                                     I am delighted to hand over the CEO reigns to
A key strength and differentiator for TFG remains our          Anthony Thunström, our current CFO. It is gratifying
culture and our people. We recognise the talent and            that an appointment of this importance and stature has
commitment of our more than 27 800 employees without           come from within the Group given our focus on executive
whom the Group’s performance this year would not have          development. He is an extremely capable leader and
been possible.                                                 inherits outstanding management teams in Africa, London
                                                               and Australia. I believe the Group is well positioned to
We continue to invest in the development of our people         achieve continued growth well into the future in the
through training, both externally as well as through our       ever-changing retail environment.
TFG Retail Academy, in order to develop the appropriate
skills at every level of employment within the Group.          APPRECIATION
                                                               In concluding my final CEO report, I would like to record
Employment equity and transformation remain key                my sincere appreciation and thanks to every member of
focus areas for TFG Africa with 93,9% of our South             staff whom I have had the pleasure of interacting with
African employees, as at March 2018, being from                over my 33 years with the Group and in particular the last
designated groups.                                             11 as CEO.

OUTLOOK                                                        I would also like to thank our Chairman, Michael Lewis, for
We remain cautiously optimistic around the outlook             his invaluable input, wisdom and support over many years
for South Africa given the inauguration of President           and my colleagues on the Supervisory Board for their
Ramaphosa in February 2018. While the recent court             guidance and direction.
ruling with regard to the Affordability Regulations
signals an improved outlook for the credit environment         To my colleagues on the Operating Board, a massive thank
within South Africa, caution is required regarding future      you. Together we have achieved much success over the
regulatory developments in this sector.                        past years, and I have no doubt this will continue under
                                                               Anthony’s leadership.
In the United Kingdom, the uncertainty relating to the
outcome of Brexit negotiations remains and this, among         In addition, a heartfelt thank you to our executive and
other factors, continues to impact consumer and business       operating teams in TFG London, lead by Ben Barnett, and
confidence. Through the consolidation of the back office       in TFG Australia, lead by Gary Novis, who have played a
functions of the respective brands in the United Kingdom,      pivotal role in the ongoing diversification and success of
and the continued implementation of Phase Eight’s              our Group.
business model into Whistles and Hobbs, the Group will
continue to build the TFG London platform to enable            Lastly, to our customers, shareholders and stakeholders,
sustainable profitability.                                     thank you for your continued support of our Group. I trust
                                                               your loyalty will continue to be rewarded.
The Group’s TFG Australia platform will be strengthened
through the continued store roll-out of existing               Doug Murray
TFG Australia brands, as well as through the test launch       Chief Executive Officer
of a TFG Africa brand in October 2018.
                                                               29 June 2018
Our continued commitment to our strategic pillars of
Customer, Leadership, Profit and Growth together with
our diversification across cash and credit turnover, our
portfolio of brands, geographies and sales channels,
will support the Group’s future resilience and success.
In particular, our focus on existing strategic initiatives –
superior customer experiences, cost control, working
capital management and capital optimisation – will
continue in the year ahead. A key driver and focus for
the Group will be our ongoing investment in digital
transformation. This will ensure that we are able to
provide a complete retail experience for our customers
according to their preferred channel, while delivering
quality product.

                                                                                            TFG Integrated annual report 2018
                                                                                                                                55
                                                                                                        www.tfglimited.co.za
STRATEGY
     OVERVIEW

       CUSTOMER                                                                                       LEADERSHIP

      GROWTH                                                                                          PROFIT

     Our strategy is informed by our vision, mission and values, as defined in the strategic snapshot on the inside front
     cover. We remain committed to our strategic pillars of Customer, Leadership, Profit and Growth, which have remained
     unchanged since our 2015 financial year.

     Our 10-year key performance indicators are evidence of strategies that have been well-executed and adapted to ensure
     growth while creating shared value.

      Share
       price                                                                           Other
     (cents)                                                                           (cents)
     25 000           +9,5%*             +10,0%*                                       1 200
                                                                                                      80%

                          HEPS
                                           ANNUAL
                                         DISTRIBUTION
                                                                                                      70%
                                                                                                                                    +19,2%*                   +14,0%*
                                                                                       1 000          60%                           SHARE PRICE                JSE-GERE
     20 000
                                                                                                      50%
                                                                                       800            40%
     15 000
                                                                                                      30%
                                                                                       600
                                                                                                      20%
     10 000                                                                                           10%
                                                                                       400
                                                                                                       0%

       5 000                                                                                         -10%
                                                                                       200
                                                                                                     -20%

           0                                                                           0             -30%
               2009   2010    2011   2012   2013   2014   2015   2016    2017   2018                        2009   2010   2011   2012   2013   2014   2015    2016   2017   2018

                   HEPS (cents)            Annual distribution (cents)                                         Growth in TFG share price
                   Share price at year end (cents)                                                             Growth in JSE General Retailers Index (J537)

      Turnover/
     Employees                                                                             Outlets
                                                                                                     Each pillar has specific strategic objectives which were
         30 000                                                                            4 500     determined by the Operating Board and approved by the
                           +14,1*                                                                    Supervisory Board.
                           TURNOVER
          24 000                                                                           3 600

                                                                                                     A rolling, five-year strategic overview, which we refer to
          18 000                                                                           2 700     as our “5 Year Vision”, is updated annually. This Vision
                                                                                                     includes financial targets, where relevant, against the
          12 000                                                                           1 800     strategic objectives and is based on current market
                                                                                                     conditions, planned initiatives and expansion plans.
           6 000                                                                           900

                                                                                                     The strategic pillars together with its respective objectives
               0                                                                           0         apply to the Group as a whole. The international expansion
                   2009    2010   2011   2012   2013   2014   2015   2016   2017   2018
                                                                                                     strategy of the Group commenced in January 2015 and
                      Turnover (Rm)         Number of employees             Number of outlets
                                                                                                     the performance and strategic objectives of these business
                                                                                                     segments continue to be included within the Growth
                                                                                                     pillar. This includes TFG London and TFG Australia
      *     Numbers relate to a ten-year compound annual growth rate.                                (refer to page 64).

56
OUR STRATEGY AND PERFORMANCE REVIEW
                                                                                                                                      STRATEGY OVERVIEW / CONTINUED

HOW OUR SUSTAINABILITY STRATEGY SUPPORTS OUR BUSINESS STRATEGY
The links between our business strategy and sustainability strategy are highlighted in the diagram below. These linkages
continue to be developed as we progress the elements of our strategy.

 CUSTOMER                                                                                   LEADERSHIP

 •      We will build trust with our customers and other                                    •     Our training programmes will develop employee
        stakeholders by delivering measurable progress                                            potential, delivering a capable and competent
        on social and environmental challenges.                                                   pipeline of talent.
 •      We will promote transparency and accountability,                                    •     By empowering women and black South Africans,
        encouraging ethical practices across our                                                  we will enhance diversity, support transformation
        value chain.                                                                              efforts and reduce the risk of gaps in our strategy.

 GROWTH                                                                                     PROFIT

 •      We will support local communities to ensure our                                     •     We will develop and support local supplier,
        business has a greater chance of success in the                                           manufacturing and design capabilities to enhance
        long term.                                                                                quality, flexibility and speed of delivery.
 •      We will respond to societal challenges that impact                                  •     We will reduce waste and resource use by applying
        our operating environment by innovating to create                                         lean principles at TFG Manufacturing, mentoring
        shared value.                                                                             local suppliers and changing behaviour at head
                                                                                                  office and distribution centres.

The Group’s shared value sustainability strategy is underpinned by four pillars – Local Supply Chain Development,
Environment Efficiency, Accountability, Ethics and Governance and Drive Empowerment. The outcomes and initiatives for
each of these focus areas are indicated below:

                                                                        TFG SUSTAINABILITY
                                                                    FOCUS AREAS 2019 TO 2021

            LOCAL
                 L                                     E
                                                    ENVIRONMENT
                                                                                                      A
                                                                                                ACCOUNTABILITY,                                  DRIVE
         SUPPLY CHAIN                                EFFICIENCY                                   ETHICS AND                                 EMPOWERMENT
         DEVELOPMENT                                                                             GOVERNANCE
     Increase capacity, productivity               Increase efficiencies and                   Promote transparency,                       Empower our people and
      and competitiveness of local                       reduce costs                       accountability and compliance                support positive social change
       design and manufacturing

                                                                             OUTCOMES
 •   Local economic development through       •   Reduction of TFG’s carbon footprint   •   Ethical and effective leadership         •   Develop, grow and retain diverse talent
     increasing local fabric conversion and                                                                                              to ensure the continuous supply of a
                                              •   5% reduction of our electricity       •   Ensuring good governance
     supply                                                                                                                              capable and competent work force
                                                  consumption (kilowatts) per m2
                                                                                        •   Encouraging ethical business practice
 •   Increased employment opportunities           per annum                                                                          •   Maximise our societal impact
                                                                                            and building social trust
     for local communities                                                                                                               within the communities we operate
                                              •   A minimum recycling of 85% of all                                                      in (social development)
                                                                                        •   Effective stakeholder engagement
                                                  waste
                                                                                                                                     •   Achievement of B-BBEE targets
                                                                                        •   Increased levels of trust between TFG
                                              •   Minimum 80% of the cartons sent to
                                                                                            and key stakeholder groups               •   Access to opportunities through
                                                  stores are re-used supplier cartons
                                                                                                                                         skills development
                                              •   Reduction in waste to landfill

                                                                                  INITIATIVES
 •   Sourcing with integrity                  •   Carbon footprint reporting            •   Continuous enforcement and               •   TFG Retail Academy

 •   South Africa B-BBEE Enterprise                                                         refinement of policies, procedures and
                                              •   Energy efficiency initiatives                                                      •   Youth opportunities created
     Development and Supplier                                                               governance structures
     Development                              •   Water management                                                                   •   Educate2Empower
                                                                                        •   Embracing King IV™ principles
                                              •   Waste management

                                                                                                                                     TFG Integrated annual report 2018
                                                                                                                                                                                   57
                                                                                                                                                 www.tfglimited.co.za
CUSTOMER

     Objectives

     •   We will deliver superior customer experiences across our retail brands.
     •   We will grow our customer base through an appropriately targeted customer acquisition strategy.
     •   We will leverage data science to improve our customer experience and engagement across all our retail brands.

     Our customer context

     •   Through our 28 fashion-forward brands trading out of 4 034 outlets in 32 countries globally, we offer our customers
         clothing (men, ladies and kids), jewellery, cellphones, accessories, cosmetics, sporting and outdoor apparel, and
         homeware and furniture.
     •   20 of our brands are available to our customers online.
     •   Our loyalty programme for TFG Africa customers, TFG Rewards, has over 12,3 million cash and credit customers.
     •   TFG Rewards provides our customers with the ability to be rewarded, with only one card and customer profile, across
         20 TFG Africa retail brands – a rewards programme intended to suit every lifestyle and life stage.
     •   Our customer base spans markets from value to upper market.
     •   We have a cash to credit turnover ratio of 66:34.
     •   We offer credit to our customers in South Africa, Namibia, Botswana, Lesotho and Swaziland/Eswatini.
     •   We have a full in-house credit management capability for our TFG Africa customers supported by a 1 500 seat call centre.

     Review of the year

     •   During the year, the Group’s Voice of Customer (VoC) tool grew to include more brands and territories, with VoC
         surveys launched in Namibia and Zambia and eight additional brands added to the platform. All TFG Africa’s brands
         now use VoC to listen to their customers’ point of view on a daily basis.
     •   Following on from VoC, we have successfully implemented Voice of Employee (VoE) during the past year.
         Employee ideas are escalated to senior management meetings for implementation consideration. The need to
         cultivate customer obsession among employees is now recognised as a key to delivering a great customer experience.
         Read more on page 43.
     •   Customer obsession has been cultivated within the Group through workshops to ensure and enhance our customers’
         experience. “Delivering superior customer experience” is now embedded in the strategic objectives of all TFG Africa
         brands during the year.
     •   More than 800 store managers, area managers and sales assistants have gone through our TFG Retail Academy which
         focuses on delivering a good customer journey. Read more on page 43.
     •   Customer conversion measurements are being rolled out by the Group per area and brand. Foot traffic counters have
         been installed in over 400 stores to date.
     •   Customer acquisition was added during the year as a new objective within the Customer strategic pillar. This is to
         ensure there is a joined-up strategy across both the cash and credit rewards acquisition channels.
     •   As indicated last year, the Group focused on and invested in a Group Analytics division that uses data science to
         identify opportunities to improve customer experience and customer engagement levels. Given the early success of
         this division, we continue to invest in both people and technology in order to deliver against these accountabilities.
     •   The responsibilities of the Group Analytics division have recently been extended to include the TFG Rewards
         (previously Rewards & More) programme, using data science to further refine and enhance the rewards offering to
         stay relevant to our customers.
     •   The conversion of ordinary cash customers to the TFG Rewards programme has resulted in a higher percentage of
         Group turnover being tracked at a customer level, which enhances our customer knowledge level and the relevance
         of our engagement strategies.

     How we measure customer success

                                                                    MEDIUM-TERM           MARCH          MARCH          MARCH
     Customer                                                            TARGET             2018           2017           2016

     TFG Rewards customers (million)                                           16,5          12,3            10,3            8,3
     Rewards voucher take-up (%)                                                9,6            8,2            9,3            9,6

58
OUR STRATEGY AND PERFORMANCE REVIEW
                                                                                              STRATEGY OVERVIEW / CONTINUED

FOCUS AREAS INDICATED IN PRIOR YEAR REPORT

•   Continued enhancement of our customer experiences and relationships through service and offering improvements
    based on feedback from the VoC process.
•   Equal focus on the acquisition, conversion, growth and retention of our customers through targeted customer
    experience initiatives.
•   Training and upskilling interventions for all our customer-facing employees through the TFG Retail Academy.
•   Rolling out Rewards & More (now TFG Rewards) enhancements that will further improve personalisation and the
    digital experience, optimise processes, enhance in-store visibility, upgrade our reporting capability and drive
    increased cross-shopping opportunities (cross-shopping is defined as the average number of brands that a customer
    shops into over a 12-month period).

Risks and opportunities

•   Customer feedback and the use of group analytics provide customer insights that enable the retail trading divisions
    to continually improve their merchandise strategies and rewards offerings, ensuring that the Group remains
    competitive and relevant as a lifestyle retailer.
•   Consumers remain under pressure due to local and global economic challenges, which impact their purchasing power
    and ability to settle or open accounts.
•   In South Africa, new credit legislation regarding Debt Intervention is currently being debated in Parliament – difficult
    to assess the impact until the final Bill is published.
•   Customer experience skills development through the TFG Retail Academy will ensure that employees are competent
    to implement our strategic objectives.
•   The use of foot traffic counters within stores will provide the ability to more efficiently optimise staffing levels,
    ultimately enhancing customer service and the customer’s experience.
•   Through our Growth strategic pillar, we continue optimising our supply chain management process, as this is critical
    to provide our customers with their desired merchandise at the right price and time.
•   Business demand for data science initiatives is growing at a fast rate, and it is a challenge to keep up with the
    demand in terms of the ability to recruit and train new people as well as implement the new technologies required.
•   The constant growth in digital disruption and customer’s desire for instant gratification requires innovative and agile
    ways in delivering relevant benefits to customers through the rewards programme, while continuously improving the
    programme, especially as the younger customer base expands.

FUTURE FOCUS AREAS

•   We will continue to look for ways to improve and enhance our customer experience and, in particular, the ease and
    convenience of the new account application process for new credit customers.
•   New marketing channels for credit will be tried and tested during the course of the financial year in order to ensure
    that we remain relevant for both potential and existing customers. These campaigns will focus on the fact that
    customers can access 20 TFG Africa brands with just one card, underpinned by a rewards programme, and while
    accessing affordable credit.
•   We will continue to enhance our rewards programme to deliver increased customer and business value while focusing
    on the acquisition, conversion, growth and retention of our customers. We will further improve personalisation and
    the digital experience and processes to enhance in-store visibility and engagement level.
•   We will continue to broaden the coverage of VoC to listen to our customers at as many points as possible, while we
    continue to educate and focus on customer experience across the Group.
•   We will continue to focus on a “single view of customer” which enables the integration and utilisation of all customer-
    related data. This information can be used to improve both customer experience and engagement.
•   Delivering customer insight initiatives to the retail trading divisions will remain a key focus of the Group Analytics
    team for the forthcoming year. The analytical insights provided are used to further improve business strategies as well
    as ultimately enhance the customer experience.

                                                                                             TFG Integrated annual report 2018
                                                                                                                                 59
                                                                                                         www.tfglimited.co.za
LEADERSHIP

     Objectives

     We will embed a performance-based culture that ensures we attract, retain and develop the best talent in the industry.

     Our leadership context

     •   We are committed to our values of PRIDE2 (see inside front cover).
     •   We have an experienced executive management team (average of 22 years’ service).
     •   Our unique, growing multi-brand Group structure creates career opportunities for key talent and ensures optimised
         succession planning.
     •   We nurture ongoing structured talent development and a strong performance management culture.
     •   We believe that the youth are the future leaders and it is our collective responsibility to train and develop them into
         leaders who will positively impact our future.
     •   Our CSI mission is to “Educate to Empower (E2E)” across educational levels – from early childhood development to
         post-school education. Our skills strategy is to “Educate to Employ“ and supports our CSI mission.

     Review of the year

     •   Leaders within the Group continued to focus on lean thinking and efficiency mindsets during the year by encouraging
         smarter working through efficient structures and by tracking employees’ productivity measures.
     •   As the Group continues to expand, additional demands are placed on leadership teams to ensure that all
         opportunities are properly researched, all risks are assessed and all acquisitions are well integrated.
     •   A number of executives attended international development programmes and/or local business schools with
         international footprints as part of our ongoing leadership talent development, while the focus on ongoing talent
         development across the business at all levels continued.
     •   The succession for the Chief Executive Officer was finalised in March 2018 with the appointment of
         Anthony Thunström, the current Chief Financial Officer, as CEO Designate. We are delighted that an appointment
         of this importance and stature has come from within the Group, given our focus on executive development and
         succession planning. The process of appointing a new Chief Financial Officer is well advanced.
     •   We continue to retain key talent through appropriate recognition and reward initiatives and our unique Group culture.
     •   A key focus during the year has been on the reduction in “time to hire” of customer-facing employees, while the
         development of these employees is prioritised through enhanced training programmes and performance-based
         incentives.
     •   We continue to embed a performance culture to ensure that individual performance criteria are measured and
         applied as moderator in the Group annual bonus scheme incentive. Read more in the Remuneration Committee report
         on page 112.
     •   The launch of our Voice of Employee (VoE) platform gave our people the opportunity to submit ideas for business
         improvement as well as tell our leaders what they think about working at TFG.

     FOCUS AREAS INDICATED IN PRIOR YEAR REPORT

     •   Our leadership capacity to ensure that any new acquisition is well integrated.
     •   Continued development of our customer-facing employees through the TFG Retail Academy and our merchants
         through the TFG Merchant Academy.
     •   Continued leadership capacity building.
     •   Continued focus on transformation and diversity.
     •   Implementing “Voice of Employee”.

60
OUR STRATEGY AND PERFORMANCE REVIEW
STRATEGY OVERVIEW / CONTINUED
How we measure leadership success
MEDIUM-TERM MARCH MARCH MARCH
TARGET 2018 2017 2016
Number of training interventions during the year 130 000 – 150 000 132 166 126 806 116 043
Staff turnover – total % 30,0 35,1 37,8 37,1
Staff turnover – permanent TFG Africa head office
employees (%) 10,0 – 15,0 4,7 8,6 9,0
Employee equity (% representation of previously
disadvantaged groups among permanent
employees) – South Africa only >90,0 93,9 93,2 92,3
Risks and opportunities
• The theme OPPORTUNITY identifies our unique TFG Employee Value Proposition (EVP). It relates to the
opportunities created for employees across the Group, allowing them to grow and succeed in any of our retail brands
or in our service divisions in an environment of support, collaboration and respect. Our unique Group structure and
international footprint facilitates career options and enables succession planning, in turn mitigating recruitment
and retention risk.
• The evolving complexity of the Group requires leaders to lead increasingly bigger teams, and to lead across
functional and geographic boundaries.
• Retail is a large employer both in Africa and in our International business. We promote retail careers throughout the
Group through brand profiling, social media, career fairs and talent search strategies, targeting both customer-facing
and head office employees.
• As high unemployment in Africa continues to be challenging, we work within communities to offer learnerships for
work experience and skills building.
• Labour laws in the African markets in which we operate continue to place pressure on employee costs.
• We value diversity and develop talent in a proactive way, which includes a continued focus on promoting attendance
at our retail academies.
FUTURE FOCUS AREAS
• We will continue to increase our leadership capacity to ensure that any new acquisition is well integrated.
• Continued development of our customer-facing employees and merchants, facilitated by the TFG Retail Academy.
• Development of our manufacturing capability with a specific focus on our factory employees.
• A continuation of our focus on transformation and diversity.
• Linking Voice of Employee data to our Voice of Customer data for retail brands and wider communication of
“Ideation” (submission of ideas and feedback).
TFG Integrated annual report 2018
61
www.tfglimited.co.zaPROFIT
Objectives
• Our brands will optimise their supply chain capability, including their suppliers, buying processes and quick response
capability.
• We will optimise the flow of goods from source to customer to enhance the customer experience.
• We will enhance Return on Capital Employed (ROCE) by optimising profitability and capital management.
Our profit context
• We have market-leading in-house capabilities for store design and upgrades, apparel design and manufacturing.
• Our well-developed fabric and pattern optimisation systems support quick response capabilities to repeat “winners”
in-season and implement quick interpretation of in-demand trends and fashion.
• The Group has a natural currency hedge through TFG London and TFG Australia’s growing contribution.
• We protect our income streams through the diversification of our footprint across numerous economies.
• We continuously seek to optimise cost-efficiencies.
• We have a compound growth rate of 7,8% in headline earnings per share from continuing operations over five years.
Review of the year
• System changes were implemented during the year to enhance cross-docking. This enabled the Group to pre-pack 4%
of total product received in our South African distribution centres during the year.
• A project has commenced to increase product visibility across the product life – current deliverables are tracking
according to plan with implementation planned in a modular, phased approach.
• ROCE and ROCE levers were introduced as KPI measures and significant effort was put into working with each
division on their respective targets, which are now being tracked monthly. This, along with other initiatives such as
workshops and communication drives, as well as management leading by example, ensured that ROCE has been
entrenched as a way of thinking in the Group. A responsible approach was, however, taken with the introduction of
ROCE to avoid unintended consequences that could impact our customers’ experience.
• Group procurement opportunities realised during the year resulted in savings of 38% over the prior year.
• Significant progress has been made on enhanced margin management, expense optimisation, working capital
management and Group procurement initiatives during the year, but the focus on these elements will continue.
• There was a greater adoption of quick response initiatives across our retail trading divisions during the year, aided
by the strong performance of quick response products within our stores. TFG Design Centre and TFG Manufacturing
have continued to expand on their ability to deliver this product, while the ability of our Maitland and Caledon
factories to manufacture and deliver quick response products continues to grow.
• Our quick response clearances and margins are above expectation and well above non-quick response product.
• Our focus on sourcing initiatives continued with a number of new key suppliers introduced across the Group, while
we continued to expand our share of direct sourcing.
FOCUS AREAS INDICATED IN PRIOR YEAR REPORT
• Enhanced gross margins through sourcing initiatives, supplier relationships and optimisation of markdown.
• Increased focus on clearances and the prevention of stock ageing.
• TFG Design, TFG Manufacturing and TFG Merchandise Procurement initiatives to continue.
• Continued focus on expense optimisation and the elimination of waste.
• Improved focus on working capital management and the enhancement of the current capital allocation model.
62OUR STRATEGY AND PERFORMANCE REVIEW
STRATEGY OVERVIEW / CONTINUED
How we measure profit success
MEDIUM-TERM MARCH MARCH MARCH
Profit TARGET 2018 2017 2016
Number of quick response units (million) 4,0 – 5,0 3,6 2,4 1,9
Gross margin (%) 50,0 – 51,0 52,5 49,7 49,7
ROCE – TFG Africa (%) 23,0 – 25,0 24,6 25,3 26,8
Pre-pack units as % of product received 4,0% 3,2% 2,9%
Free cash flow – R million 1 880,6 1 298,8 644,1
Free cash flow – % of net profit 77,2% 55,2% 29,9%
Risks and opportunities
• An inability to expand quick response due to the reliance on a single supplier (our own factories) and the lack of
access to local raw material suppliers and finishes.
• Visibility of accurate stock information will assist in replenishment processes and improve stock availability in store at
a size level, resulting in an improved customer experience, additional turnover and stock control.
• Direct sourcing will improve our margins and access to appropriate product and ensure we are able to manage
compliance and sustainability matters.
FUTURE FOCUS AREAS
• Continued focus on expense optimisation, elimination of waste, enhanced capital allocation and working capital
management.
• We will focus on improved stock accuracy and improve the customers’ experience through the introduction of radio
frequency identification tags (RFID) tags. This is a complex multi-year project.
TFG Integrated annual report 2018
63
www.tfglimited.co.zaGROWTH
Objectives
• We will be the leading lifestyle retailer in Africa whilst growing our international footprint.
• We will deliver a customer-focused, digital omnichannel ecosystem.
Our growth context
• We achieved a five-year compound turnover growth rate of 17,3% and a five-year compound growth in distributions
to shareholders of 8,0%.
• TFG Africa achieved a compound space growth of 5,4% over five years.
• Our TFG Africa e-commerce site offers our customers a mall-like experience with our site’s unique cross-shopping
functionality.
• A further four brands launched their online selling during the year, bringing the Group’s total number of brands
available online to 20.
• Our continued strategic international expansion creates value for our shareholders through geographic diversification,
the leveraging of our existing retail experience and additional revenue and profit.
Review of the year
• The Group continued its expansion into Kenya and is now trading with four stores in two centres.
• Botswana, Lesotho and Swaziland/Eswatini traded to expectations and continue to perform well. Namibia, Zambia
and Ghana were, however, under pressure and performance was muted in line with their underlying economic growth.
• A relatively small number of new stores (2018: 14; 2017: 9) were opened in African countries other than South Africa
during the year, as we took a more measured approach when reviewing new locations.
• The Group successfully concluded the following international acquisitions during the year:
–– RAG, a leading speciality menswear apparel retailer in Australia, effective 24 July 2017; and
–– Hobbs, a contemporary British womenswear brand, effective 25 November 2017.
These acquisitions have already resulted in a positive contribution to bottom line Group earnings for the year.
• With the Group’s additional expansion and acquisition activities this year, TFG is now represented in 32 countries
on five continents.
• Exact, @homelivingspace, SODA Bloc and Foschini launched their online selling during the year, bringing the total
number of brands online to 20.
• The following innovation was implemented to enhance our customers’ digital experience:
–– E-Receipts, E-Gift Card and digital payment solutions (both in-store and online).
–– A product fit guide for online sales.
–– The continued roll-out of WiFi to stores.
• Online transactions across the United Kingdom continue to grow as customers prefer this retail channel ahead of
brick and mortar. TFG London’s online turnover now represents 33% of their total turnover.
FOCUS AREAS INDICATED IN PRIOR YEAR REPORT
• Creating growth momentum through the international roll-out of Phase Eight, concession store roll-out for Whistles
and Damsel in a Dress and e-commerce options across all United Kingdom brands.
• Continue driving strategic cost savings identified for Whistles and the implementation of its clearly defined
turnaround strategy.
• Further roll-out of our brands in the TFG eMall.
• Continued focus on enhancing our customers’ experience in our TFG eMall, ensuring that it is as convenient and easy
as possible, while providing the luxury of choice.
• Integration of the Retail Apparel Group (RAG).
64OUR STRATEGY AND PERFORMANCE REVIEW
STRATEGY OVERVIEW / CONTINUED
How we measure growth success
MEDIUM-TERM MARCH MARCH MARCH
Growth TARGET 2018 2017 2016
Retail turnover (Rbn) 43,0 28,6 23,5 21,1
E-commerce turnover (Rbn) 2,6 1,8 1,3 0,7
Cash turnover contribution (%) 70,0 65,9 60,7 57,2
Number of outlets 4 761 4 034 3 328 3 125
Space growth TFG Africa (%) 5,0 3,5 4,4 6,6
TFG Africa turnover contribution to
total Group turnover (%) 70,3 80,3 82,9
Risks and opportunities
• The volume of jurisdictions in which the Group is present and the more onerous requirements of the various
regulations increases the complexity of the Group’s regulatory environment.
• Further opportunity for cost optimisation and margin improvement through the centralisation of shared support
services within TFG London.
• The Group is well positioned to benefit from further acquisitions, should the opportunity exist. We will, however,
continue to apply our stringent acquisition criteria of a proven, profitable track record, a strong management team
with a commitment to staying on to continue to grow the business, good future growth prospects and a strong
position in a niche product category.
• Further expansion opportunities across sales channels and territories are explored within TFG Australia and
TFG London.
• Under-performing department stores may impact some of the Group’s concession outlets.
FUTURE FOCUS AREAS
• Further expansion opportunities in Botswana and Kenya are being explored in addition to exploring the launch of
online selling in Namibia.
• The launch of the Group’s commercialised e-commerce market place in TFG Africa, called myTFG.Shop, as well as the
launch of a new mobile application for TFG Africa.
• While progress has been made on the centralisation of shared support services within TFG London during the year,
focus on this will continue in order to optimise cost efficiencies and share expertise across the different brands within
TFG London.
• Continued optimisation and enhancement of online channels within TFG London in order to provide customers with
their desired merchandise at the right price and time via their preferred channel.
• The Group continues to monitor developments around Brexit to ensure detailed consideration of the implications in
order to progress responses as clarity emerges.
• Store optimisation and new store expansion across the TFG Australia brands.
• Launch of a TFG Africa brand within Australia.
TFG Integrated annual report 2018
65
www.tfglimited.co.zaCHIEF FINANCIAL
OFFICER’S REPORT
ANTHONY THUNSTRÖM
The Group achieved growth in retail turnover of Notwithstanding the rigorous control exercised over like-
21,4%, together with growth in headline earnings of for-like expense growth and capex, the Group continued
9,6% for the year, despite generally depressed consumer to invest in both new and upgraded stores as well as in
confidence and challenging economic conditions strategic IT and data analytics projects to position the
both locally and internationally. This earnings growth, Group for future growth.
together with an ongoing focus on capital optimisation,
resulted in a 44,8% growth in free cash flow, on the back These results were underpinned by the following
of a 100% growth in the previous year’s free cash flow. key elements:
INCOME STATEMENT
POSITIVE
SOLID GROSS LIKE-FOR-LIKE
PERFORMANCE
TURNOVER MARGIN EXPENSE
FROM
GROWTH EXPANSION CONTROL
ACQUISITIONS
66OUR STRATEGY AND PERFORMANCE REVIEW
CHIEF FINANCIAL OFFICER’S REPORT / CONTINUED
OUR PERFORMANCE DURING THE YEAR
GROUP GROUP GROUP
MARCH MARCH %
2018 2017 CHANGE
Retail turnover (Rm) 28 593,0 23 548,7 21,4
Gross margin (%) 52,5 49,7
Operating margin (%) 14,6 16,2
Headline earnings growth (excluding acquisition costs) (%) 9,6 6,8
HEPS (excluding acquisition costs) (cents) 1 136,5 1 099,2 3,4
Total dividend per share (cents) 745,0 720,0 3,5
Free cash flow (Rm) 1 880,6 1 298,8 44,8
Total debt to equity (%) 61,4 65,3
The Group achieved solid turnover growth for the year with performance across all territories ahead
of respective peer group turnover growth. TFG London achieved turnover growth of 23,5% (GBP),
Solid including Hobbs, and turnover growth of 4,2% (GBP), excluding Hobbs. TFG Africa achieved turnover
turnover growth of 6,3% (ZAR) with comparable store turnover growth of 2,2%. The balance of the growth in
growth turnover was achieved through TFG Australia.
Group cash turnover growth of 31,9% was achieved for the year with growth of 7,3% (ZAR) in
TFG Africa. This growth achieved in TFG Africa is pleasing, considering the high base in the prior
year of 14,1% turnover growth. The balance of Group cash turnover growth was achieved through
TFG London, driven mostly by online channels, and TFG Australia.
Group credit turnover growth at 5,3% was driven in part by the growth in the active account base.
This growth was in line with expectation as the negative impact of the Affordability Regulations is
now in the base.
Key facts on turnover:
GROUP
Segmental contribution
TFG Africa 70,3%
(March 2017: 80,3%)
TFG London 18,7%
(March 2017: 19,7%)
TFG Australia 11,0%
(March 2017: 0%)
Note:
1. The segmental contribution to turnover above includes each segment’s e-commerce turnover.
TFG Integrated annual report 2018
67
www.tfglimited.co.zaKey facts on turnover (continued):
Solid GROUP TFG AFRICA TFG LONDON
turnover
growth
(continued)
Cash turnover growth +31,9% +7,3% +23,5%
(March 2017: +18,5%) (March 2017: +14,1%) (March 2017: +45,0%)
Credit turnover growth +5,3% +5,3%
(March 2017: +2,3%) (March 2017: +2,3%)
Cash vs credit turnover
contribution
Cash turnover 65,9% Cash turnover 51,5% Cash turnover 100,0%
(March 2017: 60,7%) (March 2017: 51,1%) (March 2017: 100,0%)
Credit turnover 34,1% Credit turnover 48,5% Credit turnover 0,0%
(March 2017: 39,3%) (March 2017: 48,9%) (March 2017: 0,0%)
Notes:
1. TFG London and TFG Australia have cash turnover only.
2. Financial year ended March 2018 is TFG Australia’s first year of inclusion in the Group, therefore turnover growth
is not applicable for this business segment in the Group context.
3. TFG London’s turnover growth for the financial year ended March 2018 includes non-comparable Hobbs’
turnover (acquired November 2017).
4. TFG London’s turnover growth for the financial year ended March 2017 includes non-comparable Whistles’
turnover (acquired March 2016).
Gross margin for the Group improved to 52,5% at March 2018, up from 49,7% in the previous year.
This improvement was driven in part by the gross margin expansion in TFG Africa to 47,8% from
Gross 46,4% in the previous year. It is pleasing to report that this expansion was achieved across all
margin merchandise categories, with the exception of cosmetics, during a period characterised by unusually
expansion high levels of discounting in the market. The strong performance of our clothing category within
Africa is particularly gratifying. Product price deflation for the year in TFG Africa averaged 3,5%
across all merchandise categories, with price deflation of 3,8% in clothing.
This improvement was achieved in part due to the continued expansion of our quick response
manufacturing through our Caledon and Maitland factories. Quick response product generally
results in lower markdown, as was evident in our apparel divisions this year.
Further information on the progress made with quick response manufacturing as a strategic
initiative, is provided in the strategy overview on page 62.
TFG London’s gross margin at 61,9% was slightly down on last year. This movement was as a
result of the difficult trading conditions experienced in the United Kingdom during the year, as well
as the shift in consumer spend from offline to online sales, which traditionally results in a lower gross
margin due to additional promotion and logistics costs.
TFG Australia’s gross margin was 65,5%.
While expense control is always of great importance to the Group, it is even more critical during
periods when turnover levels are muted as a consequence of tough economic conditions. The Group
Like-for-like contained total like-for-like expense growth in TFG Africa to 5,1% with like-for-like store expense
expense growth in TFG Africa at only 4,2%.
control
Occupancy costs, a significant component of our overall operating costs, has been a key focus
area within TFG Africa, and it is gratifying to report that normal lease escalations now average 5,8%,
down from a 7,2% average escalation in the previous year. The rent reversion average was -2,5% for
the year, compared to +4% in the previous year.
68OUR STRATEGY AND PERFORMANCE REVIEW
CHIEF FINANCIAL OFFICER’S REPORT / CONTINUED
The Group concluded two further substantial acquisitions during the year, being RAG and Hobbs
(refer to note 11 on page 147 of the summary consolidated financial statements for further details).
Positive
It is pleasing to report that both RAG and Hobbs were earnings accretive for their first year, a
performance
from positive development considering that neither were included for the full year.
acquisitions
The Group’s international segments, TFG London and TFG Australia, now contribute 17% to
Group EBITDA and there are further opportunities to increase this contribution in the future.
In December 2017, the Group accelerated the put/call arrangement to acquire the remaining
c.15% shareholding owned by management in TFG Brands (London) Limited. The transaction
was effective 15 December 2017.
Further information on the performance of the Group’s three business segments, TFG Africa,
TFG London and TFG Australia, is provided in the segmental performance review on page 72.
STATEMENT OF FINANCIAL POSITION
WORKING ENHANCED
REDUCED
CAPITAL FREE CASH
GEARING
MANAGEMENT FLOW
The past financial year saw a number of corporate activities with the buyout of TFG London’s
minorities, two further acquisitions and a capital raise. Given these activities, it is pleasing that the
Group ended the year with reduced gearing levels with total debt to equity ratio at 61,4%, down from
Reduced
gearing 65,3% at March 2017.
The R2,5 billion capital raise, by way of a successful accelerated bookbuild launched on 31 July 2017,
resulted in the issue of 17 241 380 ordinary shares at R145 per share. This was a premium of 0,9% to
the 30-day VWAP of R143,68 as at the close of trade on 31 July 2017.
The Group’s focus on working capital management continued this year with pleasing results.
Working TFG Africa’s trade receivables were up 8,2% at the end of March supported by credit turnover growth
capital of 5,3%, and growth in net bad debt of -6,5%. Active accounts increased by 1,1%.
management
Group inventory was up 22,9% with TFG Africa inventory only increasing by 3,3%, well below turnover
growth.
The growth in other receivables and trade and other payables of 10,0% and 31,1% (Group) and 3,7%
and 9,2% (TFG Africa) respectively related mostly to the timing of payments.
TFG Integrated annual report 2018
69
www.tfglimited.co.zaFree cash flow has been a key strategic focus in recent years, with positive results for the Group.
Following a 100% increase in free cash flow in the previous year, there was an additional increase
Enhanced of 44,8% this year, to R1,9 billion. This converts to 77,2% of the Group’s net profit for the year, a
free cash significant improvement on the Group’s conversion average of approximately 40% over the previous
flow ten years.
The Group’s increased focus on capital optimisation, including the focused capital allocation to
outlets, supported this improvement in free cash flow. In total, 281 outlets were opened during the
year (TFG Africa: 146, TFG London: 91, TFG Australia: 44) while an increased number of 177 outlets
(TFG Africa: 83, TFG London: 83, TFG Australia: 11) were closed during the year as a result of
the specific focus placed on underperforming outlets as part of this capital allocation model.
Within TFG Africa in particular, capital expenditure on outlets decreased from R438,9 million in the
2017 financial year to R389,7 million this year. This is in part due to the decrease in number of stores
opened (146 versus 206 in the prior year) as well as the tight control exercised over build rates,
which were held flat for the year.
TFG London’s capex decreased despite the non-comparable inclusion of Hobbs. Due to the shift
in consumer spend from offline to online channels experienced in the United Kingdom, fewer new
outlets were opened during the year.
While capital expenditure has been tightly controlled, the Group continued to invest in IT and
technology solutions, with a strong focus on return on investment. This IT investment will increase
over the short term as the Group strategically invests in digital transformation to position the Group
for future growth and success.
70OUR STRATEGY AND PERFORMANCE REVIEW
CHIEF FINANCIAL OFFICER’S REPORT / CONTINUED
VALUE CREATED DURING THE YEAR
The performance of the Group during the year resulted in a growth in headline earnings of 9,6% to R2,5 billion and
a growth in headline earnings per share of 3,4% to 1 136,5 cents per share. In line with this growth in earnings, our
shareholders were rewarded with a total dividend declared for the year of 745,0 cents per share, an increase of 3,5%. The
dividend comprised of an interim dividend of 325,0 cents per share (a 1,6% increase) and a final dividend of 420,0 cents
per share (a 5,0% increase).
The strong performance of the Group in the past year, in difficult trading environments, comes on the back of several
years of solid performance and is a result of the success already achieved through TFG’s diversification strategies:
Rm Cents
30 000 1 200
28 593,0
1 099,2
1 055,8 1 136,5
9,5%* 14,1%* 10,0%*
23 548,7 1 000
HEPS^ TURNOVER ANNUAL
24 000 DISTRIBUTION 897,9
21 107,5
818,7
780,6
800
16 085,9
18 000 745,0
653,9 720,0
691,0
14 159,0
600
537,3
12 896,4 588,0
488,8
458,2 11 630,5 536,0
12 000 440,7
506,0
9 936,5
455,0 400
8 605,2
7 668,7 8 089,6
350,0
288,0 288,0 288,0
6 000
200
0 0
2008 2009 2010 2011 2012 2013 2014 2015 2016 2017 2018
HEPS excluding Turnover (Rm) Annual distribution
acquisition costs (cents)
(cents)
* Numbers relate to a 10-year compound annual growth rate.
^ Headline earnings per share excluding acquisition costs.
FOCUS AREAS FOR 2019
While significant progress has been made in respect of key financial drivers including cost optimisation, procurement,
working capital management, capital allocation and cash flow generation, there are clearly identified opportunities for
further improvement in a number of these areas.
The Group will, over the next few years, be investing significantly in our digital transformation strategy, to ensure that the
Group is well positioned to offer our customers new interactions and retail experiences and remain relevant in a rapidly
evolving sector. Over and above the allocation of senior executive and management effort, this will result in a shift of
capex allocation, in order to accelerate the implementation of these digital strategies.
Anthony Thunström
Chief Financial Officer
29 June 2018
TFG Integrated annual report 2018
71
www.tfglimited.co.zaYou can also read