Diminished growth and vitality in juvenile Hydractinia echinata under anticipated future temperature and variable nutrient conditions
←
→
Page content transcription
If your browser does not render page correctly, please read the page content below
www.nature.com/scientificreports
OPEN Diminished growth and vitality
in juvenile Hydractinia echinata
under anticipated future
temperature and variable nutrient
conditions
1* 1,3,4 1
Daniel Tschink , Gabriele Gerlach , Michael Winklhofer , Cora Kohlmeier2,
2,3 1,2 1,2
Bernd Blasius , Laura Eickelmann , Yvonne Schadewell & Julia Strahl 1,3,5
In a warming climate, rising seawater temperatures and declining primary and secondary production
will drastically affect growth and fitness of marine invertebrates in the northern Atlantic Ocean.
To study the ecological performance of juvenile hydroids Hydractinia echinata we exposed them
to current and predicted water temperatures which reflect the conditions in the inter- and subtidal
in combination with changing food availability (high and low) in laboratory experiments. Here we
show, that the interplay between temperature stress and diminished nutrition affected growth and
vitality of juvenile hydroids more than either factor alone, while high food availability mitigated
their stress responses. Our numerical growth model indicated that the growth of juvenile hydroids at
temperatures beyond their optimum is a saturation function of energy availability. We demonstrated
that the combined effects of environmental stressors should be taken into consideration when
evaluating consequences of climate change. Interactive effects of ocean warming, decreasing resource
availability and increasing organismal energy demand may have major impacts on biodiversity and
ecosystem function.
Worldwide, marine ecosystems are threatened by the impacts of climate change1, and there is intense debate
as to whether acclimation or adaption in marine organisms will keep pace with the rate of ecosystem changes
predicted for the f uture2. Rising sea surface temperature (SST) and shifts in biogeochemical cycles of the world´s
oceans, and therewith in food availability, affects the ecological performance and fitness of marine biota3. There
is good evidence that ocean warming can drive species’ turnover4 and species-specific changes in phenology and
trophic mismatches5, leading to community and ecosystem shifts.
Global SST already increased by 0.11 °C per decade between 1970 and 20106, and are predicted to further
increase by 1.5–2 °C by 21007. Due to topographic conditions (e.g. shallow depths, high tidal ranges, large scale
intertidal zones) SST in shelf seas such as the North Sea are expected to increase by 3°C8. Increasing frequencies
of extreme weather events, such as storms9, and more intense and longer-lasting heat waves10 might intensify
temperature stress, especially in exposed habitats such as the i ntertidal11.
Within the next few decades, ocean warming is predicted to cause a decrease in primary and secondary pro-
duction in the northern Atlantic Ocean12. This, in combination with changing global climate patterns, such as the
North Atlantic Oscillation13, and in local ocean dynamics (e.g. wave action, storm events)14,15, might limit food
availability, feeding time, and prey-capture success of marine benthic invertebrates in the f uture16. In addition,
rising SST may shift the seasonal occurrence and abundance of primary and secondary producers, which may
induce trophic mismatches and reduce the ecological performance of higher trophic o rganisms17.
1
Institute of Biology and Environmental Sciences, Carl Von Ossietzky University Oldenburg, Carl von Ossietzky
Str. 9‑11, 26111 Oldenburg, Germany. 2Institute for Chemistry and Biology of the Marine Environment (ICBM),
Carl Von Ossietzky University Oldenburg, Carl von Ossietzky Str. 9‑11, 26111 Oldenburg, Germany. 3Helmholtz
Institute for Functional Marine Biodiversity at the University of Oldenburg (HIFMB), Ammerländer Heerstr. 231,
26129 Oldenburg, Germany. 4Centre of Excellence for Coral Reef Studies and School of Marine and Tropical Biology,
James Cook University, Townsville, QLD 4811, Australia. 5Alfred Wegener Institute Helmholtz Centre for Polar and
Marine Research, Am Handelshafen 12, 27570 Bremerhaven, Germany. *email: Daniel.Tschink@uol.de
Scientific Reports | (2021) 11:7483 | https://doi.org/10.1038/s41598-021-86918-4 1
Vol.:(0123456789)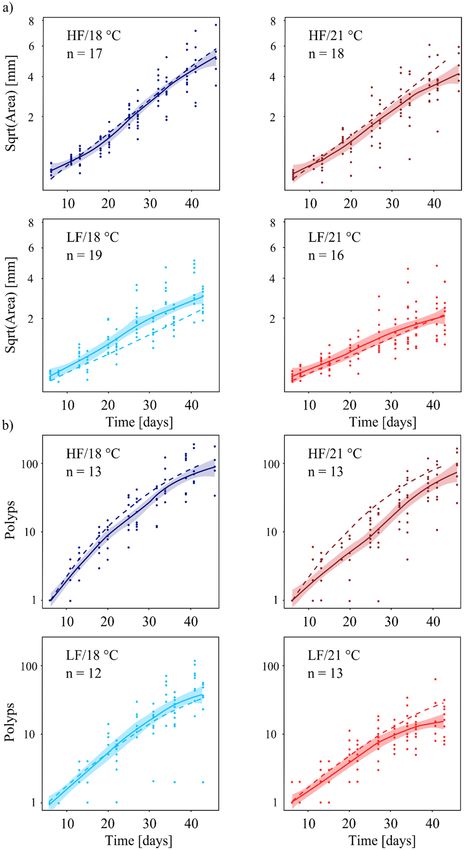
www.nature.com/scientificreports/
While the effects of changing water temperatures on benthic and pelagic ectotherms have been investigated
in recent decades (e.g.18–20), temperature-nutrient interactions in temperate marine ectotherms have received
little attention. Their ecological consequences are difficult to assess, due to the complexity of the organism—envi-
ronment interactions and of the interacting physiological and ecological processes underlying stress resistance,
resilience and acclimation/adaptation of marine organisms to predicted environmental c hanges21. It is therefore
essential to understand how potential environmental stresses (e.g. SST beyond the optimal range) may affect
their vitality22. Ectotherms, for instance, are less tolerant to warming than to cooling23, and there is substantial
evidence that rising temperatures affect physiological fitness, increase costs for somatic maintenance, and alter
growth and the competitive p otential22–24. Especially in the intertidal, temperature fluctuations caused by tides
may increase temperature stress in the future and potentially intensify the effects of temperature-nutrient inter-
actions on marine organisms.
The marine hydroid Hydractinia echinata (Flemming, 1828) is a suitable model organism, as it is widely dis-
tributed in the Northern Atlantic Ocean25 and characterized by high morphological plasticity26. Its distribution
pattern indicates a high tolerance to a broad range of environmental conditions (e.g., different temperature and
salinity ranges). Thus the hydroids can be found in the intertidal in < 1 m water depth, as well as in the subtidal
and even beyond > 50 m depth at different locations in the North Atlantic Ocean27. Juvenile colonies consist
exclusively of feeding polyps (Gastrozooids) interconnected by a stolon system26, which take up and decompose
food. The resulting energy resources are distributed through the stolon system and serve the somatic maintenance
and growth of the young animals.
To test whether the high morphological plasticity and high tolerances of H. echinata to variable environmental
conditions are corresponding to a high acclimation potential of juvenile hydroids to predicted environmental
conditions in the North Sea, we ran two controlled aquarium experiments. In the first experiment (scenario 1),
treatments correlated to temperature conditions in subtidal habitats of the German Bight in summer, while the
second experiment (scenario 2) simulated temperature fluctuations in intertidal habitats. In both experiments,
two temperature regimes (ambient and high) were cross-factored with two food regimes (high and low) to
study the growth performance (polyp number, colony area) and mortality rates of young animals under eight
different experimental conditions. We then developed a numerical growth model based on the assumptions of
a temperature-dependent metabolism and the amount of available energy to identify general stress-response
mechanisms, to compare experimental with model data. Our research investigated three main topics: (1) The
influence of rising summer SST and varying food conditions on morphology and mortality rates of juvenile
H. echinata; (2) The effect of fluctuating temperature stresses, such as those found in the intertidal, on growth
performance; and (3) The identification of possible stress-response mechanisms in juvenile hydroids in different
habitats by comparing experimental data with model simulations.
Results
Growth rates and mortality. In both scenarios (scenario 1 = subtidal; scenario 2 = intertidal), growth
rates of juvenile H. echinata were affected by food and temperature. Typically, colony area and polyp number
were lower at the higher temperature (21 °C) combined with insufficient food availability (low food, LF) (Figs. 1,
2; Supplementary Tables 2 and 3). Interestingly, growth performance was generally more affected by food limita-
tion than by temperature stress.
In scenario 1, the juvenile growth rates were highest at HF/18 °C and lowest at LF/21 °C (Fig. 2), with a reduc-
tion by 77% in area growth rate (p < 0.001, Table 1, Fig. 2a) and by 72% in polyp growth rate (p = 0.013, Table 1,
Fig. 2b) (Supplementary Tables 2 and 3). In contrast, no significant differences in area and polyp growth rates
were detected between HF/18 °C and HF/21 °C. Low food availability alone (LF/18 °C) significantly decelerated
colony area growth by 50% (p = 0.001, Table 1) compared to HF/18 °C, but had a less pronounced effect on polyp
number growth (decrease by 32%, n.s.). The effect of food scarcity was also visible in the high-temperature treat-
ments, where colonies at LF/21 °C were 66% smaller and developed 63% fewer polyps compared to HF/21 °C
(not significant due to high scatter and mortality in the LF/21 °C treatment).
Despite a decreasing trend in hydroid growth (i.e., number of polyps, Fig. 2b) with increasing experimental
stress in scenario 2, differences between the treatments were statistically not significant. This may be due to high
mortality rates in the LF/21 °C, resulting in a lower number of available data points. Under theses high food
and temperature stresses (LF/21 °C), the colonies were often not able to develop new polyps for several days to
weeks. These “stable” polyp numbers under stressful conditions (LF/21 °C), could not be fitted by the Gompertz
function and are therefore not represented in the growth rates. Nevertheless, at 18 °C, low food availability
(LF/18 °C) caused 46% smaller colonies with 57% fewer polyps compared to high food conditions (HF/18 °C).
At elevated water temperature, colonies were 23% smaller, with 23% fewer polyps for low food (LF/21 °C) com-
pared to high food (HF/21 °C).
The mortality of juveniles in scenario 1 (Fig. 3) did not differ significantly between treatments, ranging
between 6.5 and 8.9%. In contrast, the mortality in scenario 2 (Fig. 3) was more heterogeneous and varied
between 7.5% in the HF/21 °C treatment and 25.7% in the LF/21 °C. The higher temperature fluctuations in
scenario 2 significantly increased mortality of hydroids exposed to the most stressful treatment LF/21 °C (four-
sample test of equal proportions, p < 0.001). Here, the mortality was almost three times higher compared to all
other treatments of both scenarios (Fig. 3).
Comparison of the growth model and scenario 1. The area growth (Fig. 4a) in the experimental and
simulated data showed a positive, almost linear correlation over time in all treatments. In both data sets, the area
of the colonies was affected by food and temperature, resulting in decreased growth under low-food and high-
temperature conditions (HF/18 °C < HF/21 °C < LF/18 °C < LF21 °C). Discrepancies between experimental and
Scientific Reports | (2021) 11:7483 | https://doi.org/10.1038/s41598-021-86918-4 2
Vol:.(1234567890)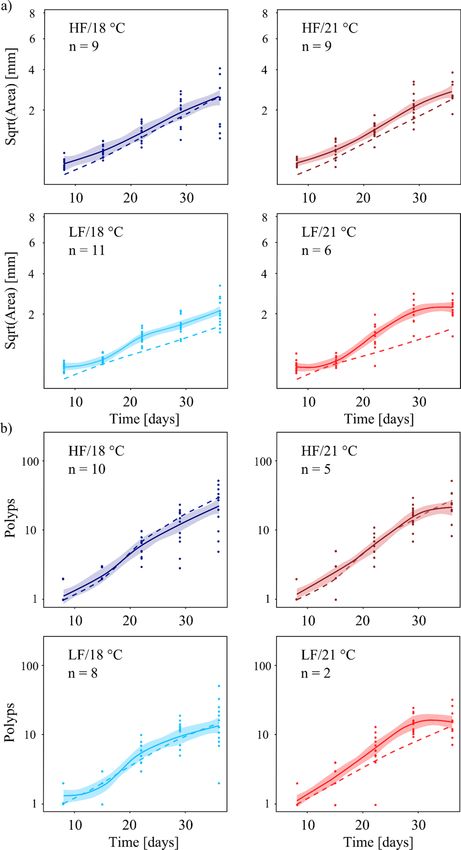
www.nature.com/scientificreports/

                                  Figure 1.  Representative images of juvenile H. echinata colonies in all treatments of scenario 1(left) and 2
                                  (right) by the end of both experiments. HF = high food, LF = low food, 18 °C = control temperature, 21 °C = high
                                  temperature, st = stolon channels, pol = polyps. The white scale bar equals 2 mm.

                                  Figure 2.  Area growth rates (a) and polyp growth rates (b) of juvenile H. echinata in two experiments, scenario
                                  1(left) and 2 (right); median ± SD . HF = high food (dark blue and red boxes), LF = low food (light blue and
                                  red boxes), 18 °C = control temperature (blue boxes), 21 °C = high temperature (red boxes). All treatments
                                  in scenario 2 contained an extra temperature step of + 1.5 °C for six hours daily (see also Fig. 3). Significant
                                  differences between treatments are marked by lower cases.

Scientific Reports |   (2021) 11:7483 |               https://doi.org/10.1038/s41598-021-86918-4                                                 3

                                                                                                                                            Vol.:(0123456789)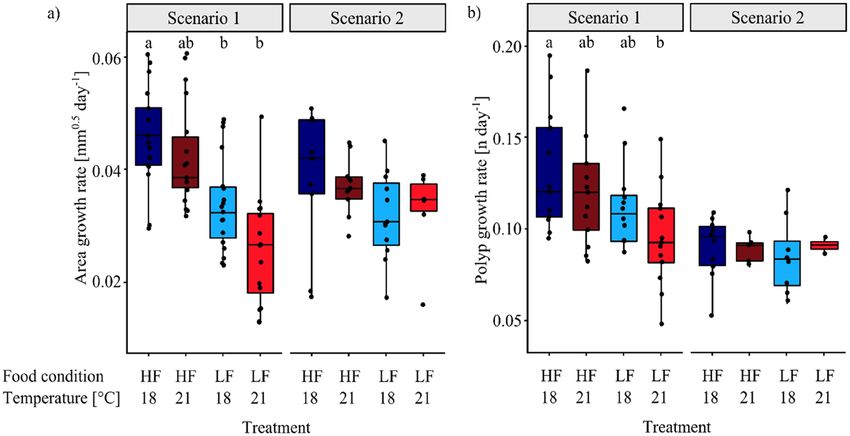
www.nature.com/scientificreports/
Scenario 1 Scenario 2
Area Polyps Area Polyps
Growth rates
R2 0.90 0.98 0.90 0.98
p p adj p p adj p p adj p p adj
HF/18 °C–HF/21 °C 0.13 0.13 0.42 0.42 0.49 0.49 0.59 1
HF/18 °C–LF/18 °C 5.3*10–4 1.1*10–3 0.10 0.2 0.13 0.39 0.63 1
–6
HF/18 °C–LF/21 °C 3.6*10 1.1*10–5 4.2*10–3 0.013 0.14 0.39 0.91 1
Mortality rates
X2 Df p X2 Df P
0.22 3 0.97 16.42 3 < 0.001
Table 1. Statistical results of growth and mortality rates of juvenile H. echinata over time in scenario 1 and
2. HF = high food, LF = low food, 18 °C = control temperature, 21 °C = high temperature. Significant values
are shaded grey. The upper table contains the p-values (p), adjusted p-values (p adj.) and coefficient of
determination (R2) of pairwise comparison (Wilcoxon test) with multiple-testing adjustment (Bonferroni-
Holmes) of area and polyp growth. The bottom part of the table shows Chi-squared (X2), degrees of freedom
(Df) and p-values (p) of the test for equality of proportions of the mortality rates. N
Total = 77 for scenario 1and
40 for scenario 2.
Figure 3. Mortality (full coloured boxes) of juvenile H. echinata and surviving colonies (half-transparent boxes)
in two experiments, scenario 1(left) and 2 (right); median ± SD. HF = high food (dark blue and red boxes);
LF = low food (light blue and red boxes); 18 °C = control temperature (blue boxes); 21 °C = high temperature (red
boxes). All treatments in scenario 2 contained an extra temperature step of + 1.5 °C for six hours daily (see also
Fig. 3). Significant differences between treatments are marked by lower cases.
model data were found in treatments HF/21 °C and LF/18 °C. In contrast to the experiment, that showed lower
area growth at elevated temperature (Fig. 4a, HF/21 °C), the model simulated nearly constant growth by the end
of the experiment. Furthermore, the model underestimated area growth of the colonies at LF/18 °C (Fig. 4a, bot-
tom left) compared to the experiment, which showed increasing growth rates 20–25 days post settlement. This
resulted in larger colonies at the end of the experiment than predicted by the model.
Polyp development (Fig. 4b) over time was more complex than area growth, when comparing experimental
with model data. In the high food treatment (Fig. 4b, HF/21 °C), experimental colonies reached the final polyp
numbers predicted by the model, but showed a growth delay during the first weeks of the experiment compared
to model data. Furthermore, food limitation resulted in lower polyp numbers by the end of the experiment
(LF/18 °C, LF/21 °C, Supplementary Table 3) than predicted by the model. In contrast to model predictions,
higher water temperatures, in combination with food stress (Fig. 4b, LF/21 °C), limited polyp development
towards the end of the experiment. This limitation is reflected by decreasing growth rates at the end of the experi-
ment, and implies that the experimental data are close to saturation compared to the model data.
Comparison of the growth model and scenario 2. In scenario 2, temperature fluctuations dimin-
ished differences in colony size (= area) between low- and high water temperature in the experimental data
Scientific Reports | (2021) 11:7483 | https://doi.org/10.1038/s41598-021-86918-4 4
Vol:.(1234567890)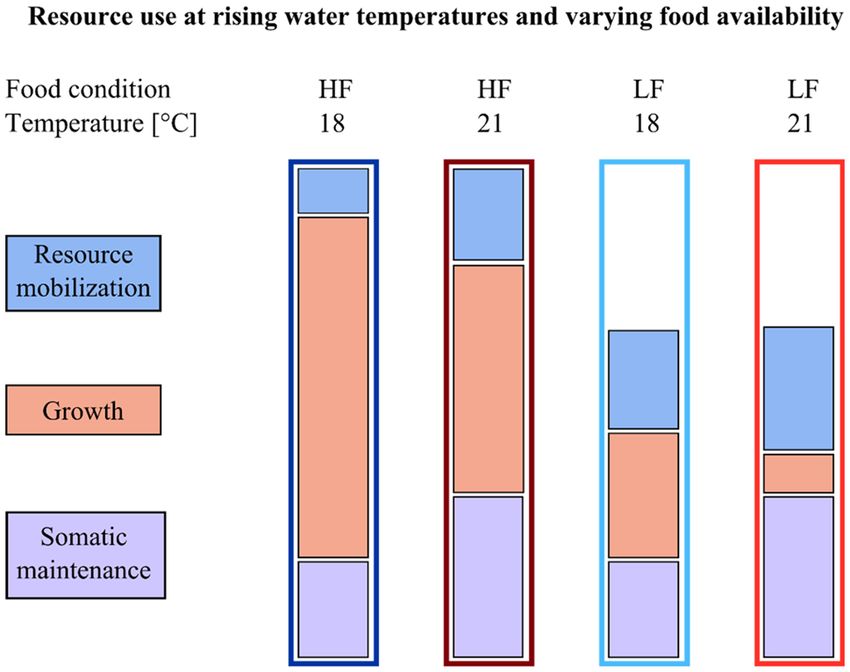
www.nature.com/scientificreports/

                                  Figure 4.  Area (a) and polyp number (b) of juvenile H. echinata in scenario 1over a period of six weeks post-
                                  settlement (median ± SE; solid line and shaded region) compared to numerical growth model data (dashed
                                  lines). HF = high food (dark blue and red lines); LF = low food (light blue and red lines); 18 °C = control
                                  temperature (blue lines); 21 °C = high temperature (red lines).

Scientific Reports |   (2021) 11:7483 |               https://doi.org/10.1038/s41598-021-86918-4                                                   5

                                                                                                                                            Vol.:(0123456789)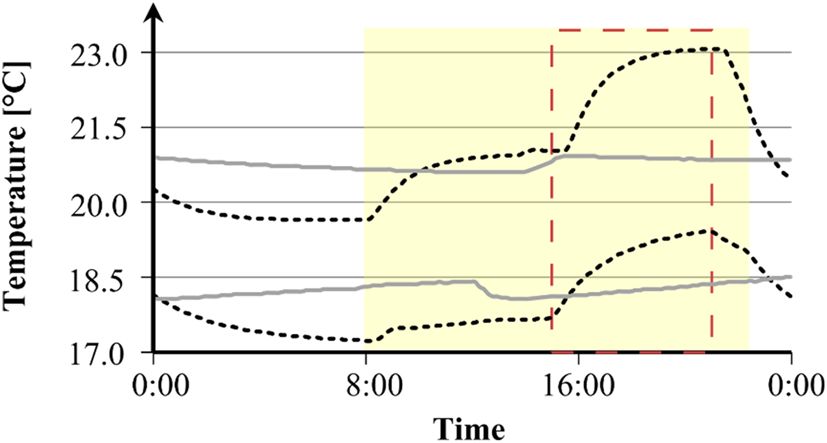
www.nature.com/scientificreports/
(Fig. 5a; Supplementary Table 2). Furthermore, the growth curves based on the experimental data were com-
pressed towards more stressful conditions (stress intensity = HF/18 °C < HF/21 °C < LF/18 °C < LF21 °C), causing
an abrupt rise in the growth performance in the low food treatments at about 20 days post-settlement. Saturation
of area growth was reached earlier in all experimental treatments compared to HF/18 °C. In most treatments,
the area growth was underestimated by the simulation compared to experimental data (HF/21 °C, LF/18 °C,
LF/21 °C).
Trends in polyp development (Fig. 5b) in experimental treatments of scenario 2 were similar to scenario 1.
Higher water temperature limited growth performance in the experimental data more than predicted by the
model. Especially during the last 10 days of the experiment, polyp growth reached saturation, in contrast to
the model (Fig. 5b, right, HF/21 °C, LF/21 °C). The experimental polyp number in the most stressful treatment
(Fig. 5b, bottom right, LF/21 °C) reached saturation about 30 days post-settlement. The polyp development under
these conditions was constantly underestimated by the simulation.
Discussion
In the present study, low nutrient availability, in combination with temperature stress, considerably reduced
vitality and growth performance of H. echinata. In scenario 1, mimicking ambient and future environmental
conditions in the subtidal (= stable temperature conditions), hydroids showed significantly decreasing polyp
numbers and colony area under 21 °C and low food conditions. At the same time, sufficient nutrient availability
seemed to mitigate the negative effects of temperature stress on H. echinata, leading to similar growth rates of
animals exposed to LF/18 °C/and HF/21 °C in both scenarios. The results of scenario 2 further indicate that in the
intertidal (= fluctuating temperature conditions), due to high and low tide, higher temperatures will intensify the
effects of predicted higher sea water temperatures on marine biota. The additional temperature step of + 1.5 °C
(6 h per day) lowered growth rates and diminished differences between the treatments of scenario 2 compared
to animals exposed to the more stable temperature conditions in scenario 1. The combination of heat and food
stress (LF/21 °C) in scenario 2 actually significantly increased the mortality rate of the hydroids. Our results
are supported by studies on marine mollusks, such as bivalves or g astropods18,28,29. For example, Mytilus califor-
nianus responded to the combined effect of heat and food stress with an energetic trade-off between survival and
growth29. At the lowest trophic level, Thomas and c olleagues22 demonstrated that temperature-nutrient interac-
tions predicted for 2100 are likely to limit the occurrence of the marine phytoplankton Thalassiosira pseudonana
in Arctic waters to a greater degree than either factor alone. The results of our experiments and previous studies
show that across trophic levels, lower productivity and stress resistance in marine species result from rising water
temperatures and trophic mismatches. Since marine hydroids can be considered as a model for macrozoobenthic
species, which in turn function as an important food source for higher trophic l evels30, our results further imply
that there will be decreasing productivity at higher trophic levels under the future environmental conditions.
Temperature stress reduced the growth rates (area and polyp count) of H. echinata moderately in scenario
1 and significantly in scenario 2 (Fig. 1), while a previous study showed that metabolic rates increase31. Rising
environmental temperatures generally accelerate biochemical and metabolic reactions in marine e ctotherms32,33,
which can be accompanied by increasing rates of cell damage and reduced growth performance (e.g., in clams,
lobsters, and sea cucumbers34–36). Eder et al.31 found higher cell damage accumulation in juvenile H. echinata
exposed to 21 °C / low food, indicated by higher protein carbonyl contents and most likely induced by increasing
production rates of reactive oxygen species. Therefore, in hydroids of scenario 2, with the additional daily tem-
perature step above 21 °C, cell damage most likely occurred at a greater rate, inducing anomalously low growth
rates compared to scenario 1. Crucially, mortality rates were considerably higher in the LF/21 °C compared to all
other treatments of scenario 1 and 2. Here, the damaging influence of temperature stress seems to outweigh the
protective capacities, so that cell and tissue integrity can no longer be maintained. Temperature shifts exceeding
21 °C may thus be critical for some marine ectotherms in terms of growth and vitality34,35.
The growth performance of colonies at control temperatures (18 °C) in both scenarios followed the assump-
tions of the numerical model in most cases, and, therefore, can be explained by relatively simple relationships,
such as temperature-driven metabolism and the effect of resource limitation on energy storage and growth. On
the other hand, the discrepancies between the experimental data and the model predictions for the highest stress
treatments (21 °C/LF) of both scenarios indicate physiological stress reactions that were negligible under control
conditions and were therefore not considered in the numerical growth model. For example, the model tended
to overestimate the development of the polyps and the area during the high-temperature treatments of scenario
1, whereas it underestimated them in scenario 2. The underestimation of the performance in the most stressed
treatment LF/21 °C (scenario 2) can be explained by the fact that mortality could not be implemented in the
model. During the experiment, colonies with poor performance died, resulting in higher average numbers of
polyps and colony area in the remaining juvenile hydroids. In a similar context, Thomas and c olleagues22 showed
that current ecosystem models overestimate the tolerance of organisms to rising temperatures. They concluded
that ectotherms are less tolerant to future warming than to cooling, and that temperatures above the optimum
will severely affect both fitness and growth rates of ectotherms and marine p hytoplankton22.
The decreased growth performance at 21 °C compared to 18 °C treatments and the observed differences
between model and experimental data can be explained by shifts in energy gain and investment (Fig. 6). The
investment of the energy (in the form of ATP) in different physiological functions can vary, depending on the
needs of the organism under different environmental c onditions24. In our study, for example, temperature- and
food-stress-induced cell damage accumulation may have forced hydroids to allocate more energy to cell main-
tenance and survival rather than to area- and polyp growth (Fig. 6). Since physiological processes involved in
cell protection, maintenance and repair (e.g., antioxidants capacities, apoptosis and proliferation) could not be
Scientific Reports | (2021) 11:7483 | https://doi.org/10.1038/s41598-021-86918-4 6
Vol:.(1234567890)www.nature.com/scientificreports/
Figure 5. Area (a) and polyp number (b) of H. echinata juveniles in scenario 2 over a period of five weeks
post-settlement (median ± SE; solid line and shaded region) compared to numerical growth model data
(dashed lines). HF = high food (dark blue and red lines); LF = low food (light blue and red lines); 18 °C = control
temperature (blue line); 21 °C = high-temperature (red lines). All treatments contained an extra temperature step
of + 1.5 °C for six hours daily (see also Fig. 3).
Scientific Reports | (2021) 11:7483 | https://doi.org/10.1038/s41598-021-86918-4 7
Vol.:(0123456789)www.nature.com/scientificreports/
Figure 6. Illustration of resource use in juvenile H. echinata at experimental temperature and nutrient
conditions in scenario 1 and 2. Low food limits the overall resource availability for the synthesis of biomolecules
and energy production necessary for growth (orange boxes) and somatic maintenance (purple boxes), and
increases relative costs for resource mobilization (blue boxes) compared to high food. High water temperature
(21 °C) increases energetic and nutritive costs for somatic maintenance and intensifies resource mobilization,
while energy availability for growth decreases. At low water temperatures (18 °C), energy can be invested in
growth and maintenance, but is limited by food intake. Costs for maturation, reproductive buffer, and maturity
maintenance have not been taken into account for juvenile hydroids in this figure.
included in the numerical growth model, they most likely explain the observed difference between model and
experimental data.
We currently lack a mechanistic framework for integrating the effects of multiple interacting physiological
functions on the vitality and growth performance of marine invertebrates. The parameterization of ecological
growth models is challenging when the experimental/ecological conditions are beyond the optimum of the
organisms/ecosystems, and when phenomenological relationships (e.g., temperature-growth relationship) are
not sufficient model bases. At the same time, as in our case, they represent an important instrument for draw-
ing attention to physiological stress response mechanisms (e.g., cell protection and repair) that could not be
considered in the current model assumptions due to a lack of data, and which should serve as a basis for more
complex model approaches in future studies. However, we showed that the growth of juvenile hydroids at tem-
peratures beyond the optimum is a saturation function of energy availability. Temperature effects on growth
performances and vitality of H. echinata were strongly modulated by food availability. High food availability
shifted the thermal optimum of juvenile hydroids to 21 °C as indicated by the growth performance of hydroids
at HF/21 °C, which exceeded that of animals at LF/18 °C in both scenarios. The high food treatments covered the
energy costs for various physiological functions, such as maintenance and growth of juvenile colonies, despite
higher seawater temperatures. Recent studies show a similar trend, with a high diet increasing the acclimatiza-
tion potential of Mytilus californianus and M. edulis to temperature- and acidification s tress29,37. Furthermore,
the model by Thomas et al.22 for phytoplankton predicts an increase in the minimal requirements for nutrients
with rising temperature, and vice versa.
When combining temperature (21 °C) and food stress (LF), hydroid growth rates decreased considerably in
both scenarios, and mortality was highest in animals exposed to the most extreme conditions (LF/21 °C, scenario
2), reflecting the mismatch between increasing energy demand and decreasing supply. The combined effect of
rising SST and decreased primary and secondary production can be considered to induce energetic imbalances
and lower resistances to environmental stress in marine invertebrates such as H. echinata, but also in other
trophic levels such as that of phytoplankton. The direct relationship between resource availability, allocation, and
ecological performance (e.g., growth and reproduction) has been demonstrated for a variety of unicellular and
multicellular marine species such as phytoplankton, bivalves, and fish22,38–41. However, many studies investigat-
ing the interaction between warming and changing nutrient requirements focused on nutrient-rich conditions
and showed synergistic effects of eutrophication and w arming42–44. These interactions may differ strongly in
oligotrophic ecosystems, in which temperature-dependent nutrient requirements cannot easily be satisfied. Our
current and recent studies on marine and freshwater phytoplankton communities show that the optimum tem-
perature window for growth saturates at a species-specific nutrient concentration, and thus temperatures above
the optimum can no longer be compensated for by higher food intake (this study; 22,45). Low food availability
caused early growth saturation in juvenile hydroids at increasing temperature stress in both scenarios. Similarly,
while single experimental treatments of temperature increase or nutrient depletion (oligotrophication) led to
increases in resource-use efficiency and phytoplankton community growth, the combined treatment resulted in
non-linear responses, reflecting the mismatch between increasing energy demand and decreasing supply45. In
the present study, excessive maintenance costs (e.g., due to temperature stress) under low nutrition consider-
ably lowered the energy investment into hydroid growth. The high mortality rates of hydroids in the LF/21 °C
Scientific Reports | (2021) 11:7483 | https://doi.org/10.1038/s41598-021-86918-4 8
Vol:.(1234567890)www.nature.com/scientificreports/
treatment in scenario 2 indicate severe energy deficiencies, likely inducing cell damage, degradation, and cell
and tissue death. While high nutrient supply increases the adaptive potential and the growth performance of
marine organisms28,46, individuals with resource constraints are exposed to an energy trade-off between survival
and growth29.
We could show that temperature effects on morphological traits and vitality of marine hydroids were altered
significantly by food availability, and that both temperature—and nutrient/nutritional stress should be taken into
consideration when predicting future species abundances. Negative effect of food limitation outweighed these
of rising water temperatures, while temperature stress responses of H. echinata were mitigated by sufficient food
supply. We conclude that the interactive effects of ocean warming, increasing energy demand, and decreasing
resources may have major impacts on biodiversity and ecosystem function and thus need to be incorporated into
environmental management plans. Species living in extreme habitats exposed to highly fluctuating environmental
conditions, such as the intertidal, need specific attention and protection arrangements.
Methods
Collection of parental colonies. Wildtype colonies of H. echinata were collected by staff of the Alfred
Wegener Institute within the German Bight around Sylt (55°02′ N; 08°28′ E) with the research vessel MYA II in a
depth of 1–3.5 m. Here, the mean annual SST ranges between 1 and 20 °C47, and the salinity between 25 and 33
PSU48. The sampling took place in April 2016 (scenario 1) and June 2016 (scenario 2). The hydroid colonies were
transported to the Carl von Ossietzky University of Oldenburg, and cultured in artificial sea water (Aqua Medic,
Germany) at 12 °C and 34 PSU. Before the transport, the hermit crabs were removed from the shells colonized
by hydroids. At the University of Oldenburg, the colonies were fed daily with two-day-old living Artemia salina
nauplii.
Reproduction and larval settlement. Juvenile hydroids were cultured as described in the Helgo-
land Manual of Animal Development27 Eder et al.31. Overall, 10 male and 10 female adult H. echinate colo-
nies were placed together into one big holding tank to release eggs and sperm for fertilization. The fertilized
eggs then transformed into larvae. The transformation of the larvae was induced by caesium chloride49 fol-
lowing the protocol of as described by Eder et al.31, which randomly settled onto black glass tiles (dimensions
10 mm × 10 mm × 2 mm, Mosaikstein, Germany), at least 2–3 larvae on each tile. The colonized glass tiles were
then randomly dispersed into the different treatment tanks. As these recruits result from sexual reproduction of
overall 20 parental colonies, we can assume high genetic variability of individuals. For individual identification
of juvenile colonies, prior to the experiment the glass tiles were engraved underneath with consecutive numbers.
After three weeks, the juvenile colonies growing closer to the edges were removed to avoid edge effects, leaving
one colony per tile. Prior to the start of the experiments, the colonies were kept in artificial seawater at 18 °C and
34 PSU for 24 h post settlement. From day five of post-settlement onwards, juveniles were fed with two-day-old
living Artemia salina nauplii.
Experimental setup. The influence of temperature and food availability on the growth of H. echinata colo-
nies was tested in two different experiments (= scenarios) to evaluate the effect of ambient and future environ-
mental conditions on H. echinata in the subtidal (scenario 1, Fig. 7, left panel) and in the intertidal, a habitat
characterized by high temperature fluctuations (scenario 2, Fig. 7, right panel). In both scenarios, colonies were
exposed to two different temperatures (control and high) cross-factored with two different food conditions (low
and high; Fig. 7).
The control temperature of ~ 18 °C simulated the actual sea surface temperature (SST) during summer in the
German Bight (data from Helgoland Roads, 2010–2014, http://www.st.nmfs.noaa.gov). The high temperature
of ~ 21 °C was chosen according to predicted increasing SST by the end of the century in the North Sea 8.
To evaluate the influence of food availability on the growth potential in hydroids as a response to increasing
SST, colonies were fed with two-day-old living A. salina nauplii (> 1000 nauplii/ml per tank per feeding event)
following either a high food (HF) or a low food (LF) scheme (Fig. 7) according to Eder et al.31. Colonies with
HF were fed five times a week and with LF three times a week. The LF treatments simulated ´food stress` and
were patterned on the predicted decrease in primary and secondary production during the next d ecades6,50.
All experimental conditions, including temperature and food, but also salinity, pH, as well as water quality
(ammonium, nitrite and nitrate) were constantly monitored. The temperature was measured every ten minutes
using HOBO Tidbit v2 Temp Loggers (Onset, USA). The salinity was checked prior to every water exchange (five
times a week) with a hand-held refractometer (Arcarda, Germany). Twice a week, the pH was measured with a
pH controller (Aqua Medic, Germany), and concentrations of ammonium, nitrite and nitrate were determined
with test kits (JBL, Germany). The water quality was checked once a week before the water exchange. If the limit
values for ammonium, nitrite and phosphate (0.25 mg/l, 0.2 mg/l and 0.1 mg/l) were exceeded, an additional
water change was performed to ensure a consistently good water quality. Juvenile colonies were exposed to a
14 h-light and 10 h-dark cycle according to in-situ conditions in the German Bight in summer (July/August)31.
Each replicate tank, covered by a lid to reduce evaporation and cooling, was provided with air through an air
stone, which was placed in the middle of each tank and connected to a pump (HP-40, Hiblow, Japan). To mini-
mize bacterial and algal growth on the glass tiles they were cleaned once a week, without touching the colonies.
Scenario 1. In the first experiment (Fig. 7, left panel) conducted in June–August 2016, the growth of 80 H.
echinata colonies was analysed. The juvenile colonies growing on glass tiles were randomly dispersed into 24
holding tanks containing 100 ml artificial sea water (3–4 glass tiles per tank, 6 replicate tanks per treatment) and
exposed for six weeks to, overall, four experimental treatments: HF/18 °C, HF/21 °C, LF/18 °C, LF/21 °C (Fig. 7,
Scientific Reports | (2021) 11:7483 | https://doi.org/10.1038/s41598-021-86918-4 9
Vol.:(0123456789)www.nature.com/scientificreports/
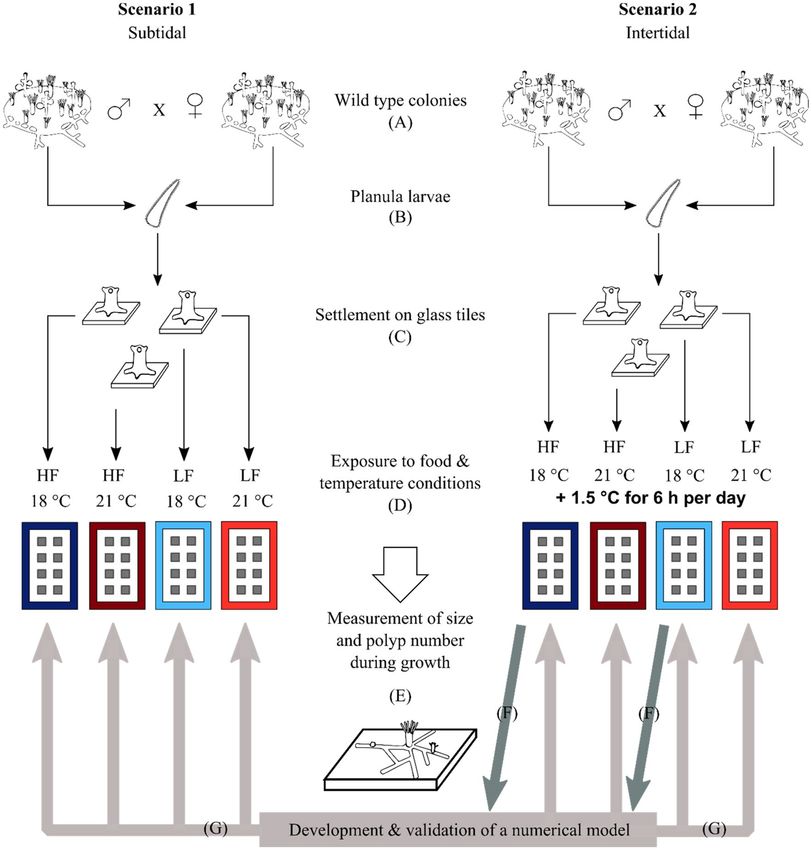
Figure 7. Experimental design for analysing growth performance and mortality of juvenile H. echinata in two
experiments, scenario 1 (left) and 2 (right). The larvae (b) of wild type colonies (a) were settled on glass tiles (c)
and transferred to holding tanks for experimental exposure to variable temperature and food conditions (d):
HF = high food (dark blue and red tanks); LF = low food (light blue and red tanks); 18 °C = control temperature
(blue tanks); 21 °C = high temperature (red tanks). All treatments in scenario 2 contained an extra temperature
step of + 1.5 °C for six hours daily. Throughout the experimental timeline and in each treatment, the growth
performance of H. echinata was monitored (e). Additionally, a numerical growth model was developed (f dark
grey arrows) based on daily analysis of morphological parameters (colony area, polyp number) in hydroids in
treatments HF/18 °C and LF/18 °C of scenario 2 and validated (g light grey arrows) by comparing simulated and
experimental growth data in all treatments of both scenarios.
left panel). The temperature treatments in this scenario were chosen according to more stable conditions in the
subtidal (Fig. 8, grey solid lines), with a control temperature of 18.5 °C ± 0.41 (mean ± SD; Fig. 8, lower grey line)
and a high temperature of 20.8 °C ± 0.23 (mean ± SD; Fig. 8, upper grey line). The 24 holding tanks containing
the juvenile hydroids were placed in two temperature-constant water baths as described in Eder et al.31. A ther-
mostatic heater (Thermo control 300, Eheim, Germany) and two circulation pumps (Voyager Nano, Sicce, Italy)
in each water bath kept temperatures constant at 18 °C and 21 °C, respectively.
Scenario 2. The second scenario (Fig. 7, right panel) was conducted in October-December 2016, testing
71 juvenile H. echinata colonies under fluctuating temperature stress. The tiles were dispersed randomly into
32 holding tanks (2–3 glass tiles per tank, 8 replicate tanks per treatment) filled with 300 ml artificial sea water
and exposed to four different treatments for five weeks, respectively: HF/18 °C + 1.5 °C, HF/21 °C + 1.5 °C,
Scientific Reports | (2021) 11:7483 | https://doi.org/10.1038/s41598-021-86918-4 10
Vol:.(1234567890)www.nature.com/scientificreports/
Figure 8. Daily temperature profiles of the control (18 °C; bottom) and high-temperature (21 °C; top)
treatments in scenario 1(solid grey lines) and 2 (dotted black lines). In both scenarios, light was provided to
experimental animals daily between 8 am and 10 pm (yellow box). All treatments in scenario 2 contained an
extra temperature step of + 1.5 °C for six hours daily (between 15:00 and 21:00 h; red box).
LF/18 °C + 1.5 °C, LF/21 °C + 1.5 °C (Fig. 7, right panel). This scenario contained an additional temperature step
(+ 1.5 °C) for all treatments, to implement daily temperature fluctuations and mimic natural variations in the
intertidal during high and low tide51; Fig. 8, black dotted lines). Therefore, the control temperature treatments
of 18.2 °C ± 0.60 was increased daily for six hours to 19.5 °C ± 0.17 (mean ± SD; Fig. 8, lower black line), and the
high temperature treatments of 20.7 °C ± 0.55 to 22.3 °C ± 0.06 (mean ± SD; Fig. 8, upper black line). The holding
tanks were placed into temperature-controlled incubators (MIR-554, Panasonic Healthcare Co., Japan & MIR-
553, Sanyo Electric Co., Japan) for each temperature regime.
Growth rates and mortality. Throughout the experiment, the colonies developed normally without any
signs of polyp or tentacle deformation. Each colony was morphometrically analyzed on a weekly basis in terms
of colony area and number of polyps, as indicators for individual growth performance. These parameters were
determined throughout both experiments by analyzing weekly photographs of colonies (Fig. 1), taken through
a binocular microscope (Leica M205 C, Leica Microsystems, Germany) between the ages of 5–46 days post-
settlement (scenario 1) and 8–36 days post-settlement (scenario 2). In scenario 1, the photographs of animals
in the HF and LF treatments were taken three days apart for logistical reasons. The area of each colony was
determined graphically by an automated script developed using Matlab (Version R2015b, The MathWorks, Inc.,
USA). The script identifies the shape of the largest patch on each glass tile and excludes the spaces between the
stolonal channels. Geometric patterns were not taken into consideration to counteract potential morphological
differences based on genetic variations or similarities (e.g. sheet or runner like colonies). For the determination
of polyp number, only completely developed polyps equipped with tentacles were counted, whereas buddies
were ignored. The juveniles did not reach sexual maturity during the experiment, therefore the colonies con-
sisted exclusively of feeding polyps.
Additionally, we analyzed mortality rates by day 35 post-settlement for both scenarios, which were character-
ized by visible colony-wide signs of cell necrosis and tissue detachment from the surface.
In the treatments HF/18 °C and LF/18 °C of the second scenario, daily pictures of eight colonies (four colo-
nies of each treatment) were taken between day 8 and 27 post-settlement to develop and validate a numerical
growth model.
Model development and validation. To identify physiological response mechanisms of juvenile hydroids
exposed to nutrient and temperature stress, we developed a numerical growth model based on morphological
data. The effect of environmental stress was simulated by phenomenological relationships, such as temperature-
driven metabolism and the negative effects of resource limitation on growth rates. To identify unexpected trends
and features in the experimental growth data, the results of the model simulations were compared to the experi-
mental data.
The model simulated the day-to-day growth of the colonies through building up feeding polyps and the stolon
system. The polyps were described by nodes of a growing network connected by stolon branches. The energy
was treated as an artificial, dimensionless quantity that was distributed over the nodes of the network. Food
uptake resulted in an increase of the energy amount of every feeding polyp. Energy loss was accounted for by
temperature-dependent rest and activity respiration according to van’t Hoff ’s rule and the costs for stolon and
polyp growth. The energy of a node was equally distributed to adjacent stolons and polyps at a fixed distribution
rate, whereby pressure inequalities in stolon branches were not considered due to an assumed constant stolon
diameter.
The model was initialized by one feeding polyp. Depending on the available energy, the colony developed
feeding polyps first to increase its energy intake. Then, if enough energy was left, the colony built up stolon
branches of a certain length in an arbitrary direction. The energy needed for stolon growth was proportional
to the length and had to exceed the parameterized amount for the growth of a stolon of reference length. The
minimum distance between two polyps was also parameterized, as well as the energy needed for this process.
Parameter values were partly taken from the experiments and partly estimated by automatic parameter
optimization (Supplementary Table 1). For this, the parameters of the model were trained to the lab data of the
Scientific Reports | (2021) 11:7483 | https://doi.org/10.1038/s41598-021-86918-4 11
Vol.:(0123456789)www.nature.com/scientificreports/
LF/18 °C treatment (scenario 2) in respect to the number of feeding polyps and area of the colony. The trained
parameter set was then used for all other simulations. The simulation was repeated 100 times per treatment,
with the respective temperature and food scheme and randomized stolon growth. The model was programmed
in C and ran for 43 days (scenario 1) and 37 days (scenario 2) with a time step of 6 h to simulate the periods of
frequent temperature stress in scenario 2 (= additional temperature step). The model was calibrated using the
treatment LF/18 °C (scenario 2).
Statistics. We compared the growth performance over time between experimental data and simulated data,
for both scenarios separately. Area and polyp growth rates were compared by a pairwise Wilcoxon test with mul-
tiple-testing adjustment (Bonferroni-Holmes) in R (R version 3.5.1, R Core Team 2018). The 18 °C high-food
condition (HF/18 °C) was set as the reference group. The respective parameters (α, b) were calculated as follows:
1. Area growth (colony area as a function √ of time) of the individual colonies was square root transformed and
fitted with a linear model of the form, 4 A(t) = a + bt + ε(t),[4]A(t) = a + bt + ε(t), where A is the colony
area, a, b represent intercept and slope of the fitted area growth curve, respectively, and ε is the model error.
2. The polyp growth (number of polyps as a function of time) was fitted using the parametric Gompertz func-
tion without transformation, usually used to describe tumour growth kinetics (Laird, 1964) as follows:
−βt
N(t; α, β) = e α/β 1−e , where α > 0 is the initial growth constant, lim dt
d
N(t) = αN(t), i.e. initial expo-
t→0
nential growth, lim N(t) = exp (αt), and β > 0 is the growth constant at the maximum growth rate, i.e.,
t→0
β α/β
d
dt N(t = t i ) = βN(t = t i ) = e e , with t i = ln βα /β defining the inflexion point of the (sigmoidal)
growth curve. The function follows the trend of a logistic growth curve, but is characterized by asymmetric
growth through saturation. In both experiments, saturation was probably not reached, but in scenario 2,
growth declined towards the end of the experiment. This decline was set as an indicator for the end of the
optimal growth phase and, therefore, the end of the experiment. The β parameter determined for the exper-
imental polyp growth curve of each colony was always significantly lower than the respective α parameter
and did not differ significantly across the conditions. This allowed us to compare the conditions in terms of
the α parameter only.
The analysis of numerical growth model data followed the same procedure. Then, the growth curves over time
(polyp number, colony area) for the experimental data and the simulation were qualitatively compared based
on the shape and the discrepancies between the curves. Parametric functions to experimental growth curves
were fitted using NonlinearModelFit in Wolfram Mathematica (Version 11, Wolfram Research, UK). R was used
for statistical analysis and for producing graphical output. The effect sizes (Cohen’s effect size, Odds Ratio) are
presented in the supplements (Supplementary Table 4, 5).
In addition, we analyzed the experimental data in terms of mortality, which was defined as the proportion of
colonies that died 35 days after settlement, using the proportion test in R.
Animal rights. All applicable international, national, and/or institutional guidelines of the University Old-
enburg and the federal state Lower Saxony (Germany) for the care and use of animals were followed.
Data availability
All data used for the growth analysis of scenario 1 and scenario 2 are available at https://doi.org/10.5063/DZ06QQ
(Knowledge Network for Biocomplexity).
Received: 15 September 2020; Accepted: 22 March 2021
References
1. Hoegh-Guldberg, O. & Bruno, J. F. The impact of climate change on the world’s marine ecosystems. Science 328, 1523–1528. https://
doi.org/10.1126/science.1189930 (2010).
2. Ghalambor, C. K., McKay, J. K., Carroll, S. P. & Reznick, D. N. Adaptive versus non-adaptive phenotypic plasticity and the potential
for contemporary adaptation in new environments. Funct. Ecol. 21, 394–407. https://doi.org/10.1111/j.1365-2435.2007.01283.x
(2007).
3. Kelly, M. W., Pankey, M. S., DeBiasse, M. B. & Plachetzki, D. C. Adaptation to heat stress reduces phenotypic and transcriptional
plasticity in a marine copepod. Funct. Ecol. 31, 398–406. https://doi.org/10.1111/1365-2435.12725 (2017).
4. Hillebrand, H., Soininen, J. & Snoeijs, P. Warming leads to higher species turnover in a coastal ecosystem. Glob. Change Biol. 16,
1181–1193 (2010).
5. Edwards, M. & Richardson, A. J. Impact of climate change on marine pelagic phenology and trophic mismatch. Nature 430,
881–884. https://doi.org/10.1038/nature02808 (2004).
6. IPCC. Climate change 2014: synthesis report. Contribution of working groups I, II and III to the fifth assessment report of the
intergovernmental panel on climate change [Core Writing Team, R.K. Pachauri and L.A. Meyer (eds.)]. 151 pp. (IPCC, Geneva,
Switzerland, 2014).s
7. Allen, M. et al. Technical Summary: Global warming of 1.5 °C. An IPCC Special Report on the impacts of global warming of
1.5 °C above pre-industrial levels and related global greenhouse gas emission pathways, in the context of strengthening the global
response to the threat of climate change, sustainable development, and efforts to eradicate poverty. (2019).
8. Schrum, C. et al. In North Sea Region Climate Change Assessment (eds Quante, M. & Colijn, F.) 175–217 (Springer, Cham, 2016).
9. Leckebusch, G. C. & Ulbrich, U. On the relationship between cyclones and extreme windstorm events over Europe under climate
change. Global Planet. Change 44, 181–193. https://doi.org/10.1016/j.gloplacha.2004.06.011 (2004).
10. Meehl, G. A. & Tebaldi, C. More intense, more frequent, and longer lasting heat waves in the 21st century. Science 305, 994–997.
https://doi.org/10.1126/science.1098704 (2004).
Scientific Reports | (2021) 11:7483 | https://doi.org/10.1038/s41598-021-86918-4 12
Vol:.(1234567890)www.nature.com/scientificreports/
11. Sokolova, I. M. & Pörtner, H. O. Physiological adaptations to high intertidal life involve improved water conservation abilities and
metabolic rate depression in Littorina saxatilis. Mar. Ecol. Prog. Ser. 224, 171–186. https://doi.org/10.3354/meps224171 (2001).
12. Gregg, W. W., Conkright, M. E., Ginoux, P., O’Reilly, J. E. & Casey, N. W. Ocean primary production and climate: global decadal
changes. Geophys. Res. Lett. 30, 1809–1813 (2003).
13. Delworth, T. L. et al. The North Atlantic Oscillation as a driver of rapid climate change in the Northern Hemisphere. Nat. Geosci.
9, 509–513 (2016).
14. Grabemann, I. & Weisse, R. Climate change impact on extreme wave conditions in the North Sea: an ensemble study. Ocean Dyn.
58, 199–212. https://doi.org/10.1007/s10236-008-0141-x (2008).
15. Woth, K., Weisse, R. & Von Storch, H. Climate change and North Sea storm surge extremes: an ensemble study of storm surge
extremes expected in a changed climate projected by four different regional climate models. Ocean Dyn. 56, 3–15. https://doi.org/
10.1007/s10236-005-0024-3 (2006).
16. Sebens, K. P. Energetic constraints, size gradients, and size limits in benthic marine invertebrates. Integr. Comp. Biol. 42, 853–861.
https://doi.org/10.1093/icb/42.4.853 (2002).
17. Greve, W., Prinage, S., Zidowitz, H., Nast, J. & Reiners, F. On the phenology of North Sea ichthyoplankton. ICES J. Mar. Sci. 62,
1216–1223. https://doi.org/10.1016/j.icesjms.2005.03.011 (2005).
18. Hoefnagel, K. N. & Verberk, W. C. E. P. Long-term and acute effects of temperature and oxygen on metabolism, food intake, growth
and heat tolerance in a freshwater gastropod. J. Therm. Biol 68, 27–38. https://doi.org/10.1016/j.jtherbio.2016.11.017 (2017).
19. Del Toro-Silva, F. M., Miller, J. M., Taylor, J. C. & Ellis, T. A. Influence of oxygen and temperature on growth and metabolic per-
formance of Paralichthys lethostigma (Pleuronectiformes: Paralichthyidae). J. Exp. Mar. Biol. Ecol. 358, 113–123. https://doi.org/
10.1016/j.jembe.2008.01.019 (2008).
20. Dodds, L. A., Roberts, J. M., Taylor, A. C. & Marubini, F. Metabolic tolerance of the cold-water coral Lophelia pertusa (Scleractinia)
to temperature and dissolved oxygen change. J. Exp. Mar. Biol. Ecol. 349, 205–214. https://doi.org/10.1016/j.jembe.2007.05.013
(2007).
21. Pecl, G. T. et al. Biodiversity redistribution under climate change: Impacts on ecosystems and human well-being. Science 355,
eaai9214. https://doi.org/10.1126/science.aai9214 (2017).
22. Thomas, M. K. et al. Temperature–nutrient interactions exacerbate sensitivity to warming in phytoplankton. Glob. Change Biol.
23, 3269–3280. https://doi.org/10.1111/gcb.13641 (2017).
23. Thomas, M. K., Kremer, C. T., Klausmeier, C. A. & Litchman, E. A global pattern of thermal adaptation in marine phytoplankton.
Science 338, 1085–1088. https://doi.org/10.1126/science.1224836 (2012).
24. Sokolova, I. M., Frederich, M., Bagwe, R., Lannig, G. & Sukhotin, A. A. Energy homeostasis as an integrative tool for assessing
limits of environmental stress tolerance in aquatic invertebrates. Mar. Environ. Res. 79, 1–15. https://doi.org/10.1016/j.marenvres.
2012.04.003 (2012).
25. Cunningham, C. W., Buss, L. W. & Anderson, C. Molecular and geologic evidence of shared history between hermit crabs and the
symbiotic genus Hydractinia. Evolution 45, 1301–1316. https://doi.org/10.1111/j.1558-5646.1991.tb02637.x (1991).
26. Frank, U., Leitz, T. & Müller, W. A. The hydroid Hydractinia: a versatile, informative cnidarian representative. BioEssays 23, 963–971
(2001).
27. Plickert, G. In The Helgoland Manual of Animal Development (ed. Fischer, A.) (Verlag Dr. Friedrich Pfeil, München, 2013).
28. Ballesta-Artero, I., Janssen, R., van der Meer, J. & Witbaard, R. Interactive effects of temperature and food availability on the growth
of Arctica islandica (Bivalvia) juveniles. Mar. Environ. Res. 133, 67–77. https://doi.org/10.1016/j.marenvres.2017.12.004 (2018).
29. Fitzgerald-Dehoog, L., Browning, J. & Allen, B. J. Food and heat stress in the California mussel: evidence for an energetic trade-off
between survival and growth. Biol. Bull. 223, 205–216. https://doi.org/10.1086/BBLv223n2p205 (2012).
30. Reise, K. et al. in The Wadden Sea 2010. Common Wadden Sea Secretariat (CWSS); Trilateral Monitoring and Assessment Group:
Wilhelmshaven.(Wadden Sea Ecosystem; 29/editors, Harald Marencic and Jaap de Vlas) Vol. 7 (2010).
31. Eder, Y., Tschink, D., Gerlach, G. & Strahl, J. Physiology of juvenile hydroids-high food availability mitigates stress responses of
Hydractinia echinata to increasing seawater temperatures. J. Exp. Mar. Biol. Ecol. 508, 64–72. https://d oi.o
rg/1 0.1 016/j.j embe.2 018.
07.009 (2018).
32. Angilletta, M. J. J., Steury, T. D. & Sears, M. W. Temperature, growth rate, and body size in ectotherms: fitting pieces of a life-history
puzzle. Integr. Comp. Biol. 44, 498–509. https://doi.org/10.1093/icb/44.6.498 (2004).
33. Corkrey, R. et al. Protein thermodynamics can be predicted directly from biological growth rates. PLoS ONE 9, e96100. https://
doi.org/10.1371/journal.pone.0096100 (2014).
34. Hornstein, J., Espinosa, E. P., Cerrato, R. M., Lwiza, K. M. M. & Allam, B. The influence of temperature stress on the physiology
of the Atlantic surfclam, Spisula solidissima. Comp. Biochem. Physiol. A Mol. Integr. Physiol. 222, 66–73. https://doi.org/10.1016/j.
cbpa.2018.04.011 (2018).
35. Fitzgibbon, Q. P., Simon, C. J., Smith, G. G., Carter, C. G. & Battaglene, S. C. Temperature dependent growth, feeding, nutritional
condition and aerobic metabolism of juvenile spiny lobster, Sagmariasus verreauxi. Comp. Biochem. Physiol. A Mol. Integr. Physiol.
207, 13–20. https://doi.org/10.1016/j.cbpa.2017.02.003 (2017).
36. Dong, Y., Dong, S., Tian, X., Zhang, M. & Wang, F. Effects of water temperature on growth, respiration and body composition of
young sea cucumber Apostichopus japonicus. J. Fish. Sci. China 12, 33–37 (2005).
37. Thomsen, J., Casties, I., Pansch, C., Kortzinger, A. & Melzner, F. Food availability outweighs ocean acidification effects in juvenile
Mytilus edulis: laboratory and field experiments. Glob Chang Biol. 19, 1017–1027. https://doi.org/10.1111/gcb.12109 (2013).
38. MacDonald, B. A. & Thompson, R. J. Influence of temperature and food availability on the ecological energetics of the giant scallop
Placopecten magellanicus. Mar. Biol. 93, 37–48. https://doi.org/10.1007/BF00428653 (1986).
39. Urrutia, M. B., Ibarrola, I., Iglesias, J. I. P. & Navarro, E. Energetics of growth and reproduction in a high-tidal population of the
clam Ruditapes decussatus from Urdaibai Estuary (Basque Country, N. Spain). J. Sea Res. 42, 35–48. https://doi.org/10.1016/
S1385-1101(99)00017-9 (1999).
40. Pilditch, C. A. & Grant, J. Effect of temperature fluctuations and food supply on the growth and metabolism of juvenile sea scallops
(Placopecten magellanicus). Mar. Biol. 134, 235–248. https://doi.org/10.1007/s002270050542 (1999).
41. Donelson, J. M., Munday, P. L., McCormick, M. I., Pankhurst, N. W. & Pankhurst, P. M. Effects of elevated water temperature and
food availability on the reproductive performance of a coral reef fish. Mar. Ecol. Prog. Ser. 401, 233–243. https://doi.org/10.3354/
meps08366 (2010).
42. Heino, J., Virkkala, R. & Toivonen, H. Climate change and freshwater biodiversity: detected patterns, future trends and adaptations
in northern regions. Biol. Rev. 84, 39–54. https://doi.org/10.1111/j.1469-185X.2008.00060.x (2009).
43. Moss, B. et al. How important is climate? Effects of warming, nutrient addition and fish on phytoplankton in shallow lake micro-
cosms. J. Appl. Ecol. 40, 782–792. https://doi.org/10.1046/j.1365-2664.2003.00839.x (2003).
44. Rosset, V., Lehmann, A. & Oertli, B. Warmer and richer? Predicting the impact of climate change on biodiversity in small temperate
waterbodies. Glob. Change Biol. 16, 2376–2387. https://doi.org/10.1111/j.1365-2486.2010.02206.x (2010).
45. Verbeek, L. et al. Compositional and functional consequences of environmental change in Belgian farmland ponds. Freshw. Biol.
63, 581–596. https://doi.org/10.1111/fwb.13095 (2018).
46. Han, C.-H. & Uye, S.-I. Combined effects of food supply and temperature on asexual reproduction and somatic growth of polyps
of the common jellyfish Aurelia aurita s.l. Plankton Benthos Res. 5, 98–105. https://doi.org/10.3800/pbr.5.98 (2010).
Scientific Reports | (2021) 11:7483 | https://doi.org/10.1038/s41598-021-86918-4 13
Vol.:(0123456789)You can also read


