Direct radiative effect of dust-pollution interactions - atmos-chem-phys ...
←
→
Page content transcription
If your browser does not render page correctly, please read the page content below
Atmos. Chem. Phys., 19, 7397–7408, 2019
https://doi.org/10.5194/acp-19-7397-2019
© Author(s) 2019. This work is distributed under
the Creative Commons Attribution 4.0 License.

Direct radiative effect of dust–pollution interactions
Klaus Klingmüller1 , Jos Lelieveld1,2 , Vlassis A. Karydis1,3 , and Georgiy L. Stenchikov4
1 Max   Planck Institute for Chemistry, Hahn-Meitner-Weg 1, 55128 Mainz, Germany
2 The  Cyprus Institute, P.O. Box 27456, 1645 Nicosia, Cyprus
3 Institute of Energy and Climate Research, Forschungszentrum Jülich GmbH, 52425 Jülich, Germany
4 Physical Science and Engineering Division, King Abdullah University of Science and Technology,

Thuwal 23955-6900, Saudi Arabia

Correspondence: Klaus Klingmüller (k.klingmueller@mpic.de)

Received: 16 October 2018 – Discussion started: 3 December 2018
Revised: 9 May 2019 – Accepted: 16 May 2019 – Published: 4 June 2019

Abstract. The chemical ageing of aeolian dust, through in-          1   Introduction
teractions with air pollution, affects the optical and hygro-
scopic properties of the mineral particles and hence their at-
mospheric residence time and climate forcing. Conversely,           Atmospheric aerosols play an important role in the climate
the chemical composition of the dust particles and their role       system by affecting radiative transfer and thus the planet’s
as coagulation partners impact the abundance of particulate         energy budget, both directly by scattering and absorption and
air pollution. This results in a change in the aerosol direct ra-   indirectly via its impact on cloud formation (IPCC, 2014).
diative effect that we interpret as an anthropogenic radiative      Furthermore, fine particulate matter can be a human health
forcing associated with mineral dust–pollution interactions.        hazard and is a major cause of morbidity and mortality glob-
Using the ECHAM/MESSy atmospheric chemistry climate                 ally (Lelieveld et al., 2015).
model (EMAC), which combines the Modular Earth Sub-                    Aerosols originate both from natural and anthropogenic
model System (MESSy) with the European Centre Hamburg               sources, the former being mostly mineral dust, sea salt and
(ECHAM) climate model, including a detailed parametrisa-            emissions from naturally ignited fires. Mineral dust is the
tion of ageing processes and an emission scheme account-            dominant aerosol component by mass, and natural sources
ing for the chemical composition of desert soils, we study          are responsible for most of its atmospheric load, even though
the direct radiative forcing globally and regionally, consider-     about 25 % may be from human-made sources (Ginoux et al.,
ing solar and terrestrial radiation. Our results indicate pos-      2012). The natural sources provide an inevitable background
itive and negative forcings, depending on the region. The           level of atmospheric particulate matter, while studies of the
predominantly negative forcing at the top of the atmosphere         human impact on climate and air pollution commonly fo-
over large parts of the dust belt, from West Africa to East         cus on aerosol from anthropogenic sources. However, within
Asia, attains a maximum of about − 2 W m−2 south of the             the atmosphere natural and anthropogenic aerosols are mixed
Sahel, in contrast to a positive forcing over India. Globally       and interact and therefore should not be considered sepa-
averaged, these forcings partially counterbalance, resulting        rately.
in a net negative forcing of −0.05 W m−2 , which neverthe-             In the presence of anthropogenic pollution, gaseous com-
less represents a considerable fraction (40 %) of the total dust    pounds, notably acids, condense on the mineral dust parti-
forcing.                                                            cles (Karydis et al., 2011). The consequent interactions are
                                                                    dubbed chemical ageing, converting the initially hydropho-
                                                                    bic dust particles into hydrophilic ones (Karydis et al., 2017),
                                                                    leading to the hygroscopic growth of the particles with im-
                                                                    plications for their optical properties and the rate of deposi-
                                                                    tion (Levin et al., 1996; Abdelkader et al., 2015, 2017). The
                                                                    dust particles also serve as coagulation partners for particu-

Published by Copernicus Publications on behalf of the European Geosciences Union.
7398                                             K. Klingmüller et al.: Direct radiative effect of dust–pollution interactions

late anthropogenic pollution. Moreover, the chemical compo-       bines ECHAM 5.3.02 and MESSy 2.52 and is configured
sition of the dust particles affects the chemical properties of   to use the horizontal resolution T106 and 31 vertical lev-
the aerosol mixture (Karydis et al., 2016) and hence the hy-      els. The grid spacing of the Gaussian T106 grid, 1.125◦
groscopic and optical properties as well as the atmospheric       along latitudes and about 1.121◦ along longitudes, corre-
residence time of both the natural and anthropogenic compo-       sponds to virtually quadratic cells with around 125 km edge
nents. In view of emerging economies with a growing pop-          length at the Equator. The following MESSy submodels have
ulation and increasing emissions from industry, energy pro-       been enabled: AEROPT, AIRSEA, CLOUD, CLOUDOPT,
duction and transport in dust-affected regions such as north-     CONVECT, CVTRANS, DDEP, GMXE, JVAL, LNOX,
ern Africa, the Middle East and large parts of Asia; the im-      MECCA, OFFEMIS, ONEMIS, ORBIT, ORACLE, PTRAC,
portance of these effects is ever increasing (Osipov et al.,      RAD, SCAV, SEDI, SURFACE, TNUDGE and TROPOP.
2015; Osipov and Stenchikov, 2018).                               Descriptions of each submodel and further references can
   In the present study we analyse the impact of mineral          be found online in the MESSy submodel list (MESSy 2018,
dust interactions with anthropogenic air pollution on radia-      2018). The model dynamics above the boundary layer are
tive transfer using the ECHAM/MESSy chemistry climate             nudged to meteorological analyses of the ECMWF, and the
model (EMAC; Jöckel et al., 2005, 2010). EMAC com-                aerosol radiative effect on the dynamics is computed us-
bines the Modular Earth Submodel System (MESSy) with              ing the extinction, single scattering albedo and asymme-
the European Centre Hamburg (ECHAM) climate model,                try factor from the Tanre aerosol climatology (Tanre et al.,
which is originally based on the weather forecasting model        1984). The aerosol radiative coupling to the meteorology
of the European Centre for Medium-Range Weather Fore-             and that between aerosols and clouds have been disabled
casts (ECMWF). Here we focus on the direct radiative effects      to exclude higher-order effects such as feedbacks by pre-
while not considering aerosol–cloud coupling and ignoring         cipitation and evaporation changes and to focus on the di-
radiative feedbacks on the climate system. Both aspects, of       rect radiative forcing. The CMIP5 RCP4.5 (Coupled Model
which especially the former influences radiative forcing, will    Intercomparison Project Phase 5 Representative Concentra-
be considered in a separate study based on climate model          tion Pathway 4.5; Clarke et al., 2007), GFEDv3.1 (Global
simulations that account for atmosphere–ocean coupling.           Fire Emissions Database; Randerson et al., 2013) and Aero-
   Our main goal is to understand how the mineral dust in         Com (Aerosol Comparisons between Observations and Mod-
the present-day atmosphere differs from dust under natural        els; Dentener et al., 2006) databases provide anthropogenic,
conditions and in particular to evaluate the implications on      biomass burning and sea-salt emissions, respectively.
the global and regional radiative transfer, which is the focus       The EMAC model considers dust ageing by condensation
of the present study. Accordingly we choose the methodol-         of soluble compounds, ionisation, hydrolysis and the asso-
ogy described in the following section, which, in contrast to     ciated water uptake. The model representation of the hy-
previous studies (Abdelkader et al., 2015, 2017), does not al-    groscopic variations has been evaluated against field mea-
ter the chemical ageing mechanism but rather the emissions.       surements by Metzger et al. (2016). Abdelkader et al.
The impact of dust on pollution is crucial and therefore con-     (2017) evaluated the chemical ageing during the transatlantic
sidered by our approach on an equal footing with the impact       dust transport using ground-based AERONET (Aerosol
of pollution on dust. A technical objective of this study is to   Robotic Network) observations and satellite retrievals from
assess the error introduced in climate models if mineral dust     MODIS (Moderate Resolution Imaging Spectroradiometer)
and anthropogenic pollution are assumed to coexist without        and CALIPSO (Cloud-Aerosol Lidar and Infrared Pathfinder
any interaction and thereby to point out the importance of        Satellite Observations). Consistent results were also reported
taking the interactions into account.                             by other studies (e.g. Abdelkader et al., 2015; Klingmüller
   The article is structured as follows: in Sect. 2 we present    et al., 2018; Brühl et al., 2018). The relevant submodels in-
our methodology, including the model set-up. The effects of       clude the Global Modal Aerosol Extension (GMXE; Pringle
dust–pollution interactions on the aerosol burdens and corre-     et al., 2010a, b), which simulates the aerosol microphysics
spondingly the optical properties are analysed in Sect. 3, and    considering four soluble (nucleation, Aitken, accumulation
the resulting impacts on radiative transfer and atmospheric       and coarse) and three insoluble modes (Aitken, accumulation
heating are analysed in Sect. 4. Conclusions are drawn in         and coarse). The size distribution of each mode is represented
Sect. 5.                                                          by a log-normal distribution with fixed geometric standard
                                                                  deviation (σg = 2 for the two coarse modes and σg = 1.59
                                                                  for all others); fixed dry radius boundaries between the nucle-
2   Methodology                                                   ation, Aitken, accumulation and coarse modes (6 nm, 60 nm
                                                                  and 1 µm); and variable mean radius. GMXE employs ISOR-
We used the EMAC model version and configuration de-              ROPIA II (Fountoukis and Nenes, 2007) or EQSAM4clim
scribed by Klingmüller et al. (2018), which was shown to          (EQuilibrium Simplified Aerosol Model V4 for climate sim-
yield realistic results of aerosol optical properties globally    ulations; Metzger et al., 2016) for the gas–aerosol parti-
(see Fig. S1 in the Supplement). This EMAC version com-           tioning (here we use the former). The amount of gas ki-

Atmos. Chem. Phys., 19, 7397–7408, 2019                                            www.atmos-chem-phys.net/19/7397/2019/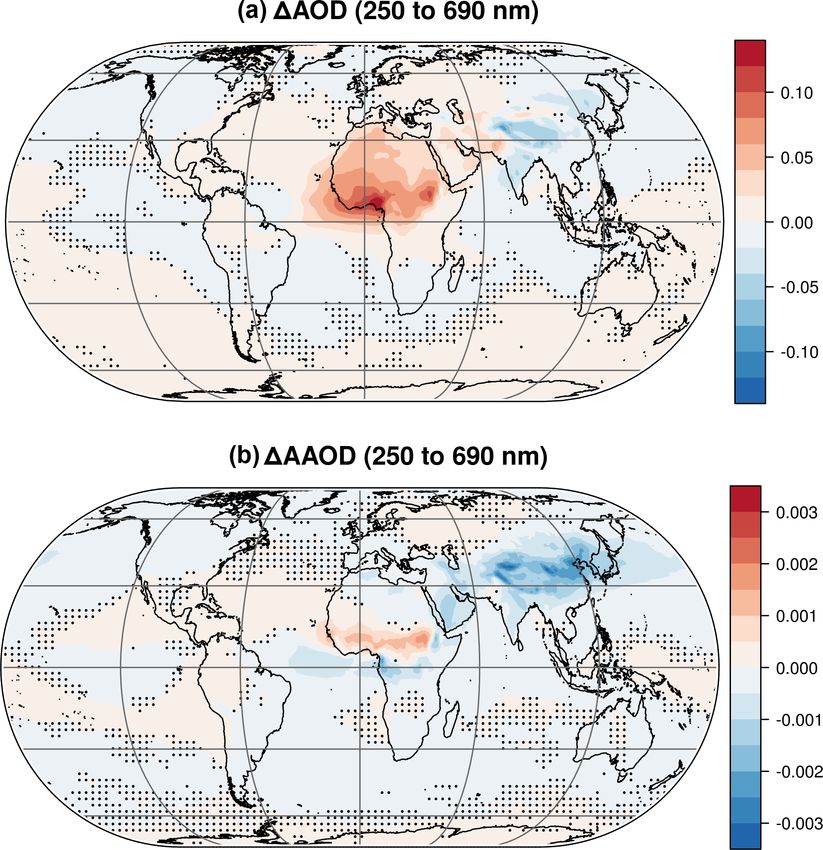
K. Klingmüller et al.: Direct radiative effect of dust–pollution interactions                                                 7399

netically able to condense is calculated assuming diffusion-       Table 1. Emission set-ups.
limited condensation using the accommodation coefficients
in Table 2 before ISORROPIA II redistributes the mass be-                 Simulation                 1     2      3      4
tween the gas and aerosol phase to obtain the final amount                Anthropogenic emissions    Yes   Yes    No     No
of condensed material (Pringle et al., 2010a, b). The OR-                 Dust emissions             Yes   No     Yes    No
ACLE (Organic Aerosol Composition and Evolution) sub-
model comprehensively describes organic aerosols (Tsimpidi
et al., 2014). A detailed simulation of the gas-phase chem-
                                                                   sidering all emissions (simulation 1), the same simulation but
istry is performed by the Module Efficiently Calculating the
                                                                   without dust emissions (simulation 2), a simulation with only
Chemistry of the Atmosphere (MECCA; Sander et al., 2011).
                                                                   natural emissions (simulation 3) and the corresponding simu-
   Aerosol optical properties are calculated by the AEROPT
                                                                   lation without dust emissions (simulation 4). For the natural
(AERosol OPTical properties) submodel (Lauer et al., 2007;
                                                                   emission set-ups, we omit the CMIP5 anthropogenic emis-
Pozzer et al., 2012; Klingmüller et al., 2014), which as-
                                                                   sions and reduce the GFED biomass burning emissions by
sumes the aerosol components within each mode to be well-
                                                                   90 % (Levine, 2014). All dust emissions are considered to be
mixed in spherical particles with a volume-averaged refrac-
                                                                   natural; hence the anthropogenic impacts of land use and cli-
tive index. The refractive indices AEROPT considers for
                                                                   mate change on the dust emissions (Klingmüller et al., 2016)
the individual components are compiled from the OPAC 3.1
                                                                   are excluded from our analysis. The contribution of dust–
database (Hess et al., 1998; black carbon and mineral dust),
                                                                   pollution interactions to the total aerosol radiative forcing
the HITRAN 2004 database (Rothman et al., 2005; organic
                                                                   can be calculated from the aerosol forcings F1...4 from the
carbon, sea salt, ammonium sulfate and water), Kirchstet-
                                                                   four simulations 1 to 4 by evaluating
ter et al. (2004) (organic carbon for λ < 0.7 µm) and addi-
tional mineral dust values for λ > 2.5 µm (see Klingmüller
                                                                   1F = (F1 − F2 ) − (F3 − F4 ),                               (1)
et al., 2014). The full dataset is specified in the Supplement
(Fig. S20; Tables S1, S2). The imaginary part of the dust re-      the difference of the dust forcing with full emissions F1 − F2
fractive index used here attains a minimum of 4 × 10⁻³ at          and the dust forcing with only natural emissions F3 − F4 .
visible and near-infrared wavelengths. AERONET retrievals          Analogously, we define the dust–pollution interaction effect
might yield lower values, e.g. Gómez-Amo et al. (2017) re-         on aerosol optical depth (AOD), atmospheric heating rates
port 2.5 to 2.8×10⁻³ over Spain; however, due to ageing, the       and aerosol particle burdens.
modelled dust is usually mixed with other components and              Note that the right-hand side of Eq. (1) is symmetric re-
especially water so that the effective imaginary refractive in-    garding the exchange of dust and anthropogenic emissions;
dex of the entire particles is lower than the value assumed for    i.e. it considers the effect of the pollution on dust in the
pure dust.                                                         same way as the effect of dust on pollution by comparing
   The dust emission scheme is part of the online emission         the forcing of anthropogenic pollution in the presence of dust
submodel ONEMIS (Kerkweg et al., 2006b). We use the                (F1 − F3 ) with its forcing in a dust-free scenario (F2 − F4 ).
dust emission scheme presented by Klingmüller et al. (2018),       Unlike the pollution-free scenario, the globally dust-free sce-
which is based on Astitha et al. (2012) and differentiates the     nario has no counterpart in the real world; nevertheless this
Ca++ , K+ , Mg++ and Na+ fractions in mineral particles            interpretation would be suitable for evaluating the regional
originating from different deserts (Karydis et al., 2016). The     impact of dust events or new dust sources on pollution. It can
majority of the mineral dust mass is emitted into the coarse       be instructive to expand the right-hand side (RHS) of Eq. (1)
mode (approximately 89 %), and the remainder is emitted            to the difference of the combined dust and pollution forcing
into the accumulation mode. Freshly emitted mineral dust is        F1 − F4 and the sum of the forcing of only pollution F2 − F4
assumed to be hydrophobic and thus emitted into the insolu-        and only dust F3 − F4 ,
ble modes. Only after condensation of sufficient soluble ma-
terial to cover the particles with 10 monolayers or by coag-       1F = (F1 − F4 ) − ((F2 − F4 ) + (F3 − F4 )) .               (2)
ulation with soluble particles are initially insoluble particles
transferred to the soluble modes (Vignati et al., 2004; Stier         Due to clouds, radiative forcings strongly vary over time,
et al., 2005; Pringle et al., 2010a, b). The removal by wet        and accordingly their temporal averages are associated with
deposition is simulated by the scavenging submodel SCAV            substantial statistical uncertainty even for relatively long av-
(Tost et al., 2006), and dry deposition and sedimentation          eraging intervals. The computation of 1F can be challeng-
is simulated by the submodels DDEP and SEDI (Kerkweg               ing if this uncertainty is uncorrelated between the individual
et al., 2006a).                                                    terms F1...4 . If the aerosol–cloud and radiative coupling to
   Our analysis covers the meteorological year 2011. Four          meteorology are taken into account so that the cloud cover of
simulations with varied emission set-ups (Table 1) are used        the four simulations is no longer identical, it is essential not
to derive the instantaneous forcing by the interaction of min-     to use total fluxes on the RHS of Eq. (1) but to calculate the
eral dust and anthropogenic pollution: one simulation con-         aerosol forcing as the difference between fluxes computed by

www.atmos-chem-phys.net/19/7397/2019/                                                  Atmos. Chem. Phys., 19, 7397–7408, 2019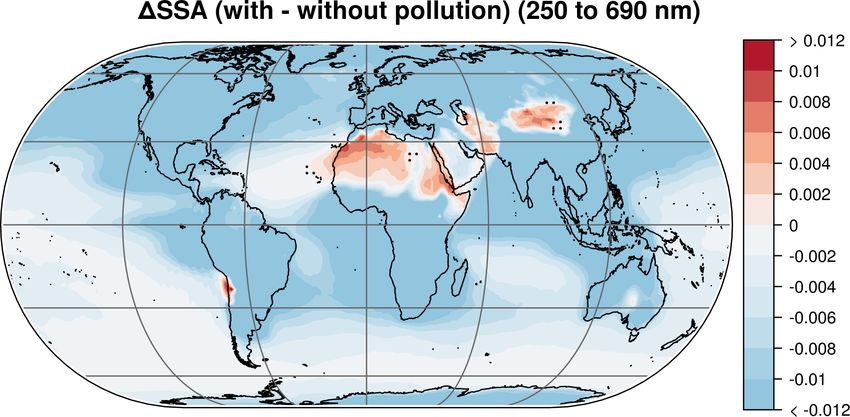
7400                                                K. Klingmüller et al.: Direct radiative effect of dust–pollution interactions

Table 2. Accommodation coefficients.

         Gas-phase species           Accommodation coefficient       References
         Sulfuric acid (H2 SO4 )     0.3 (on insoluble particles)    M7 (Vignati et al., 2004; Raes and Van Dingenen, 1992)
                                     1 (on soluble particles)        M7 (Vignati et al., 2004)
         Nitric acid (HNO3 )         0.1                             GMXE (Pringle et al., 2010a, b; Hanisch and Crowley, 2003)
         Hydrochloric acid (HCl)     0.064                           GMXE (Pringle et al., 2010a, b; Van Doren et al., 1990)
         Ammonia (NH3 )              0.097                           GMXE (Pringle et al., 2010a, b; Feng and Penner, 2007)
         Water (H2 O)                0.3 (on insoluble particles)    GMXE (Pringle et al., 2010a, b)
                                     1 (on soluble particles)        GMXE (Pringle et al., 2010a, b)

two simultaneous radiative transfer computations: one with              no substantial corrections are to be expected (Koepke et al.,
and one without considering the aerosol but both with iden-             2015).
tical cloud effect (Ghan et al., 2012; Dietmüller et al., 2016).           The difference between the global direct aerosol radiative
This eliminates most of the cloud-related statistical noise and         forcings in simulation 2 and simulation 4 yields an anthro-
drastically reduces the length of the averaging period which            pogenic aerosol forcing of −0.61 W m−2 at the TOA (see
is required to obtain significant results. Nevertheless, in the         Figs. S2 to S5 in the Supplement), consistent with the es-
present study the cloud cover is identical for all four simula-         timate of the aerosol–radiation interaction effective radiative
tions because the different emission set-ups do not affect the          forcing (ERF) of −0.45 (−0.95 to 0.05) W m−2 indicated by
meteorology.                                                            IPCC (2014).
   To estimate the remaining statistical uncertainty, we split             The global dust radiative forcing excluding the effect of
the time series of daily averages into n sub-samples, each              dust–pollution interaction can be calculated as the difference
consisting of only every nth daily value. As long as the                between the aerosol forcings in simulation 3 and simula-
choice of n is not too large, this ensures that each sub-sample         tion 4. At the TOA the net forcing amounts to −0.08 W m−2 ,
is unbiased by seasonality. We consider the random terms of             comprising the solar radiation forcing of −0.16 W m−2 and
the sub-samples to be largely uncorrelated, which allows the            the terrestrial radiation forcing of 0.09 W m−2 (see Figs. S6
computation of the statistical uncertainty as standard error of         to S9 in the Supplement). The net forcing is less negative than
the mean (SEM) of the results from all sub-samples. To ob-              the −0.14 W m−2 reported by Bangalath and Stenchikov
tain approximate uncertainty estimates, we use n = 5 for an-            (2015) but well within the range of −0.48 to 0.20 W m−2
nual and n = 7 for seasonal analyses, which are small num-              estimated by Kok et al. (2017) and the wide spread of forc-
bers with regard to the SEM calculation but ensure represen-            ings from different models (Fig. S10 in the Supplement; Yue
tative subsets and are factors of the number of days per year           et al., 2010; Table 1). The total yearly mineral dust emission
and season, respectively. We use the resulting uncertainty es-          and deposition rate is 1.31 Gt yr−1 , slightly higher than the
timate σ to apply a significance threshold of 2σ to our results.        AeroCom estimate of 1.1 Gt yr−1 (Huneeus et al., 2011) and
For our purpose, the 1-year simulation period turns out to be           within the range of 1.7 (1.0 to 2.7) Gt yr−1 provided by Kok
sufficient for producing significant results.                           et al. (2017). The global average 550 nm dust AOD of 0.021
   The interannual variation is estimated based on a 10-year            is comparable to the AeroCom median of 0.023 (Huneeus
simulation at lower T63 resolution (about 1.9◦ ) which yields           et al., 2011) but lower than the 0.03 ± 0.005 reported by Rid-
coefficients of variation (CVs) below 10 % for our main re-             ley et al. (2016). The relatively small dust AOD and forcings
sults. We conclude that while the interannual variation is              in the present study compared to previous work suggest that
not negligible, it does not substantially affect our results.           our estimates for the radiative effect of dust–pollution inter-
Other uncertainties such as biases in the parametrisations              action which predominantly affect the solar spectrum may be
and emission inventories are likely more relevant. This es-             considered to be conservative.
pecially applies to results which integrate partially compen-
sating regional positive and negative contributions such as
the change of the global top-of-the-atmosphere (TOA) forc-              3   Aerosol burdens and optical properties
ing by the dust–pollution interactions. EMAC yields similar
results for different commonly used parametrisations of the             The condensation of soluble compounds, their reaction and
optical properties of internally mixed particles (Klingmüller           the consequent hygroscopic growth increase the size of the
et al., 2014) so that the associated error is small as long as the      dust particles and thereby their dry deposition velocity and
particles are spherical, which is the case after hygroscopic            the efficiency of in- and below-cloud scavenging. Figure 1a
growth. Considering non-spherical particles could improve               shows that the anthropogenic dust ageing significantly re-
the parametrisation for freshly emitted, dry mineral dust, but          duces the dust and hence the coarse mode annual mean mass
                                                                        burden throughout most dust-affected regions (the right col-

Atmos. Chem. Phys., 19, 7397–7408, 2019                                                   www.atmos-chem-phys.net/19/7397/2019/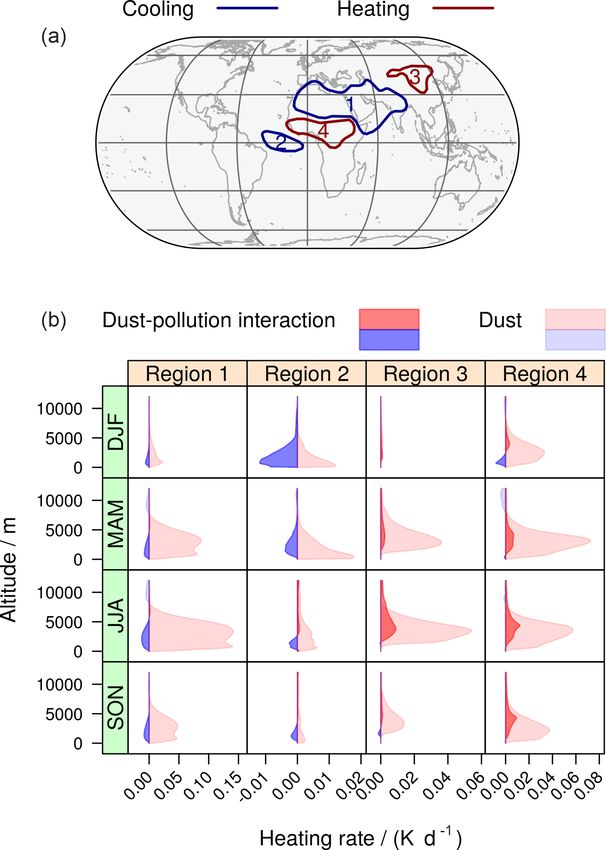
K. Klingmüller et al.: Direct radiative effect of dust–pollution interactions                                                     7401

                                                                        Aerosol components which interact with the mineral cations
                                                                        of the dust behave differently. For instance, in the full emis-
                                                                        sion simulation 1, unlike the dust-free simulation 2, ammo-
                                                                        nium is driven out of the aerosol phase by the mineral cations
                                                                        (Metzger et al., 2006), which results in reduced aerosol am-
                                                                        monium burdens but increased gas-phase ammonia burdens
                                                                        (Fig. S12 in the Supplement). This predominantly affects
                                                                        the accumulation mode which contains the most ammonium.
                                                                        Conversely, the aerosol nitrate burdens are enhanced through
                                                                        the interaction of mineral cations with gas-phase nitric acid.
                                                                        In contrast, similarly to non-ionic components such as BC,
                                                                        aerosol sulfate is transferred from the accumulation mode
                                                                        to the coarse mode through coagulation in the presence of
                                                                        coarse dust particles.
                                                                           The changes of the accumulation mode composition re-
                                                                        duce the hygroscopicity, the amount of accumulation mode
                                                                        water and the AOD. This also prolongs the atmospheric resi-
                                                                        dence time of accumulation mode pollution particles in the
                                                                        full emission simulation 1 compared to the dust-free sim-
                                                                        ulation 2, increasing the burden. In comparison with the
                                                                        pollution-free simulation 3, the accumulation mode burden is
                                                                        enhanced by the reduced coagulation with coarse mode dust
Figure 1. Impact of dust–pollution interaction on the coarse            particles, which are more efficiently removed in the presence
mode (a) and accumulation mode (b) aerosol burden (including            of pollution. Therefore the interaction effect on the accumu-
aerosol water; based on Eq. 1). The more efficient removal of aged      lation mode dust burden is positive (Fig. S11 in the Supple-
dust particles reduces the coarse mode burden throughout the dust       ment). In our simulation, the effects that increase the accu-
belt. This in turn reduces the coagulation efficiency of coarse mode    mulation mode burden generally outweigh the decrease due
with smaller particles, increasing the accumulation mode burden es-     to more efficient deposition of accumulation mode dust par-
pecially where the dust and the African biomass burning regions co-
                                                                        ticles. As shown in Fig. 1b, the interaction of anthropogenic
incide. The strong hygroscopic growth of aged Saharan dust parti-
cles over the western Atlantic results in a regional maximum of the
                                                                        pollution and dust results in an increased annual mean ac-
coarse mode burden increase. Generally, the hygroscopic growth          cumulation mode burden over most regions. We obtain the
of accumulation mode particles is reduced by the interaction with       strongest increase south of the eastern part of the Sahel (point
mineral dust cations manifested in a decreased accumulation mode        A in Fig. 1). The burden changes of the main aerosol com-
burden over Tibet. The burdens over points A and B (crosses) are        ponents over this point which are exemplary for the whole
analysed in Fig. 2; relevant variables over regions A and B are anal-   region (region A; cp. Table 3) are analysed in the upper half
ysed in Table 3 and Fig. S13. Dots indicate regions where the effect    of Fig. 2. Only over some regions, most notably over Tibet
of the dust–pollution interaction is insignificant.                     (region B in Fig. 1), the decreased amount of accumulation
                                                                        mode water results in a decreased total accumulation mode
                                                                        burden (Fig. 2c and d).
umn of Fig. S1 in the Supplement highlights the relevant re-               The net depleting effect of dust–pollution interactions on
gions). The only notable exception is over the western At-              the coarse mode aerosol burden reduces the coarse mode con-
lantic Ocean. Here, the mineral dust moderates the reduction            tribution to the AOD, but the total AOD in the solar spectrum
of sea salt and the associated water by anthropogenic pollu-            is dominated by the accumulation mode, which is enhanced.
tion.                                                                   Indeed, the annual mean effect on the AOD distribution de-
   The effect on the accumulation mode aerosol burden, be-              picted in Fig. 3a clearly resembles that of the effect on the
ing most relevant for the AOD and hence radiative transfer,             accumulation mode shown in Fig. 1b (Fig. 3 shows the AOD
is more complex because not only the effect of pollution on             for the EMAC shortwave band from 250 to 690 nm; includ-
dust but also the effect of dust on accumulation mode pol-              ing the visible wavelengths, the effect on the 550 nm AOD is
lution is relevant. Generally, coarse mineral dust particles            practically identical; see Fig. S14 in the Supplement).
transfer aerosol mass from the accumulation mode to the                    The effect on the aerosol absorption optical depth (AAOD)
coarse mode by coagulation. Therefore the interaction ef-               shown in Fig. 3b is slightly negative due to the higher re-
fect on the burden of no-dust aerosol components tends to               flectance and more efficient removal of aged hygroscopic
be negative for the accumulation mode but positive for the              coarse mode dust and the transfer of absorbing compo-
coarse mode. As Figure S11 in the Supplement shows, this                nents from accumulation to coarse mode by coagulation.
applies to the black carbon (BC), sea-salt and water burdens.           Only south of the Sahel, where the Saharan dust mixes with

www.atmos-chem-phys.net/19/7397/2019/                                                    Atmos. Chem. Phys., 19, 7397–7408, 2019
7402 K. Klingmüller et al.: Direct radiative effect of dust–pollution interactions
Table 3. Annual mean results for various variables over regions A and B in Fig. 1, and the included contributions (1) of the dust–pollution
interactions.
Region A Region B
Variable Value 1 Value 1 Unit
AOD (250 to 690 nm) 0.38 0.042 0.16 −0.047
AAOD (250 to 690 nm) 0.029 −0.00017 0.0094 −0.0017
Dust forcing, pollution forcing −0.35, −1.2 −0.68 0.072, −0.20 0.13 W m−2
Mineral dust burden (accumulation mode) 0.042 0.013 0.011 0.0045 g m−2
Mineral dust burden (coarse mode) 0.096 −0.0073 0.0061 −0.0024 g m−2
BC burden (accumulation mode) 0.00034 −8.3 × 10⁻⁵ 0.00021 −3.1 × 10⁻⁵ g m−2
BC burden (coarse mode) 6.8 × 10⁻⁵ 2.3 × 10⁻⁵ 2.9 × 10⁻⁵ 1.2 × 10⁻⁵ g m−2
Sea-salt burden (accumulation mode) 0.0028 −0.00064 0.00030 −3.5 × 10⁻⁵ g m−2
Sea-salt burden (coarse mode) 0.0030 0.00019 6.6 × 10⁻⁵ −1.6 × 10⁻⁵ g m−2
Aerosol water burden (accumulation mode) 0.018 −0.0011 0.023 −0.015 g m−2
Aerosol water burden (coarse mode) 0.011 0.0016 0.0040 −0.00029 g m−2
ulation 1 compared to simulation 3 without anthropogenic
emissions. Figure 4 shows the annual mean difference of
the SSA in both simulations. The SSA values were aver-
aged over the vertical levels weighted with the extinction,
corresponding to using SSA = 1 − AAOD/AOD. Although
carbonaceous components of the anthropogenic pollution re-
duce the SSA over the remaining globe, over the dust belt the
SSA increases by up to 0.01. Together with the uncertainty
of the refractive index of mineral dust, neglecting this SSA
increase might be responsible for an overestimation of the
atmospheric heating by dust (Balkanski et al., 2007). In the
terrestrial spectrum, aerosol particles are strongly absorbing,
corresponding to very small SSA values which are approxi-
mated by zero in the terrestrial radiative transfer code. There-
fore, unlike the solar radiation, the terrestrial radiation is af-
fected by the dust–pollution interaction only via the modified
extinction.
4 Radiative forcings and heating rates
Figure 2. Analysis of the interaction effect on the aerosol mass bur-
den over point A (a, b) and point B (c, d) in Fig. 1. The left bar in The increased AOD and decreased solar radiation absorption
each panel represents the burden of non-interacting dust and pollu- due to dust–pollution interactions result in a predominantly
tion. It corresponds to (F2 − F4 ) + (F3 − F4 ) in Eq. (2), stacking negative instantaneous direct top-of-the-atmosphere (TOA)
the burdens in simulation 2 with only pollution and simulation 3 forcing, illustrated in Fig. 5a. The consequent climate cool-
with only dust, each after subtracting the background burdens from ing tendency affects large parts of the dust belt, from West
simulation 4 without dust and pollution. The right bar in each panel Africa to East Asia, and attains an annual average of about
represents the burden of interacting dust and pollution in simula- −2 W m−2 south of the Sahel. Positive forcings occur over
tion 1 (after subtracting the background burden), corresponding to Asia, exceeding 0.5 W m−2 over India.
F1 − F4 in Eq. (2). The distribution of the bottom-of-the-atmosphere (BOA)
forcing (Fig. 5c) is similar to that of the TOA forcing, with
an annual mean cooling maximum south of the Sahel up to
biomass burning pollution, is the AAOD increased due to the about −2.5 W m−2 and a warming maximum over the Indo-
strong AOD increase. Gangetic Plain exceeding 1 W m−2 .
The generally reduced absorption by mineral dust inter- Consequently, the net atmospheric forcing is not very
acting with pollution is also reflected in larger single scat- large, consistent with the moderate effect on the AAOD, but
tering albedos (SSA) over dust-dominated regions in sim- is significant (Fig. 5b) and, depending on the region, can
Atmos. Chem. Phys., 19, 7397–7408, 2019 www.atmos-chem-phys.net/19/7397/2019/K. Klingmüller et al.: Direct radiative effect of dust–pollution interactions 7403
Figure 4. Annual mean difference of the single scattering albedo
(SSA) with (simulation 1) and without (simulation 3) anthropogenic
emissions. Extinction weighted mean SSA values of each vertical
column are used. The SSA for all four emission set-ups is shown in
Fig. S16 in the Supplement. Dots indicate regions where the differ-
ence is insignificant.
heating south of the Sahel and the SW cooling west of the
Red Sea are reduced by about 30 %, whereas over the Ara-
bian Peninsula the cooling is enhanced by about 10 %.
Figure 3. Impact of dust–pollution interaction on the AOD (a) and Through atmospheric heating and cooling dust–pollution
the absorption AOD (AAOD; b; based on Eq. 1). The AOD change interactions may impact regional atmospheric dynamics. In
reflects the changes of the accumulation mode burden shown in
Fig. 6 we analyse the heating rates in the main regions with
Fig. 1. Over large parts of the dust belt the accumulation mode AOD
negative (regions 1 and 2) and positive (regions 3 and 4) an-
is increased. In contrast, over the Tibetan Plateau and eastern India
the AOD decreases due to reduced hygroscopic growth of accumu- nual mean atmospheric forcing. Over the largest region with
lation mode particles. South of the Sahel, where the Saharan dust net atmospheric cooling, extending from the Sahara over the
mixes with biomass burning pollution, the strongest accumulation Middle East to India (region 1), the heating rates show little
mode AOD and AAOD increase occurs. Elsewhere, the water up- seasonal variation with a persistent cooling, which reaches a
take of dust and the more efficient removal of absorbing coarse dust summertime average of −0.05 K d−1 over the Arabian Penin-
particles combined with the changed accumulation mode particle sula, with a minimum during winter. Similarly, the heating
radii and refractive indices tend to decrease the AAOD. Dots in- over the largest region with atmospheric warming, extend-
dicate regions where the effect of the dust–pollution interaction is ing from the Sahel to the Congo Basin (region 4), decreases
insignificant. Figure S15 in the Supplement shows the correspond- during winter when it turns negative below 3000 m altitude.
ing plots for the four seasons.
In contrast, over regions 2 and 3 the annual average cool-
ing and heating are largest during one season: over the equa-
torial Atlantic Ocean (region 2), the strongest cooling occurs
be either negative or positive. The largest region with at- during winter. Likewise, the heating over Asia is predomi-
mospheric cooling extends from the Sahara over the Middle nant during summer.
East to India, reaching an annual mean of −0.8 W m−2 over Generally, the heating takes place at higher altitudes than
the Arabian Peninsula. Also over the equatorial Atlantic the the cooling, at times simultaneously, thus stabilising the at-
dust–pollution interactions result in weak but significant at- mosphere, which is further intensified by the predominantly
mospheric cooling. In contrast, south of the Sahel the AAOD negative BOA forcing that cools the surface.
increase (see Fig. 3) results in a positive atmospheric forcing When globally averaged, the regionally positive and neg-
up to 0.5 W m−2 . Over extensive regions in Asia, the forcing ative forcings partially counterbalance. Nevertheless, the net
is positive as well but is mostly below 0.2 W m−2 . annual average global forcing at the TOA is −0.05 W m−2 ,
The TOA and BOA forcings are dominated by the effect representing a considerable fraction of the total dust forcing:
on solar radiation (shortwave – SW; Fig. S17 in the Supple- Fig. 7 compares this forcing with that of the dust when ne-
ment). The effect on the terrestrial radiation (longwave – LW; glecting dust–pollution interactions, i.e. the dust forcing in
Fig. S18 in the Supplement) yields a forcing which is 1 order the pollution-free scenario Fdust = F3 − F4 which amounts
of magnitude smaller than the SW forcing, both globally and to −0.08 W m−2 (SW: −0.16 W m−2 ; LW: 0.09 W m−2 ) and
regionally. For the atmospheric forcing, the LW contribution the dust forcing including the pollution effects, Fdust = F1 −
is more relevant and, depending on the region, partially com- F2 , of −0.13 W m−2 (SW: −0.22 W m−2 , LW: 0.09 W m−2 ).
pensates or enhances the SW forcing. For example, the SW Taking the interactions of dust and anthropogenic pollution
www.atmos-chem-phys.net/19/7397/2019/ Atmos. Chem. Phys., 19, 7397–7408, 20197404 K. Klingmüller et al.: Direct radiative effect of dust–pollution interactions
Figure 6. Heating rate contribution of dust–pollution interactions
(dark colours) in comparison with the mineral dust contribution
(pale colours). Seasonal heating rate profiles of four regions with
negative (regions 1 and 2) and positive (regions 3 and 4) annual
mean atmospheric forcing are shown (b). The regions (a) are se-
lected based on the forcings displayed in the centre of Fig. 5, using
Figure 5. The instantaneous total (solar and terrestrial) direct ra- regions where the absolute forcing exceeds 0.1 W m−2 after apply-
diative forcing of the dust–pollution interaction at the top of the ing a Gaussian filter to avoid fragmentation.
atmosphere (TOA; a), within the atmosphere (atm.; b) and at the
bottom of the atmosphere (BOA; c). Dots indicate regions where
the effect of the dust–pollution interaction is insignificant. The cor- Exposed to anthropogenic pollution, insoluble mineral
responding figures showing the solar and terrestrial forcings as well dust particles are turned hygroscopic by chemical ageing.
as seasonality are provided in the Supplement (Figs. S17 to S19). The subsequent hygroscopic growth increases the efficiency
of scavenging and deposition, thereby reducing the atmo-
spheric residence time and burden of coarse dust particles.
into account when assessing the dust radiative forcing is
This reduces the coagulation rate of accumulation mode dust
therefore recommended, as they significantly enhance the net
particles, increasing the corresponding burden. Other aerosol
global climate cooling effect of mineral dust.
components are generally transferred from the accumulation
to the coarse mode by coagulating with coarse dust particles.
5 Conclusions The interaction of ionic aerosol components with the mineral
cations within the dust particles interferes with this process,
The physico-chemical interactions of mineral dust with air driving cations such as ammonium into the gas phase or en-
pollution significantly affect the optical properties, hygro- hancing the aerosol mass of anions such as nitrate. The com-
scopicity and atmospheric residence time of dust as well as bined effect on the aerosol optical properties is dominated
anthropogenic aerosol particles. We interpret the resulting by an AOD increase caused by the enhanced accumulation
effect on the radiative transfer as an anthropogenic climate mode dust burden and a decreasing AAOD due to the modi-
forcing linked to mineral dust, even though most of the dust fied aerosol composition.
itself is emitted from natural sources.
Atmos. Chem. Phys., 19, 7397–7408, 2019 www.atmos-chem-phys.net/19/7397/2019/K. Klingmüller et al.: Direct radiative effect of dust–pollution interactions 7405
member of the MESSy Consortium by signing the MESSy “Mem-
orandum of Understanding”. More information can be found on
the MESSy Consortium website (https://www.messy-interface.org,
last access: 29 May 2019). The ECHAM climate model is avail-
able to the scientific community under the MPI-M Software Li-
cense Agreement (https://www.mpimet.mpg.de/en/science/models/
license, last access: 29 May 2019). The simulation results analysed
in this study are available at https://edmond.mpdl.mpg.de/imeji/
collection/q9cra0NE3K6ayHG (Klingmüller, 2019).
Supplement. The supplement related to this article is available
online at: https://doi.org/10.5194/acp-19-7397-2019-supplement.
Figure 7. Global mean top-of-the-atmosphere (TOA) forcing of
the dust–pollution interactions in comparison with the mineral dust
forcing from the same EMAC simulation excluding and including Author contributions. KK performed the simulations assisted by
the dust–pollution interactions and the anthropogenic aerosol forc- VAK, analysed the model output and wrote the paper with support
ing. The CVs of the interannual variation are (from top to bottom) from JL, who initiated the study. KK, JL, VAK and GLS interpreted
7 %, 6 %, 5 % and 2 %. the results and finalised the paper.
The resulting climate forcings are non-uniformly spatially Competing interests. The authors declare that they have no conflict
distributed with regionally large positive and negative values. of interest.
The predominantly negative forcing at the top of the atmo-
sphere over large parts of the dust belt, from West Africa to
East Asia, attains a maximum of about −2 W m−2 south of Special issue statement. This article is part of the special issue
the Sahel, in contrast to a positive forcing over India. The sur- “The Modular Earth Submodel System (MESSy) (ACP/GMD inter-
face forcing attains an annual mean of −2.5 W m−2 south of journal SI)”. It is not associated with a conference.
the Sahel, in contrast to a mean positive forcing of 1 W m−2
over the Indo-Gangetic Plain. The TOA forcing follows a
similar pattern with slightly lower absolute values. These Acknowledgements. The research reported in this publication has
forcings are associated with regionally and seasonally vary- received funding from the King Abdullah University of Science and
ing atmospheric cooling and heating, with persistent cooling Technology (KAUST) CRG3 grant URF/1/2180-01 “Combined Ra-
over large parts of the dust belt from North Africa, the Ara- diative and Air Quality Effects of Anthropogenic Air Pollution and
Dust over the Arabian Peninsula”.
bian Peninsula to Pakistan and heating south of the Sahel, so
that a mostly stabilising impact on the atmospheric stratifica-
tion is expected, which may affect the atmospheric dynamics.
Financial support. This research has been supported by the King
Globally, dust–pollution interactions enhance the net cool- Abdullah University of Science and Technology (grant CRG3,
ing effect of mineral dust on climate. The global, annual aver- grant no. URF/1/2180-01).
age TOA direct radiative forcing of −0.05 W m−2 is of sim-
ilar magnitude to the dust forcing ignoring the interactions, The article processing charges for this open-access
which underscores the importance of a detailed account of publication were covered by the Max Planck Society.
these interactions in the assessment of aerosol radiative forc-
ing.
To obtain the direct forcing and to reduce the statisti- Review statement. This paper was edited by Philip Stier and re-
cal noise, in the present study we have excluded feedbacks viewed by two anonymous referees.
of dust and other aerosol effects on radiation transfer and
clouds. These are expected to have a significant impact on
atmospheric dynamics and climate, which will be the subject References
of a subsequent study.
Abdelkader, M., Metzger, S., Mamouri, R. E., Astitha, M., Barrie,
L., Levin, Z., and Lelieveld, J.: Dust–air pollution dynamics over
Code and data availability. The Modular Earth Submodel System the eastern Mediterranean, Atmos. Chem. Phys., 15, 9173–9189,
(MESSy) is continuously further developed and applied by a con- https://doi.org/10.5194/acp-15-9173-2015, 2015.
sortium of institutions. The usage of MESSy and access to the Abdelkader, M., Metzger, S., Steil, B., Klingmüller, K., Tost, H.,
source code are licensed to all affiliates of institutions which are Pozzer, A., Stenchikov, G., Barrie, L., and Lelieveld, J.: Sensi-
members of the MESSy Consortium. Institutions can become a tivity of transatlantic dust transport to chemical aging and re-
www.atmos-chem-phys.net/19/7397/2019/ Atmos. Chem. Phys., 19, 7397–7408, 20197406 K. Klingmüller et al.: Direct radiative effect of dust–pollution interactions
lated atmospheric processes, Atmos. Chem. Phys., 17, 3799– Deep Blue aerosol products, Rev. Geophys., 50, RG3005,
3821, https://doi.org/10.5194/acp-17-3799-2017, 2017. https://doi.org/10.1029/2012RG000388, 2012.
Astitha, M., Lelieveld, J., Abdel Kader, M., Pozzer, A., and de Gómez-Amo, J. L., Estellés, V., Marcos, C., Segura, S., Esteve,
Meij, A.: Parameterization of dust emissions in the global at- A. R., Pedrós, R., Utrillas, M. P., and Martínez-Lozano, J. A.:
mospheric chemistry-climate model EMAC: impact of nudg- Impact of dust and smoke mixing on column-integrated aerosol
ing and soil properties, Atmos. Chem. Phys., 12, 11057–11083, properties from observations during a severe wildfire episode
https://doi.org/10.5194/acp-12-11057-2012, 2012. over Valencia (Spain), Science Total Environ., 599–600, 2121–
Balkanski, Y., Schulz, M., Claquin, T., and Guibert, S.: Reevalua- 2134, https://doi.org/10.1016/j.scitotenv.2017.05.041, 2017.
tion of Mineral aerosol radiative forcings suggests a better agree- Hanisch, F. and Crowley, J. N.: Heterogeneous reactivity of NO and
ment with satellite and AERONET data, Atmos. Chem. Phys., 7, HNO3 on mineral dust in the presence of ozone, Phys. Chem.
81–95, https://doi.org/10.5194/acp-7-81-2007, 2007. Chem. Phys., 5, 883–887, https://doi.org/10.1039/B211503D,
Bangalath, H. K. and Stenchikov, G.: Role of dust direct radiative 2003.
effect on the tropical rain belt over Middle East and North Africa: Hess, M., Koepke, P., and Schult, I.: Optical Properties of
A high-resolution AGCM study, J. Geophys. Res.-Atmos., 120, Aerosols and Clouds: The Software Package OPAC, B. Am.
4564–4584, https://doi.org/10.1002/2015JD023122, 2015. Meteorol. Soc., 79, 831–844, https://doi.org/10.1175/1520-
Brühl, C., Schallock, J., Klingmüller, K., Robert, C., Bingen, C., 0477(1998)0792.0.CO;2, 1998.
Clarisse, L., Heckel, A., North, P., and Rieger, L.: Stratospheric Huneeus, N., Schulz, M., Balkanski, Y., Griesfeller, J., Prospero,
aerosol radiative forcing simulated by the chemistry climate J., Kinne, S., Bauer, S., Boucher, O., Chin, M., Dentener, F.,
model EMAC using Aerosol CCI satellite data, Atmos. Chem. Diehl, T., Easter, R., Fillmore, D., Ghan, S., Ginoux, P., Grini,
Phys., 18, 12845–12857, https://doi.org/10.5194/acp-18-12845- A., Horowitz, L., Koch, D., Krol, M. C., Landing, W., Liu,
2018, 2018. X., Mahowald, N., Miller, R., Morcrette, J.-J., Myhre, G., Pen-
Clarke, L. E., Edmonds, J. A., Jacoby, H. D., Pitcher, H. M., Reilly, ner, J., Perlwitz, J., Stier, P., Takemura, T., and Zender, C. S.:
J. M., and Richels, R. G.: Scenarios of Greenhouse Gas Emis- Global dust model intercomparison in AeroCom phase I, At-
sions and Atmospheric Concentrations. Sub-report 2.1A of Syn- mos. Chem. Phys., 11, 7781–7816, https://doi.org/10.5194/acp-
thesis and Assessment Product 2.1 by the U.S. Climate Change 11-7781-2011, 2011.
Science Program and the Subcommittee on Global Change Re- IPCC: Climate Change 2013 – The Physical Science Ba-
search, Department of Energy, Office of Biological & Environ- sis, Cambridge University Press, cambridge Books Online,
mental Research, Washington, D.C., USA, 154 pp., 2007. https://doi.org/10.1017/CBO9781107415324, 2014.
Dentener, F., Kinne, S., Bond, T., Boucher, O., Cofala, J., Gen- Jöckel, P., Sander, R., Kerkweg, A., Tost, H., and Lelieveld, J.:
eroso, S., Ginoux, P., Gong, S., Hoelzemann, J. J., Ito, A., Technical Note: The Modular Earth Submodel System (MESSy)
Marelli, L., Penner, J. E., Putaud, J.-P., Textor, C., Schulz, M., – a new approach towards Earth System Modeling, Atmos.
van der Werf, G. R., and Wilson, J.: Emissions of primary Chem. Phys., 5, 433–444, https://doi.org/10.5194/acp-5-433-
aerosol and precursor gases in the years 2000 and 1750 pre- 2005, 2005.
scribed data-sets for AeroCom, Atmos. Chem. Phys., 6, 4321– Jöckel, P., Kerkweg, A., Pozzer, A., Sander, R., Tost, H., Riede,
4344, https://doi.org/10.5194/acp-6-4321-2006, 2006. H., Baumgaertner, A., Gromov, S., and Kern, B.: Development
Dietmüller, S., Jöckel, P., Tost, H., Kunze, M., Gellhorn, C., cycle 2 of the Modular Earth Submodel System (MESSy2),
Brinkop, S., Frömming, C., Ponater, M., Steil, B., Lauer, A., Geosci. Model Dev., 3, 717–752, https://doi.org/10.5194/gmd-3-
and Hendricks, J.: A new radiation infrastructure for the Mod- 717-2010, 2010.
ular Earth Submodel System (MESSy, based on version 2.51), Karydis, V. A., Tsimpidi, A. P., Lei, W., Molina, L. T., and Pandis,
Geosci. Model Dev., 9, 2209–2222, https://doi.org/10.5194/gmd- S. N.: Formation of semivolatile inorganic aerosols in the Mexico
9-2209-2016, 2016. City Metropolitan Area during the MILAGRO campaign, Atmos.
Feng, Y. and Penner, J. E.: Global modeling of nitrate Chem. Phys., 11, 13305–13323, https://doi.org/10.5194/acp-11-
and ammonium: Interaction of aerosols and tropo- 13305-2011, 2011.
spheric chemistry, J. Geophys. Res.-Atmos., 112, D01304, Karydis, V. A., Tsimpidi, A. P., Pozzer, A., Astitha, M., and
https://doi.org/10.1029/2005JD006404, 2007. Lelieveld, J.: Effects of mineral dust on global atmospheric
Fountoukis, C. and Nenes, A.: ISORROPIA II: a computa- nitrate concentrations, Atmos. Chem. Phys., 16, 1491–1509,
tionally efficient thermodynamic equilibrium model for https://doi.org/10.5194/acp-16-1491-2016, 2016.
2−
K+ −Ca2+ −Mg2+ −NH+ + −
4 −Na −SO4 −NO3 −Cl −H2 O
− Karydis, V. A., Tsimpidi, A. P., Bacer, S., Pozzer, A., Nenes, A.,
aerosols, Atmos. Chem. Phys., 7, 4639–4659, and Lelieveld, J.: Global impact of mineral dust on cloud droplet
https://doi.org/10.5194/acp-7-4639-2007, 2007. number concentration, Atmos. Chem. Phys., 17, 5601–5621,
Ghan, S. J., Liu, X., Easter, R. C., Zaveri, R., Rasch, P. J., Yoon, J.- https://doi.org/10.5194/acp-17-5601-2017, 2017.
H., and Eaton, B.: Toward a Minimal Representation of Aerosols Kerkweg, A., Buchholz, J., Ganzeveld, L., Pozzer, A., Tost, H., and
in Climate Models: Comparative Decomposition of Aerosol Di- Jöckel, P.: Technical Note: An implementation of the dry removal
rect, Semidirect, and Indirect Radiative Forcing, J. Climate, 25, processes DRY DEPosition and SEDImentation in the Modu-
6461–6476, https://doi.org/10.1175/JCLI-D-11-00650.1, 2012. lar Earth Submodel System (MESSy), Atmos. Chem. Phys., 6,
Ginoux, P., Prospero, J. M., Gill, T. E., Hsu, N. C., and 4617–4632, https://doi.org/10.5194/acp-6-4617-2006, 2006a.
Zhao, M.: Global-scale attribution of anthropogenic and nat- Kerkweg, A., Sander, R., Tost, H., and Jöckel, P.: Technical note:
ural dust sources and their emission rates based on MODIS Implementation of prescribed (OFFLEM), calculated (ONLEM),
and pseudo-emissions (TNUDGE) of chemical species in the
Atmos. Chem. Phys., 19, 7397–7408, 2019 www.atmos-chem-phys.net/19/7397/2019/K. Klingmüller et al.: Direct radiative effect of dust–pollution interactions 7407 Modular Earth Submodel System (MESSy), Atmos. Chem. Atmos. Chem. Phys., 6, 2549–2567, https://doi.org/10.5194/acp- Phys., 6, 3603–3609, https://doi.org/10.5194/acp-6-3603-2006, 6-2549-2006, 2006. 2006b. Metzger, S., Steil, B., Abdelkader, M., Klingmüller, K., Xu, L., Pen- Kirchstetter, T. W., Novakov, T., and Hobbs, P. V.: Evidence that ner, J. E., Fountoukis, C., Nenes, A., and Lelieveld, J.: Aerosol the spectral dependence of light absorption by aerosols is af- water parameterisation: a single parameter framework, Atmos. fected by organic carbon, J. Geophys. Res.-Atmos., 109, 21208, Chem. Phys., 16, 7213–7237, https://doi.org/10.5194/acp-16- https://doi.org/10.1029/2004JD004999, 2004. 7213-2016, 2016. Klingmüller, K.: Direct radiative effect of dust-pollution interac- Osipov, S. and Stenchikov, G.: Simulating the Regional tions – simulation data, available at: https://edmond.mpdl.mpg. Impact of Dust on the Middle East Climate and the de/imeji/collection/q9cra0NE3K6ayHG, last access: 29 May Red Sea, J. Geophys. Res.-Oceans, 123, 1032–1047, 2019. https://doi.org/10.1002/2017JC013335, 2018. Klingmüller, K., Steil, B., Brühl, C., Tost, H., and Lelieveld, J.: Sen- Osipov, S., Stenchikov, G., Brindley, H., and Banks, J.: Diurnal sitivity of aerosol radiative effects to different mixing assump- cycle of the dust instantaneous direct radiative forcing over tions in the AEROPT 1.0 submodel of the EMAC atmospheric– the Arabian Peninsula, Atmos. Chem. Phys., 15, 9537–9553, chemistry–climate model, Geosci. Model Dev., 7, 2503–2516, https://doi.org/10.5194/acp-15-9537-2015, 2015. https://doi.org/10.5194/gmd-7-2503-2014, 2014. Pozzer, A., de Meij, A., Pringle, K. J., Tost, H., Doering, U. M., van Klingmüller, K., Pozzer, A., Metzger, S., Stenchikov, G. Aardenne, J., and Lelieveld, J.: Distributions and regional bud- L., and Lelieveld, J.: Aerosol optical depth trend over gets of aerosols and their precursors simulated with the EMAC the Middle East, Atmos. Chem. Phys., 16, 5063–5073, chemistry-climate model, Atmos. Chem. Phys., 12, 961–987, https://doi.org/10.5194/acp-16-5063-2016, 2016. https://doi.org/10.5194/acp-12-961-2012, 2012. Klingmüller, K., Metzger, S., Abdelkader, M., Karydis, V. A., Pringle, K. J., Tost, H., Message, S., Steil, B., Giannadaki, D., Stenchikov, G. L., Pozzer, A., and Lelieveld, J.: Revised min- Nenes, A., Fountoukis, C., Stier, P., Vignati, E., and Lelieveld, J.: eral dust emissions in the atmospheric chemistry–climate model Description and evaluation of GMXe: a new aerosol submodel EMAC (MESSy 2.52 DU_Astitha1 KKDU2017 patch), Geosci. for global simulations (v1), Geosci. Model Dev., 3, 391–412, Model Dev., 11, 989–1008, https://doi.org/10.5194/gmd-11-989- https://doi.org/10.5194/gmd-3-391-2010, 2010a. 2018, 2018. Pringle, K. J., Tost, H., Metzger, S., Steil, B., Giannadaki, D., Koepke, P., Gasteiger, J., and Hess, M.: Technical Note: Optical Nenes, A., Fountoukis, C., Stier, P., Vignati, E., and Lelieveld, properties of desert aerosol with non-spherical mineral parti- J.: Corrigendum to “Description and evaluation of GMXe: a cles: data incorporated to OPAC, Atmos. Chem. Phys., 15, 5947– new aerosol submodel for global simulations (v1)” published in 5956, https://doi.org/10.5194/acp-15-5947-2015, 2015. Geosci. Model Dev., 3, 391–412, 2010, Geosci. Model Dev., 3, Kok, J. F., Ridley, D. A., Zhou, Q., Miller, R. L., Zhao, 413–413, https://doi.org/10.5194/gmd-3-413-2010, 2010b. C., Heald, C. L., Ward, D. S., Albani, S., and Haustein, Raes, F. and Van Dingenen, R.: Simulations of condensation K.: Smaller desert dust cooling effect estimated from analy- and cloud condensation nuclei from biogenic SO2 in the re- sis of dust size and abundance, Nat. Geosci., 10, 274–278, mote marine boundary layer, J. Geophys. Res., 97, 12901, https://doi.org/10.1038/ngeo2912, 2017. https://doi.org/10.1029/92JD00961, 1992. Lauer, A., Eyring, V., Hendricks, J., Jöckel, P., and Lohmann, U.: Randerson, J., van der Werf, G., Giglio, L., Collatz, G., and Global model simulations of the impact of ocean-going ships on Kasibhatla, P.: Global Fire Emissions Database, Version 3 aerosols, clouds, and the radiation budget, Atmos. Chem. Phys., (GFEDv3.1), https://doi.org/10.3334/ORNLDAAC/1191, 2013. 7, 5061–5079, https://doi.org/10.5194/acp-7-5061-2007, 2007. Ridley, D. A., Heald, C. L., Kok, J. F., and Zhao, C.: An ob- Lelieveld, J., Evans, J. S., Fnais, M., Giannadaki, D., and Pozzer, servationally constrained estimate of global dust aerosol A.: The contribution of outdoor air pollution sources to pre- optical depth, Atmos. Chem. Phys., 16, 15097–15117, mature mortality on a global scale, Nature, 525, 367–371, https://doi.org/10.5194/acp-16-15097-2016, 2016. https://doi.org/10.1038/nature15371, 2015. Rothman, L. S., Jacquemart, D., Barbe, A., Chris Benner, D., Levin, Z., Ganor, E., and Gladstein, V.: The Effects of Birk, M., Brown, L. R., Carleer, M. R., Chackerian, C., Desert Particles Coated with Sulfate on Rain For- Chance, K., Coudert, L. H., Dana, V., Devi, V. M., Flaud, J.- mation in the Eastern Mediterranean, J. Appl. Me- M., Gamache, R. R., Goldman, A., Hartmann, J.-M., Jucks, teorol., 35, 1511–1523, https://doi.org/10.1175/1520- K. W., Maki, A. G., Mandin, J.-Y., Massie, S. T., Orphal, J., 0450(1996)0352.0.CO;2, 1996. Perrin, A., Rinsland, C. P., Smith, M. A. H., Tennyson, J., Levine, J.: 5.5 – Biomass Burning: The Cycling of Gases Tolchenov, R. N., Toth, R. A., Vander Auwera, J., Varanasi, and Particulates from the Biosphere to the Atmosphere, in: P., and Wagner, G.: The HITRAN 2004 molecular spec- Treatise on Geochemistry (Second Edition), edited by: Hol- troscopic database, J. Quant. Spectrosc. Ra., 96, 139–204, land, H. D. and Turekian, K. K., Elsevier, Oxford, 139–150, https://doi.org/10.1016/j.jqsrt.2004.10.008, 2005. https://doi.org/10.1016/B978-0-08-095975-7.00405-8, 2014. Sander, R., Baumgaertner, A., Gromov, S., Harder, H., Jöckel, P., MESSy 2018: MESSy submodel list, available at: http://www. Kerkweg, A., Kubistin, D., Regelin, E., Riede, H., Sandu, A., messy-interface.org/current/auto/messy_submodels.html, last Taraborrelli, D., Tost, H., and Xie, Z.-Q.: The atmospheric chem- access: 1 April 2018. istry box model CAABA/MECCA-3.0, Geosci. Model Dev., 4, Metzger, S., Mihalopoulos, N., and Lelieveld, J.: Importance of 373–380, https://doi.org/10.5194/gmd-4-373-2011, 2011. mineral cations and organics in gas-aerosol partitioning of re- Stier, P., Feichter, J., Kinne, S., Kloster, S., Vignati, E., Wilson, J., active nitrogen compounds: case study based on MINOS results, Ganzeveld, L., Tegen, I., Werner, M., Balkanski, Y., Schulz, M., www.atmos-chem-phys.net/19/7397/2019/ Atmos. Chem. Phys., 19, 7397–7408, 2019
You can also read