Understanding site speed, the biggest factors that impact performance and how to optimise these areas to create a better experience for the user.
←
→
Page content transcription
If your browser does not render page correctly, please read the page content below

DEEPCRAWL’S
ULTIMATE GUIDE
TO SITE SPEED &
PERFORMANCE
Understanding site speed, the biggest
factors that impact performance and how
to optimise these areas to create a better
experience for the user.

Contents
The importance of site speed                     04

   Site speed and the user                       04

   Site speed and conversions                    06

   Site speed and SEO                            07

How to measure site speed and performance        09

  Where loading happens                          10

        Server-side                              10

        Client-side                              11

  The key performance metrics explained          12

  The full journey of a page loading             20

  Artificial vs real world measurement           22

The most important site speed metrics            25

  Which metrics matter most for the user?        25

  What are Google’s site speed considerations?   27

      Advancements in Lighthouse                 28
Best practice guidelines for site speed optimisation       29

  The quickest wins for performance optimisation           30

  The most common issues that impact speed                 31

      JavaScript                                           31

      Images                                               32

      Code file size                                       35

      Web fonts                                            36

      Redirects                                            37

Mobile speed and performance                               38

   Google’s ‘Speed Update’ and mobile rankings             39

   AMP                                                     40

A user-centric approach to site speed improvement          41

   Prioritising speed optimisation where it matters most   42

      What the user can see now                            42

      Where the user will go next                          44

Conclusion                                                 45
The importance
of site speed
One topic that keeps cropping up in the
digital marketing industry, is speed. Whether
your aim is to have a faster site than your
competitors, to provide more immediate
answers for users, or to reduce bounce rate
and abandonment from customers who don’t
have time to wait for your site to load; site
speed and performance is a topic that
catches everyone’s attention.

Site speed and the user
All performance optimisation initiatives
should be tailored to the biggest pain points
your users face on your site. The first ideas
that might come to mind could be around
fixing an unclear navigation or a poorly
designed product page template. However,                                                   OPTIMISATION
before any of that can matter to the user,
they have to be able to load and access your                                                   NEEDS TO
site in the first place. Optimisation needs to
start with speed.
                                                                                             START WITH
                                                                                                  SPEED
Think about it, what value can a user gain
from your site before a page has actually
loaded? This is why site speed is the number
one issue in the user experience hierarchy.

                                                                  75%       The speed it takes to load the page

                                                                  66%        How easy it is to find what I’m looking for

                                                                  61%        How well the site fits my screen

                                                                  58%        How simple the site is to use

                                                                  24%        How attractive the site looks

                                        I M AG E S O U R C E : G O O G L E I / O 2 0 1 8

                                                                                                                           04
From Google’s Answer Boxes, to voice assistants like
                                                      Alexa and Siri; we have learned to expect instantaneous
     As technology continues                          answers. When we, as users, have to wait for anything
     advancing and we have                            now, that stands out and causes stress. Yes, actual stress.
     access to immediate
     answers on more devices,                         A study was done to calculate the levels of stress induced
     our society continues to                         in people through a variety of different day-to-day
     lose patience. Wait times                        experiences. The results showed that the levels of stress
     aren’t an option anymore.                        while watching a horror movie were comparable to
                                                      those experienced when faced with things loading
                                                      slowly on a mobile.

                                               Solving a math problem

                                          Experiencing mobile delays

                                             Watching a horror movie

                                 Standing at the edge of a vertical cliff

                                   Watching a melodramatic TV show

                                         Waiting in line at a retail store

                                         I M AG E S O U R C E : B A S T I A N G R I M M , S E A R C H L E E D S 2 0 1 8

                                                      Take a look at the full mobile report from Ericsson here.

"It's easy to predict the websites that are going to be successful

online: it's the ones that take load speed seriously. Failure to

optimise for speed means you don't care about user experience. And

that is symptomatic of a broader attitude towards your customers. If

you genuinely care about your customers, you have to make sure

your site loads as fast as you can possibly make it."

    Barry Adams,
    Founder of Polemic Digital

                                                                                                                          05
Site speed                                                                        of visit are abandoned if a
and conversions
                                                       53%                        mobile site takes longer
                                                                                  than 3 seconds to load.
A slow-loading site is a real pain point for
users, which you can attribute back to the
performance of your website and your business
                                                            I M AG E S O U R C E : T H I N K W I T H G O O G L E
as a whole. Users who face issues when
accessing your site will simply abandon it and
take their money elsewhere. This is definitely
the story the data tells:

I M AG E S O U R C E : T H I N K W I T H G O O G L E                    MOBILE PAGE LOAD TIMES

  1s to 3s the probability of bounce increases 32%

  1s to 5s the probability of bounce increases 90%

  1s to 6s the probability of bounce increases 106%

  1s to 10s the probability of bounce increases 123%

If there were any
doubts out there
about the importance
of investing in site
speed optimisation,
these graphs should
have helped to clear
those up.
                                                       I M AG E S O U R C E : B R A N D E D 3

                                                                                                                   06
“When you get people to your site, you want to get your

    money back out of them after you’ve invested all this money

    getting them there through your SEO efforts.”

         Patrick Meenan,
         Google Chrome Engineer

    A SLOW LOADING SITE WILL LOSE YOU CUSTOMERS
    AND MONEY. SITE SPEED AND CONVERSIONS HAVE
    BEEN PROVEN TO BE DIRECTLY CORRELATED, SO
    FOCUS ON SPEEDING UP YOUR SITE.

    Site speed and SEO

    SEOs have more to worry about than user                                       Learn more with our mobile-first indexing
    experience and conversions when thinking                                      white paper.
    about the impact of speed. A slow loading site
    can also cost you in terms of rankings, crawl                                 Some of the things that Google will take into
    budget and crawl rate.                                                        consideration when assessing site speed are
                                                                                  loading and rendering times, because these
    Site speed, which “reflects how quickly a                                     give a more accurate picture of how users
    website responds to web requests,” has been                                   experience speed.
    confirmed to be a ranking factor by Google.              1

    This has predominantly been focused on                                        “Google Uses Time Taken to Load and
    desktop pages but will be a consideration for
                                                                                  Render to Assess Page Speed”
    mobile pages as Google’s mobile-first indexing
    continues rolling out, where mobile pages will                                       John Mueller,
    be indexed as a priority.                                                            Google Webmaster Hangout
                                                                                                                  2

                                                                                                                                           07
1   Google Webmaster Central Blog, https://webmasters.googleblog.com/2010/04/using-site-speed-in-web-search-ranking.html, 9th April 2010

2   Deeply Notes, https://www.deepcrawl.com/blog/news/google-webmaster-hangout-notes-january-12th-2018/#link8, 12th January 2018
Google also takes note of your server’s
    performance and will crawl considerately.
    This means the search engine will slow                                                         “Google Limits Crawl Frequency of
    down crawling your site if your pages take a                                                            Slow Loading Pages”
    while to respond and will even come back
                                                                                                                JOHN MUELLER,
    to your site less frequently to avoid                                                             GOOGLE WEBMASTER HANGOUT
                                                                                                                                  3

    overloading your server.

    SITE SPEED AND RESPONSE TIMES AFFECT THE
    RATE AND FREQUENCY AT WHICH GOOGLE WILL TRY
    TO CRAWL YOUR WEBSITE.

When exploring Google’s crawl rate and efficiency, the best place to look is your site’s fetch time. This is
because the time in which Google can fetch your pages decides how your site will be crawled. At
DeepCrawl, we provide URL fetch time data among our Performance reports. This means you can see which
of your pages are slow to be fetched, among other issues.

3   Deeply Library, https://www.deepcrawl.com/blog/news/google-webmaster-hangout-notes-august-2nd-2017/#link16, 2nd August 2017        08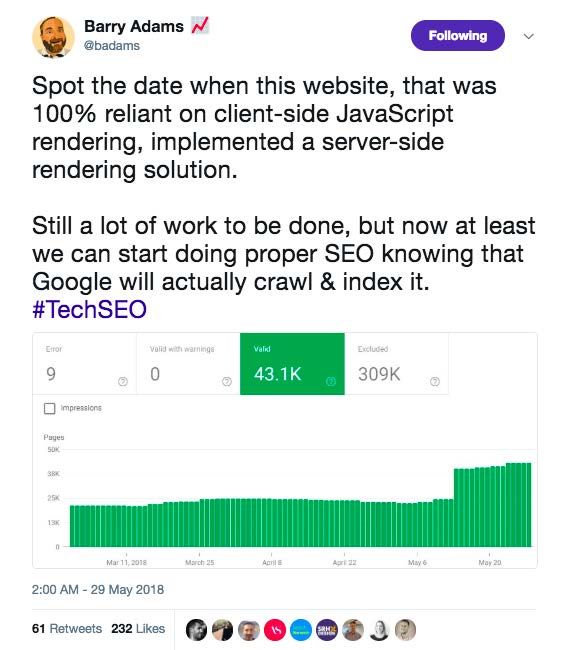
Jono Alderson,
          Mad Scientist at Yoast

"Site speed and performance should be your number one
priority for 2018, because making meaningful improvements to
performance forces you to improve everything about your
site.

Getting below 2s often requires that you improve so many
areas of your site - from your server setup to your mobile UX,
to the cookies you set, to how you manage JavaScript and
ads, and beyond. It forces you to do some serious spring-
cleaning and tackle built-up technical debt.

When you really invest in sorting out your slow, clunky,
unwieldy website, you can compete on performance. Because
by then, not only is your website fast, it's also well-structured,
free of errors, responsive, easier to read and navigate, and
easier to convert on.

You'll find that, on that journey, you'll fix your entire business."

How to measure site
speed and performance
It is vital to improve site speed and performance for user experience. In order to do this you’ll need to know
the state of your site as well as which metrics you need to analyse. To understand where potential
roadblocks for site speed could lie, let’s start by looking at the process of website loading.

                                                                                                                 09
Where loading happens                                                             “Front-end scripting is good for
                                                                                      anything that requires user interaction,
    For web scripts, there is a clear split between
                                                                                      such as a simple game. Back-end
    where they run and whose job it is to handle
    them. They either run server-side, which, as the                                  scripting is good for anything that
    name suggests, is the server that hosts the site                                  requires dynamic data to be loaded,
    on the back-end, or they run client-side, which
                                                                                      such as a notice that tells the user
    is the browser where the user accesses the site
    on the front-end.                                                                 they’re logged in.”

                                                                                          Code Conquest
                                                                                                                     4

    Server-side

    Server-side languages are loaded first before                                  Here are some examples of server-side
    anything else happens. All of this work is done                                languages:
    behind the scenes on the hosting server, and
    the browser will make a request to the server                                           PHP                      C#
    for the website’s content afterwards. Each time                                         Ruby                     Python
    a page is accessed, where a cached version                                              ASP.NET
    isn’t available, a request will be made to the
    server and the page will be rendered in full.

    P E R F O R M A N C E I M PAC T:                                               BENEFITS

    Server-side performance depends on factors                                     Server-side rendering “is great for SEO”,
    such as the server’s location, how many sites it                               because “your content is present before you
    is hosting (if it’s a shared server), how many                                 get it, so search engines are able to index it
    users are trying to access it at any given time,                               and crawl it just fine.” Also, the more the
                                                                                                                 5

    and the server hardware and its capabilities,                                  server loads, the less work the browser and
    especially memory, HDD (Hard Disk Drive)                                       the user’s device need to do which can be
    storage and CPU (Central Processing Unit)                                      great for speed improvements.
    power.

    Also, server-side rendering may provide
    visuals quicker, but users can be left trying to
    interact with a page without success as the
    browser hasn’t yet rendered the required
    elements.

4   Code Conquest, https://www.codeconquest.com/website/client-side-vs-server-side/

5   FreeCodeCamp, https://medium.freecodecamp.org/what-exactly-is-client-side-rendering-and-hows-it-different-from-server-side-rendering-   10
    bd5c786b340d, 28th February 2017
Client-side
Client-side languages can cause noticeable Here are some examples of client-side
performance issues because these are the languages:
ones that run on a user’s device after a page
has been loaded. The server has done all it can HTML
with the initial request and response, and CSS
handling the rest of the experience is down to JavaScript (including frameworks such as
the browser. Client-side languages are most Angular.js, Vue.js and React.js)
useful for anything involving user interactivity.
P E R F O R M A N C E I M PAC T: BENEFITS
Hardware limitations of the user’s device come When rendering happens in the browser, this
into play with client-side rendering. The CPU of puts less of a strain on the server because you
the average mobile is very small compared to have to make fewer requests to load entire
desktop which means it can take a long time to pages. There is also more scope for creating
load scripts like heavy JavaScript. SEO interactive, engaging elements for users.
performance can also take a hit because with
this setup content being visible depends on
the browser, so the search engines may
struggle to see client-side-rendered content.
As the web becomes more interactive,
client-side rendering is becoming more
prominent. However, we need to be
aware of the crawling and speed issues
that come with it.
The key things to look out for and consider here
for both rendering methods are too many
server requests, and whether content can be
rendered client-side.
I M AG E S O U R C E : T W I T T E R
11The key performance
metrics explained
Once you look beyond aggregated, simplified Site speed isn’t as simple as having an
scores provided in page speed tools, you will A grade, or an 85% score. You need to
start to see just how many site speed metrics
look at the entire picture: what are the
there are to wrap your head around. With so
many different acronyms like TTFB and FCP actual metrics that make up your site’s
being thrown around, it can be easy to get lost. performance?
We’ve put together a list of the site speed metrics and
definitions you need to know about, as well as what they
mean and measure:
1 Server Response Time 10 Visually Complete (VC)
2 Time To First Byte (TTFB) 11 First Interactive
3 DOM Interactive 12 Time To Interactive (TTI)
4 DOM Content Loaded 13 First Input Delay (FID)
5 First Paint 14 Consistently Interactive
6 First Contentful Paint (FCP) 15 Long Tasks
7 First Meaningful Paint (FMP) 16 Page Load Time
8 Hero Element 17 Fully Loaded
9 Speed Index
121
Server Response Time
Measures the time needed for the required
HTML to be loaded for the server to then start
rendering it. Server Response Time looks at
back-end latency.
“Highly variable server response time
may indicate an underlying
performance issue.”
Google PageSpeed Tools
6
“TTFB helps enterprises identify weak
points in the connection process.”
MaxCDN
7
2
Time To First Byte (TTFB)
Measures the time taken between the client
making a request to the server and then
receiving the first byte of data in the browser.
This metric provides an overall view of server-
to-client responsiveness.
6
7
8
3
DOM Interactive
Measures the point when the DOM (Document
Object Model) has been constructed by parsing
all of the HTML and is ready.
“The DOM represents the
document” (or page) “as nodes and
objects. That way, programming
languages can connect to the page.”
MaxCDN, https://www.maxcdn.com/one/visual-glossary/time-to-first-byte/, 13th May 2016
MDN
8
Google PageSpeed Tools Insights, https://developers.google.com/speed/docs/insights/Server, 9th January 2018
MDN, https://developer.mozilla.org/en-US/docs/Web/API/Document_Object_Model/Introduction, 2nd April 2018
134
DOM Content Loaded
Measures the time taken for the initial HTML
document and the content of the DOM to be
fully loaded and parsed, except for elements
like images and iframes, for example.
In the last two years, DOM Content Loaded has
gone down on desktop but has seen a rise on
mobile.
“One of the main reasons we've
historically optimized for metrics like
load and DOMContentLoaded is
because they're exposed as events in
the browser and easy to measure on
real users.”
Google Developers
9
5
“First Paint is triggered when a render
First Paint
– any render – is detected in the
When the browser starts to render the page
browser. This could be something as
and shows the first hint of content on the
subtle and uninformative as a change screen. This is a good front-end benchmark of
when a page appears to be starting to load.
in background colour.”
GTmetrix
10
14
9 Google Developers, https://developers.google.com/web/fundamentals/performance/user-centric-performance-metrics, 7th February 2018
10 GTmetrix, https://gtmetrix.com/blog/first-contentful-paint-explained/, 24th November 20176
First Contentful Paint (FCP)
When the browser renders the first element of
content defined in the DOM, such as some text,
an image or a section of navigation, for
example.
“This timing aims to be more
representative of your user’s
experience, as it flags when actual
content has been loaded in the page,
and not just any change.”
GTmetrix
11
“The time at which the user feels that
the primary content of the page is
visible.”
Google Developers
12
7
First Meaningful Paint (FMP)
Marks the time when the biggest change in the
above-the-fold layout has happened and the
most important elements of a page are visible,
such as your hero element.
First Paint First Contentful First Meaningful
(FP) Paint (FCP) Paint (FMP)
I M AG E S O U R C E : G O O G L E D E V E LO P E R S
GTmetrix, https://gtmetrix.com/blog/first-contentful-paint-explained/, 24th November 2017
15
11
12 Google Developers, https://developers.google.com/web/tools/lighthouse/audits/first-meaningful-paint, 8th March 20188
Hero Element
When the most important element or key
feature of your page has rendered and is
usable. For example, the Hero Element on
YouTube would be the main video you
want to watch.
“In the context of a single page or a
single application, it's generally best to
consider FMP to be the moment when
your hero elements are visible on the
screen.”
9
13
Google Developers
“A page load performance metric that
Speed Index
shows you how quickly the contents of
The score given to a page based on a variety of
a page are visibly populated.”
different speed metrics, which basically times
how long it takes to display the visible elements
15
Google Developers of a page in milliseconds. Google’s Patrick
Meenan defines this metric as a weighted
average of the paint timings and how long it
10
takes for content to be displayed to a user. 14
Visually Complete (VC) For Visually Complete, “content
"below the fold" and non-visual
When all above-the-fold content is visible in the
content (like third-party tracking
user’s browser. This will be when the user
perceives the page to be loaded, as everything
beacons) is excluded.”
within their viewport has been rendered.
16
Dynatrace
13 Google Developers, https://developers.google.com/web/fundamentals/performance/user-centric-performance-metrics, 7th February 2018
14 Patrick Meenan, https://www.youtube.com/watch?v=gDNK_61Fh0c, 6th December 2017
16
15 Google Developers, https://developers.google.com/web/tools/lighthouse/audits/speed-index, 8th March 2018
16 Dynatrace, https://www.dynatrace.com/support/doc/synthetic/reference-information/visually-complete-and-speed-index-metrics/, 4th June 201811 First Interactive
Measures the time when a page has
finished loading to the point that the user
is able to start minimally interacting with it.
“The page responds, on average, to
most user input in a reasonable amount
of time.”
Google Developers
17
12
“The time at which a page appears to
Time To Interactive (TTI)
be ready enough that a user can
Measures the point when a page is both visually
interact with it.”
rendered and able to respond to user actions or
input more reliably.
18
Google Developers
TTI measures how long the browser takes to respond to
interactivity, but the next metric measures how long the user
has to actually wait for this delay.
I M AG E S O U R C E : G O O G L E D E V E LO P E R S
Google Developers, https://developers.google.com/web/tools/lighthouse/audits/first-interactive, 14th December 2017
17
17
18 Google Developers, https://developers.google.com/web/tools/lighthouse/audits/time-to-interactive, 8th March 201813
First Input Delay (FID)
This metric was released by Google to take
user experience measurement one step further
and look at interactivity in more detail.
This chart shows that the browser can’t respond
to input until the main thread has finished
loading elements like CSS and JavaScript, so
this is where FID comes in to measure the gap
between the user’s readiness and the
browser’s readiness.
Browser receives Browser can respond
first user input to the first user input
FID
I M AG E S O U R C E : G O O G L E D E V E LO P E R S
“First Input Delay (FID) measures the time from when a user first interacts with your site
(i.e. when they click a link, tap on a button, or use a custom, JavaScript-powered control)
to the time when the browser is actually able to respond to that interaction.”
Google Developers 19
19 Google Developers, https://developers.google.com/web/updates/2018/05/first-input-delay, 15th May 2018
1814 Consistently Interactive
Measures the time taken until the page
can always be expected to be responsive
to a user’s input and interactivity.
“The Consistently Interactive metric
measures when a page is fully
interactive”
Google Developers
20
“To the user this appears as lag or jank,
and it's a major source of bad
experiences on the web today.”
Google Developers
21
15 Long Tasks
These occur when a user is interacting with the
browser and adding input which all has to be
added to a queue on the main thread, because
each task has to executed one at a time.
16
Page Load Time “There are many different factors that
affect page load time. [...] The hosting
This is a broad metric that measures the time it
server, amount of bandwidth in transit,
takes for the entire content of a web page to be
downloaded and displayed in the browser.
and web page design - as well as the
number, type and weight of elements
on the page. Other factors include user
location, device and browser type.”
22
MaxCDN
20 Google Developers, https://developers.google.com/web/tools/lighthouse/audits/consistently-interactive, 14th December 2017
21 Google Developers, https://developers.google.com/web/fundamentals/performance/user-centric-performance-metrics#long_tasks
19
22 MaxCDN, https://www.maxcdn.com/one/visual-glossary/page-load-time/, 3rd June 201617
Fully Loaded “is measured as the time
Fully Loaded
from the start of the initial navigation
Marks the point when the page has until there was 2 seconds of no
finished loading, including content, images
network activity after Document
and any activity triggered by JavaScript on
the main page.
Complete.”
23
WebPagetest
The full journey of a
page loading
To demonstrate how these metrics work in
the context of a page loading for a user, here
are some charts showing the process in
action:
23 WebPagetest Documentation, https://sites.google.com/a/webpagetest.org/docs/using-webpagetest/metrics 20A waterfall chart is a great way of visualising the page load process and all the different
elements involved, and it allows you to quickly spot the biggest problem areas across each
resource at each stage of the loading journey. It also helps you visualise dependencies and
loading priorities. Get one for your site from tools like GTmetrix or WebPagetest.
21Artificial vs Real World
Measurement
Now that we’ve looked at the metrics that make up a page’s performance, let’s think about how you would
go about testing them. Site speed measurement is often split into two main methods: Synthetic Testing
which is performed in a lab environment, or Real User Measurement (RUM) which monitors actual user
experiences as they happen in the real world.
Here are some of the main pros, cons and metrics for each of these methods.
SYNTHETIC REAL USER
TESTING: MEASUREMENT (RUM):
Stable - more detailed and reliable Actual performance - although this is
measurements which is good for highly variable and changes depending
competitor benchmarking on the person, device, location etc
Requires “representative” configuration - Limited competitive analysis - it’s difficult
in the way that one persona represents a to do benchmarking
variety of different people
The key metrics - First (Contentful) Paint,
The key metrics - First Contentful Paint, First Interactive
Speed Index, First Interactive
The tools - Google Analytics, mPulse,
The tools - Lighthouse, WebPagetest, New Relic
GTmetrix, Pingdom
Consistent stable baseline Shows you exactly how users engage on
your site
Can measure and compare any website
Large sample size
Fetailed analysis of assets
Real network and browser conditions
Video recording and film strips of the UX
Geographic spread
Waterfall charts
Conversion & KPI correlation with
performance metrics
Limited sample size Requires Javascript installed
Limited geography Limited performance metrics
Datacentre based so average network No detailed analysis of assets
conditions are mimicked
No performance waterfall charts
I M AG E S O U R C E : M A R Í A C A M A Ñ E S F O R É S , B R I G H T O N S E O 2 0 1 8
22Having a stable set of performance data to
be able to compare against your competitors
may sound great for setting benchmarks and Lab testing can give a baseline
baselines. However, some of the most idea of site performance, but
meaningful optimisation work you can do will without real world testing you’re
be for your actual users, so measure missing the heart of what
performance for them in the first place. measurement should be about:
the user and their pain.
To help reduce some of the many possible
user variables for RUM testing, you should
select some real world profiles or personas
to test. Here are some example groups
24
Patrick Meenan recommends looking into:
“My site isn’t that slow” Slow users under-represented
25
CrUX effective connection type Median and 99+ percentile
GA and RUM connection info
The Google team gave a good explanation of the importance of RUM when discussing why two similar
interactivity metrics are used, TTI and FID:
“TTI is a metric that can be measured without any users present, which means it's ideal for
lab environments. [...] Unfortunately, lab metrics, by their very nature, cannot measure real
user pain.
FID, on the other hand, directly represents user pain—every single FID measurement is an
instance of a user having to wait for the browser to respond to an event.
For these reasons we recommend both metrics, but we recommend you measure TTI in
lab and you measure FID in the wild, with your analytics tool.”
26
Google Developers
24 Patrick Meenan, https://www.slideshare.net/patrickmeenan/how-fast-is-it, 7th February 2018
25 Patrick Meenan, https://www.slideshare.net/patrickmeenan/how-fast-is-it
23
26 Google Developers, https://developers.google.com/web/updates/2018/05/first-input-delay, 15th May 2018With the launch of the Chrome User Experience report which shows actual Chrome user data for a large
27
collection of websites, it is now possible to benchmark performance against competitors with
measurements from real users rather than only being able to use lab testing for this. You can access this
data using BigQuery. Take a look at how this resource was used to compare user experience data between
Amazon and Walmart:
I M AG E S O U R C E : PAT R I C K M E E N A N , S M A S H I N G C O N F E R E N C E 2 0 1 8
Measurement should be an evolving process
that feeds into your SEO and performance
strategies. Ideally, this is how Google
recommends the entire journey of
performance optimisation should flow in
order to track and prevent any experience
regressions as you are testing and making
changes, with synthetic testing and RUM
being used together for the best possible
user experience:
I M AG E S O U R C E : G O O G L E D E V E LO P E R S
27 Google Developers, https://developers.google.com/web/tools/chrome-user-experience-report/, 31st May 2018 24The most important site
speed metrics
The next step is to prioritise the metrics that matter most. Priorities will vary depending on each business, its
website and customers, however, considering what matters most to users and search engines alongside your
own business will help you figure out what’s most important.
“Nothing should make the dev queue that isn't good for customers,
good for Google and good for business. Two of the above are not
enough. AMP only ticks one of these boxes - good for Google. But
speeding up the site you've spent years researching, creating and
optimising is win-win-win - and should be the absolute number one
thing on your priority list.”
Stephen Kenwright,
Strategy Director of Branded3
Which metrics matter most for the user?
To help you think about a user’s key
expectations and the metrics needed to
Specific back-end metrics like meet them, Google has a useful way of
TTFB won’t matter to the user; splitting out performance metrics depending
they only care about what is on where they feed into the user’s
happening on the screen in front experience. 28
of them in terms of what is visible
and usable.
28 Google Developers, https://developers.google.com/web/fundamentals/performance/user-centric-performance-metrics, 7th February 2018 251 “ I S I T H A P P E N I N G ? ”
When pixels are rendered to the screen, this is an
indication to a user that something is happening.
2 “ I S I T U S E F U L? ”
The most important elements of a page need to
be visible in order for a user to find it useful.
3 “ I S I T U S A B L E ? ”
A page must be able to handle input and
engagement before a user will consider it usable.
4 “ I S I T D E L I G H T F U L? ”
The user won’t have a positive experience if tasks
are being queued up and taking a long time to be
completed.
I M AG E S O U R C E : B A S T I A N G R I M M , S E A R C H L E E D S 2 0 1 8
It’s really important to analyse the right performance metrics and categorise them depending on which area
they feed into, whether it’s technical, visual or interactive. This is really helpful for narrowing your scope and
deciding what optimisation work to prioritise depending on your business’ focus area.
Technical metrics: Visual metrics: Interactive metrics:
Time To First Byte First Paint First Interactive
Server Response Time First Contentful Paint Time To Interactive
DOM Interactive First Meaningful Paint First Input Delay
DOM Content Loaded Speed Index Consistently Interactive
Page Load Time Visually Complete
Fully Loaded
26What are Google’s site speed considerations?
In the immediate future, you won’t have any
trouble from Google in terms of rankings
unless you have a really slow site.
Google wants us to take
more notice of speed
“Google Splits Sites With OK And
and site performance,
Very Slow Load Times”
because even if it isn’t a
John Mueller,
major ranking signal
Google Webmaster Hangout 29
yet, it is a major
problem for users now. However, it’s not all about Google’s current
algorithms. You can’t neglect performance
for your users, because they are the most
important judges of your website and its
worth. Your users are the ones that are going
to wait for your site to load and buy from you,
or not. This is becoming more and more
apparent as Google puts more of a focus on
measuring user experience.
If you ask Google which metrics you should
be looking into for performance
improvements, you will be advised to look
beyond individual factors and understand
how your site performs in the real world for
users.
This was confirmed in a tweet by Google
30
Webmaster Trends Analyst, John Mueller.
I M AG E S O U R C E : T W I T T E R
ASSESSING SITE SPEED AND PERFORMANCE BY LOOKING AT
INDIVIDUAL METRICS IS A MISREPRESENTATION OF REALITY;
RESULTS WILL ALWAYS VARY DEPENDING ON THE USER.
Deeply Library, https://www.deepcrawl.com/blog/news/google-webmaster-hangout-notes-august-22nd-2017/#link7, 22nd August 2017
27
29
30 John Mueller, https://twitter.com/JohnMu/status/998619204998836225, 21st May 2018This has also been demonstrated in the For any successful performance optimisation
updates Google has made to its PageSpeed work to be carried out, you need to have a
Insights tool to include more real world data clear understanding of how users actually
as part of optimisation scoring and access and experience your site. “What
31
recommendations. Google will also be device are they using?” “What are their
taking anonymised speed data from Chrome network conditions like?” These are the real
to factor into their speed calculations; which questions you need to be answering, instead
is yet another reason why optimising for of “How’s the PageSpeed Insights score
users is important. looking?”
Google did a great job of explaining this
point:
“Load is not a single moment in time—it's an experience that no one metric can fully
capture. There are multiple moments during the load experience that can affect whether a
user perceives it as "fast", and if you just focus on one you might miss bad experiences
that happen during the rest of the time.”
32
Google Developers
Advancements
in Lighthouse
To help you better capture
and analyse those bad
experiences, Google has
added a number of new
reports to its Lighthouse
tool to try and give us a
better understanding of
what’s happening client-
side.
28
31 Google Webmaster Central Blog, https://webmasters.googleblog.com/2018/01/real-world-data-in-pagespeed-insights.html, 10th January 2018
32 Google Developers, https://developers.google.com/web/fundamentals/performance/user-centric-performance-metrics, 7th February 2018These are some of the key reports to try out:
JavaScript Boot-up Time is High - “the total All Text Remains Visible During Web Font Loads
impact of JavaScript on your page's load - finds web fonts that are delaying text rendering 36
33
performance”
Optimize Images, Offscreen Images &
Unused JavaScript - “reveals JavaScript [that Oversized Images - these reports highlight
has been] downloaded by the current page, but different opportunities for improving image
34
is never used” performance
Use Video Formats for Animated Content - flags
If you want to learn how the Google team
GIFs over 100KB and gives guidance on how to
used Lighthouse to improve a website
35
convert and embed them
performance score from 23 to 91, read this
step by step guide.
A tip for making your case: If you
struggle to get buy-in to be able
to action any optimisation work,
correlate your data. Layer speed
Best practice and performance metrics with the
conversion metrics that matter
guidelines for most to your business to highlight
site speed
patterns in behaviour and where
those conversion metrics can
optimisation
actually be improved with the
work you plan to do.
We’ve put together some best practice
guidelines to help you with your performance
optimisation work, and to give you a better María Camañes Forés has some great tips on
understanding of the key areas to analyse if you championing performance work and getting
want to make your site quicker. buy-in, take a look at her slides.
33 Google Developers, https://developers.google.com/web/tools/lighthouse/audits/bootup, 15th February 2018
34 Google Developers, https://developers.google.com/web/updates/2018/05/lighthouse#unused_javascript, 15th May 2018
35 Google Developers, https://developers.google.com/web/updates/2018/05/lighthouse#use_video_formats_for_animated_content, 15th May 2018
36 Google Developers, https://developers.google.com/web/updates/2018/05/lighthouse#all_text_remains_visible_during_web_font_loads, 15th May 2018 29The quickest wins for
performance optimisation
When it comes to improving site speed, you’ll want to look for ‘low hanging fruit’
first. These are the opportunities that have minimal effort and high impact, and
also have the lowest risk of breaking anything… You’ll also want to look for
opportunities that will be the most effective.
1 Implement caching to reduce the size (and delay) of initial requests.
2 Focus on above-the-fold content, especially the hero element, and make
sure nothing is getting in the way of it loading, such as JavaScript.
3 Split up code (CSS or JS) into different files so it can be loaded separately
and in the order of highest to lowest priority, with the lowest priority files
being loaded asynchronously.*
4 Compress** and minify*** whatever HTML, CSS and JS you can where
necessary.
5 Inlining**** code is less expensive than creating external requests for
things such as critical CSS. (It also has the potential to create caching
issues, but the positives outweigh any negatives because it reduces the
number of requests.)
6 Move A/B testing and tag management using JavaScript to the back-end
so they’re being rendered server-side.
7 Look at performance on mobile vs desktop to see where the biggest
improvements need to be made, prioritise the device that most of your
customers are using.
8 Where performance improvements can’t be made, let users know what’s
going on within the interface so they know what to expect and when - this
may help with bounce rate.
*Asynchronous loading happens independently of the main program flow
without blocking it and preventing it to continue processing.
** Compression is needed to reduce the size of a requested file that is sent
back to the browser by the server, which is done by zipping.
*** Minification “refers to the process of removing unnecessary or redundant
data without affecting how the resource is processed by the browser.” 37
****Inline code “executes independently” and “is primarily used to provide a
functionality external to the primary program to which it is added.” 38
Google PageSpeed Tools Insights, https://developers.google.com/speed/docs/insights/MinifyResources, 9th January 2018
30
37
38 Techopedia, https://www.techopedia.com/definition/12859/inline-codeThe most common issues
that impact speed JavaScript
Each website is its own unique ecosystem JavaScript is often incredibly resource-
and the biggest performance opportunities intensive to load and serve to users. This
will vary for each one. However, there are makes it one of the biggest impacts on site
some fairly universal issues that have the speed.
biggest impact on speed. Let’s take a look at
some of the most common speed traps for a Here’s where JavaScript is costing you:
website.
CPU cost - JavaScript uses up a lot of CPU Execution cost - JavaScript is also executed on
power. the main thread. If your page runs a lot of code
before it's really needed, that also delays your
Network cost - more bytes equals longer Time To Interactive, which is one of the key
download times. metrics related to how users perceive your page
speed.
Parse and compile cost - JavaScript gets parsed
and compiled on the main thread. When the Memory cost - if your JavaScript holds on to a lot
main thread is busy, the page can't respond to of references, it can potentially consume a lot of
user input. memory. Pages appear slow when they
39
consume a lot of memory.
JavaScript is your most expensive To learn more about the impact of JavaScript,
take a look at the recap of the webinar we
asset because of the time and held with Bartosz Goralewicz of Elephate,
computing power it takes to execute including a full recording of the sessions and
notes on the key takeaways.
it. The average mobile will struggle
with JavaScript-heavy loading.
View our JavaScript webinar
39 Google Developers, https://developers.google.com/web/tools/lighthouse/audits/bootup, 15th February 2018 31TIPS ON IMPROVING JAVASCRIPT PERFORMANCE
1 Bundle Auditing:
Understand the purpose
and usefulness of your
grouped JavaScript files.
2 Splitting: Separate
JavaScript into sections
and only execute what a
user actually needs as and
when they’re navigating
your site.
3 Asynchronous Loading:
Keep resource-intensive
JavaScript from blocking
the main thread, especially
non-critical code.
4 Combine External Files:
This reduces the number of
HTTP requests you need to
send to the server for I M AG E S O U R C E : T W I T T E R
JavaScript files.
Images
40
Images are the biggest contributors to page weight, and, therefore, slow
loading sites. Not only can images be overly large in terms of their dimensions,
but they can also be overly large in terms of their file sizes, meaning more and
more time is being spent downloading and rendering them.
40 Search Engine Watch, https://searchenginewatch.com/2017/06/09/how-to-reduce-the-impact-of-images-on-your-mobile-site-speed/, 9th June 2017 32“Optimizing images can often yield some of the largest byte savings and performance
improvements: the fewer bytes the browser has to download, the less competition there is
for the client's bandwidth and the faster the browser can download and render content on
the screen.”
41
Google PageSpeed Tools
TIPS ON IMPROVING IMAGE PERFORMANCE
1 Compression: Reduce the size of an image file in terms of bytes
without degrading image quality - use tools like TinyJPG.
2 Specify Dimensions: This allows faster rendering and makes the
browser’s job easier as it can lay out the rest of the page while
images are loading.
3 Update Image Formats: Avoid using outdated image formats with
overly large file sizes such as .png, and use up to date formats like
WebP, JPEG-XR, FLIF or BPG.
4 Utilise a CDN: A CDN (Content Delivery Network) stores image files
on different servers around the world which increases loading speed
for users.
5 Lazy-loading: This defers loading of non-critical, below the fold
42
images, which will only be loaded when needed by the user.
41 Google PageSpeed Tools Insights, https://developers.google.com/speed/docs/insights/OptimizeImages, 9th January 2018
42 Google Developers, https://developers.google.com/web/fundamentals/performance/lazy-loading-guidance/images-and-
video/, 5th April 2018
33For María Camañes Forés, images are her
biggest pain point when it comes to site
speed. She let us in on the following secret
of how to deal with them on responsive sites:
“Having images scale properly along
with their containers is one of the
most common problems for
responsive sites. Luckily, this is also
one of the biggest potential wins –
it’s usually easy to fix and can have a
huge impact for some sites.
IMAGES HAVE
An effective solution is available in
THE BIGGEST
the form of the srcset and sizes
IMPACT ON
attributes. This allows you to specify
different image files for different
PAGE WEIGHT
screen-sizes/orientation/display- AND SITE
types. Usage is really simple: all you SPEED, SO
need to provide is a list of image files THERE ARE
(plus their widths in pixels) and hints HUGE WINS TO
about the size at which the image will
BE HAD FROM
be rendered on the page. Code
COMPRESSING
samples and a live demo are
available here.”
YOUR IMAGES
AND THEIR
FILE SIZES.
María Camañes Forés,
Technical SEO Consultant
at Builtvisible
34Code file size
If a site has been around for a while, various development More lines of code means more
teams may have worked on it and lots of different elements
time spent downloading. Strip
can accumulate within the code, leading to bloated pages
with large file sizes. Page weight reduction can be achieved down your code and send
by refining and trimming down code file size, meaning there’s
leaner, more compact pages to
less information to be processed and downloaded, which
leads to faster load times. servers and browsers.
TIPS ON IMPROVING CODE FILE SIZE PERFORMANCE
1 Minification: Remove any code or lines that don’t contribute to the
page, such as legacy code, whitespace and comments. Try using
HTMLMinifier, CSSNano or UglifyJS.
2 Reduce On-page Resources: Remove redundant files and assets
hosted on-page as this will reduce external requests.
3 Concatenate: Combine sets of JS or CSS files where it makes sense
to, and make sure you’re not serving the same scripts twice.
4 Text Compression: Use more efficient strings and naming
conventions, for example, to convey the same information with fewer
characters.
“You can find a list of optimizations for existing content, but what you won’t find are tips
to outright delete code – and what can be axed. The best optimizations aren’t after the
fact, but rather built into the process. Instead of instructing people to save image files a
certain way, and compress them in another, choose a CMS that handles that for you and
set editorial rules on how many images can be on a given template. That same mentality
applies to what 3rd party scripts and pixels can get added to your site’s pages, and the
removal of them. Start with a crawl or your website, run an audit on all scripts being used,
ask questions, and slowly but surely delete the cruft that has been left behind.”
Victor Pan,
Head of SEO at HubSpot
35Web Fonts
Around 70% of all sites are using at least one
43
non-standard web font. These web fonts “A naive implementation [of web
often have larger file sizes and require more fonts] may incur large downloads
HTTP requests to download and render and unnecessary delays. You
them, which causes speed delays. need to help the browser by
optimizing the font assets
From a user experience perspective, slow- themselves and how they are
loading web fonts also result in FOIT (flash of fetched and used on your pages.”
invisible text) or FOUT (flash of unstyled text)
44
G O O G L E D E V E LO P E R S
which can cause text flickering. This is less
than ideal for users.
TIPS ON IMPROVING WEB FONT PERFORMANCE
1 Compression: Use GZIP compression, as some web font formats
aren’t compressed by default and contain additional metadata which
increases file size.
2 Self-host Fonts: Self-hosting web fonts where possible reduces the
amount of external CSS requests needed.
3 Match Fallback Font: Make sure the intended font matches the
fallback font in terms of letter spacing and heights to reduce jarring
text flickering.
4 Use ‘font-display’: This allows text to be shown while the actual web
font is still loading. Bastian Grimm recommends using “font-
display:optional.” 45
5 Use ‘rel=preload’: Font requests are delayed by default until the
render tree has been constructed, so use to get
around this and request earlier loading.
Check the web fonts you’re using on your site; chances are you
could be using non-standard formats which
will increase load time.
43 HTTP Archive, https://httparchive.org/reports/state-of-the-web#bytesFont&reqFont
44 Google Developers, https://developers.google.com/web/fundamentals/performance/optimizing-content-efficiency/webfont-
optimization, 2nd March 2018
45 Bastian Grimm, https://www.slideshare.net/bastiangrimm/web-performance-madness-brightonseo-2018, 27th April 2018
36Redirects
Redirects take up time because they “trigger
an additional HTTP request-response cycle “Redirect Chains Impact Usability
46
and delay page rendering.” Now imagine and Crawling Efficiency”
this occurring in succession, and you have a
JOHN MUELLER,
redirect chain. Even worse, if this happens in 47
GOOGLE WEBMASTER HANGOUT
an endless cycle, a redirect loop is created.
This causes an issue for both users and
search engines trying to access your website.
Redirects aren’t only irritating for users, they also
impact Google’s ability to access and crawl websites
quickly and efficiently.
TIPS ON IMPROVING REDIRECT PERFORMANCE
1 Avoid Client-Side Redirects: Browsers can handle server-side
redirects better than client-side redirects, and can process them
more quickly.
2 Audit Existing Redirects: Go into your .htaccess file and find
unnecessary legacy redirects to remove, as browsers spend time
checking all redirects that exist for a URL.
3 Responsive Design: Having a responsive site means that the same
content is used for mobile and desktop, so there won’t be any
redirects between different page versions.
4 Check Other File Types: Remember that redirects can exist in your
CSS files, external scripts and on image URLs as well as in the HTML,
so make sure you fix these too.
5 Website Crawling: This will give you the most comprehensive view
of redirect chains and loops on your site.
46 Google PageSpeed Tools Insights, https://developers.google.com/speed/docs/insights/AvoidRedirects, 9th January 2018
47 Deeply Library, https://www.deepcrawl.com/blog/news/google-webmaster-hangout-notes-may-30th-2017/#link12, 30th May 2017
37At DeepCrawl, we provide detailed
redirect reports which show
instances of redirect chains and
redirect loops to help you identify
where issues exist on your site
and what needs to be fixed.
Try DeepCrawl out for yourself to
see these reports firsthand for
your website.
Start your free trial
Mobile speed Of people are likley to
and performance 89% recommend a brand after a
positive brand experience
on mobile
A positive mobile experience can translate to
more than one happy user and one
conversion. A lot rides on how users I M AG E S O U R C E : T H I N K W I T H G O O G L E
perceive your mobile site, and a key part of
their experience is load time.
The majority of searches and online activity This chart shows how long it takes a variety
now happen on mobile, but this device isn’t of different devices to load the CNN website
without its setbacks when it comes to and all of its JavaScript:
performance. As we discussed earlier, the
average mobile CPU isn’t as powerful as a
desktop CPU, and it is often more difficult to
access resource-intensive, heavy pages on
phones; in those cases they just can’t cope.
38Mobile cnn.com browser main thread time (Safari and Chrome)
Script
Layout
iPhone 8 (A11) 3967 2693 1148
Other
iPhone 7+ (A10) 5669 2002 2002
iPhone 6+ (A9) 6074 4483 1737
iPhone SE (A9) 5476 4464 1713
iPhone 6 (A8) 12038 5614 3069
iPhone 5c (A6) 16035 8403 5002
Samsung 7s (Exynos8890) 14354 3250 1048
Moto G4 (Snapdragon 617) 13355 4107 1002
Thinkpad T430 (Core i5 3320M) 7179 4955 2851
Thinkpad Yoga (Core i5 3320M) 2819 1243 422
Desktop (Core i7-5930K) 2016 818 265
0 10000 20000 30000
I M AG E S O U R C E : PAT R I C K M E E N A N , S M A S H I N G C O N F E R E N C E 2 0 1 8
Mobile is the most popular device, but it is also one of the least
performant. Think about the processing power of a standard phone
versus that of a desktop computer.
Google’s ‘Speed Update’
and mobile rankings “Although speed has
been used in ranking for
some time, that signal
Currently, mobile pages can be indexed and shown to
was focused on desktop
users even if they are slow, but this will begin to change
searches. Today we’re
when speed starts to be included as a factor for mobile
announcing that starting
rankings with Google’s upcoming Speed Update.
in July 2018, page speed
will be a ranking factor
In terms of how sites will be assessed for the Speed
for mobile searches.”
Update, this will closely align with the updated data
included in PageSpeed Insights and other Google
GOOGLE WEBMASTER
speed testing tools, as they all focus on slow user C E N T R A L B LO G
48
experiences and how to improve them.
48 Google Webmaster Central blog, https://webmasters.googleblog.com/2018/01/using-page-speed-in-mobile-search.html, 17th January 2018 39Mobile speed and performance is a
topic that will only continue to become “Mobile Page Speed Ranking
Factor Will Use Similar
more pressing, with Google’s Speed
Metrics to Google's Page
Update and beyond. Speed Tools”
JOHN MUELLER, GOOGLE
49
WEBMASTER HANGOUT
This means that we need to be more conscious
than ever of mobile performance, and need to
keep a close eye on how quickly users and search
“Separate Mobile Sites Need
engines can access your content. The same rules
to be Crawlable at the Same
about the correlation between speed of crawling
Speed as Desktop”
and indexability apply to mobile.
JOHN MUELLER, GOOGLE
50
WEBMASTER HANGOUT
AMP AMP
Google launched AMP (Accelerated Mobile Pages), an
open source project, to try to make content more
readily available no matter which device you’re using,
“We want webpages with rich
content like video,
animations and graphics to
work alongside smart ads,
by helping to create more lightweight pages. and to load instantaneously.
We also want the same code
AMP are often talked about as a possible solution for to work across multiple
increasing page speed and letting users see your platforms and devices so that
content even if you are burdened with a slow, hard-to- content can appear
optimise site. There is debate around whether or not everywhere in an instant.”
they are the solution to improving performance, so here
are some of the pros and cons so you can make your G O O G L E B LO G
51
own decisions around AMP.
49 Deeply Notes, https://www.deepcrawl.com/blog/news/google-webmaster-hangout-notes-january-23rd-2018/#link12, 23rd January 2018
50 Deeply Notes, https://www.deepcrawl.com/blog/news/google-webmaster-hangout-notes-april-3rd-2018/#link4, 3rd April 2018
51 Google Blog, https://www.blog.google/products/search/introducing-accelerated-mobile-pages/, 7th October 2015 40PROS: CONS:
Has made the industry care more about There is required development work and
speed and have more conversations resource to convert existing pages to
around the importance of performance. AMP - it involves rebuilding.
Creates a common goal and a new AMP are hosted on Google rather than
incentive for different departments to on your own site, and isn’t really open
work together on. source.
Google will prefetch and prerender AMP AMP look very similar as they use the
URLs when generating search results, same format and style across different
meaning the content will conveniently be websites, so there’s less opportunity to
cached for you. stand out from the crowd with your own
branding.
AMP allows your content to appear in
Google’s News Carousel. This used to be Having separate AMP URLs creates
exclusive to AMP but seems to be complexities with tracking and crawling.
opening up to other forms of content.
Only the first request is fast for AMP,
“AMP as a framework could eventually unless you implement PWAMP
help to enforce certain guidelines with its (Progressive Web App with Accelerated
restrictions, such as limited CSS inlining.” 52 Mobile Pages) which will make the
-Bastian Grimm, Director of Organic following interactions fast too.
Search at Peak Ace AG
A user-centric approach to site
speed improvement
The more you learn about site speed, the more IT’S NOT ABOUT
you see just how integral the user should be for PERFORMANCE METRICS
any performance optimisation strategy.
THEMSELVES, BUT HOW
THOSE METRICS ARE
“Google looks at the overall picture when
assessing site speed because optimising for PERCEIVED BY THE USER.
individual metrics such as Time To First Byte
(TTFB) might not actually improve the
John Mueller,
experience for users.” 53
Google Webmaster Hangout
52 Peak Ace AG, https://www.pa.ag/en/smx-munich-2018-amp/, 5th April 2018,
53 Deeply Notes, https://www.deepcrawl.com/blog/news/google-webmaster-hangout-notes-april-6th-2018/#link10, 6th April 2018
41Prioritising speed optimisation
where it matters most Tailor speed and
performance
If you want to take your performance optimisation to the optimisation to the real
next level, we’ve put together some ideas on centering user journey: focus on
this work on benefitting user. More than going about what customers can see
best practice work that could benefit anyone, it’s now and where they will
possible to focus optimisation efforts on real world go next.
users that actively engage with your site.
What the user can see now:
Critical path optimisation
You don’t have to sit back and wait for the For the user, this will be whatever’s above the
server or browser to tackle the entire weight of fold, which means whatever they first see on
a page in one go and hope for the best. There their device when they start their journey on
are options out there for choosing the most your site.
important elements on your site to be loaded
first and optimised as a priority.
I M AG E S O U R C E : B A S T I A N G R I M M , B R I G H T O N S E O 2 0 1 8
42Your most important code will be whatever is needed
for the above the fold content to be visible. Split out “Structure your page so
your code into critical and non-critical sections, and the initial response from
focus on optimising the performance of what’s critical. your server sends the
data necessary to render
You can use CriticalCSS to help you discover your most the critical part of the
important CSS. page immediately and
defer the rest.”
54
G O O G L E PAG E S P E E D T O O L S
FOR CRITICAL CONTENT: FOR NON-CRITICAL CONTENT:
Make sure your server sends this data from the Defer and asynchronously load or lazy-load
initial response. whatever’s left below the fold.
55 56
Use link rel=preload to tell the browser which Use loadCSS to load scripts asynchronously or
critical elements you want to be loaded as a dynamically so they are handled after the critical
priority. content.
Create an inline part of your CSS in the
which styles above the fold content.
You can take back control by splitting your site’s assets into two: critical and non-critical.
Prioritise the critical assets and tell the server and browser what’s most important to you.
Be sure try out Chrome’s upcoming feature
called ‘Priority Hints’ when it launches, which
has been developed to provide more control
over telling the browser what you want to be
loaded first. This feature will come with a new
“importance” attribute which you can use to set
elements as “high,” “low” or “auto.” This could
be a great solution for splitting out your
important content and getting it moved up in
the loading process.
54 Google PageSpeed Tools Insights, https://developers.google.com/speed/docs/insights/PrioritizeVisibleContent, 9th January 2018
55 MDN, https://developer.mozilla.org/en-US/docs/Web/HTML/Preloading_content, 30th April 2018
56 Github, https://github.com/filamentgroup/loadCSS 43You can also read