Forest Green Rovers Football Club Stadium, Stroud - RS Appendix 13.1 Detailed Air Quality Assessment
←
→
Page content transcription
If your browser does not render page correctly, please read the page content below
Ecotricity

Forest Green Rovers Football Club
Stadium, Stroud
RS Appendix 13.1 Detailed Air Quality Assessment

Project No. 442684

NOVEMBER 2017

RSK GENERAL NOTES
Project No.:        442684-AQ-01(02)

Title:              Forest Green Rovers Football Club Stadium, Stroud – Detailed Dispersion
                    Modelling Air Quality Assessment

Client:             Ecotricity

Date:               30/11/2017

Status:             FINAL

                     Dr Christina Higgins                    Technical                   Dr Srinivas Srimath
Author               Senior Consultant                       reviewer                    Director

Signature                                                    Signature
Date:                30/11/2017                              Date:                       30/11/2017

   RSK Environment Limited (RSK) has prepared this report in accordance with the instructions of the Client under the terms of
   appointment for RSK. The report is confidential and non-assignable by the Client and RSK shall not be responsible for any
   use of the report or its contents for any purpose other than that for which it was prepared and provided. Should the Client
   require to pass copies of the report to other parties for information, the whole of the report should be so copied, but no
   professional liability of warranty shall be extended to other parties by RSK in this connection without the explicit written
   agreement thereto by RSK. The report may be assigned by the Client by way of absolute legal assignment to a purchaser of
   all or part of the site to which the report refers (“The Site”) without the consent of RSK being required and such assignment
   shall be effective upon written notice thereof being given to RSK. No further assignments shall be permitted. In the event of
   the Client entering into a legal joint venture to develop The Site, the report can be regarded as having been issued by RSK
   jointly in favour of the Client and the joint venture partner, and in respect of the report RSK would owe the joint venture
   partner the same duty of care that we owed to the Client when we were instructed to prepare the report subject to all the
   matters contained or referred to in the report.

Ecotricity                                                                                                                   i
FGRFC Stadium, Stroud – Detailed Air Quality Assessment for Development
RSK 442684-01(02)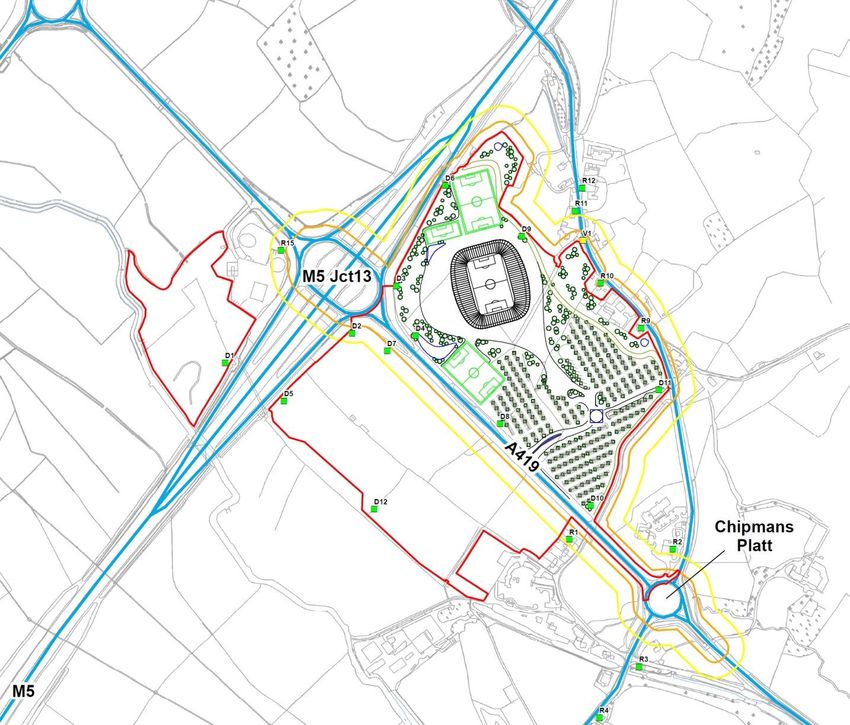
Summary
RSK Environment Ltd (RSK) was commissioned to undertake a detailed air quality assessment
for the proposed Forest Green Rovers Football Club (FGRFC) Stadium in Stroud. An air quality
assessment report was prepared for the Eco Park development in 2015; this is a Revised
Scheme for the stadium only development. The Site lies within the jurisdiction of Stroud District
Council (SDC). The Revised Scheme is not located within or near to a declared air quality
management (AQMA).
During the construction phase, impacts of the Revised Scheme may potentially arise due to
fugitive dust emissions. The risk of dust impacts was assessed according to a widely used
method published by the Institute of Air Quality Management (IAQM). Mitigation measures
appropriate to the construction phase will be secured by a dust management plan (DMP) agreed
with SDC; therefore, significant residual effects are not anticipated.
A dispersion modelling assessment of the operational phase air quality impacts associated with
emissions from the increase in traffic on local roads associated with the Revised Scheme has
been carried out by RSK. The assessment methodology and outcomes of the study are
presented in this report.
In order to quantify air quality impacts, concentrations of NO2, PM10 and PM2.5 were predicted at
existing and proposed receptors. Concentrations were predicted under three scenarios using an
advanced dispersion model, ADMS-Roads, and hourly sequential meteorological data. The
assessment has been undertaken with reference to existing air quality in the area and relevant
air quality legislation, policy and guidance, including the IAQM guidance Land-Use Planning &
Development Control: Planning For Air Quality.
The scenarios assessed were as follows:
‘Base Case’ scenario representing the ‘existing’ air quality situation in 2016;
‘Without Development’ (2021, the expected year of opening without the Revised Scheme
in place but including other committed/consented developments); and
‘With Development’ scenario (2021, the expected year of opening with Revised Scheme
in place and including other committed/consented developments).
Impact of the Development on Local Air Quality
The predicted NO2, PM10 and PM2.5 concentrations at all the assessed existing receptors, and for
all modelled scenarios, would not exceed the relevant air quality objectives. As a result of the
development (S3 2021 With Development), there is a ‘negligible’ air quality impact predicted with
respect to annual mean NO2, PM10 and PM2.5 at all modelled existing sensitive receptors.
Therefore, it may be considered that the air quality impact of the development on local air quality
is not significant.
Ecotricity ii
FGRFC Stadium, Stroud – Detailed Air Quality Assessment for Development
RSK 442684-01(02)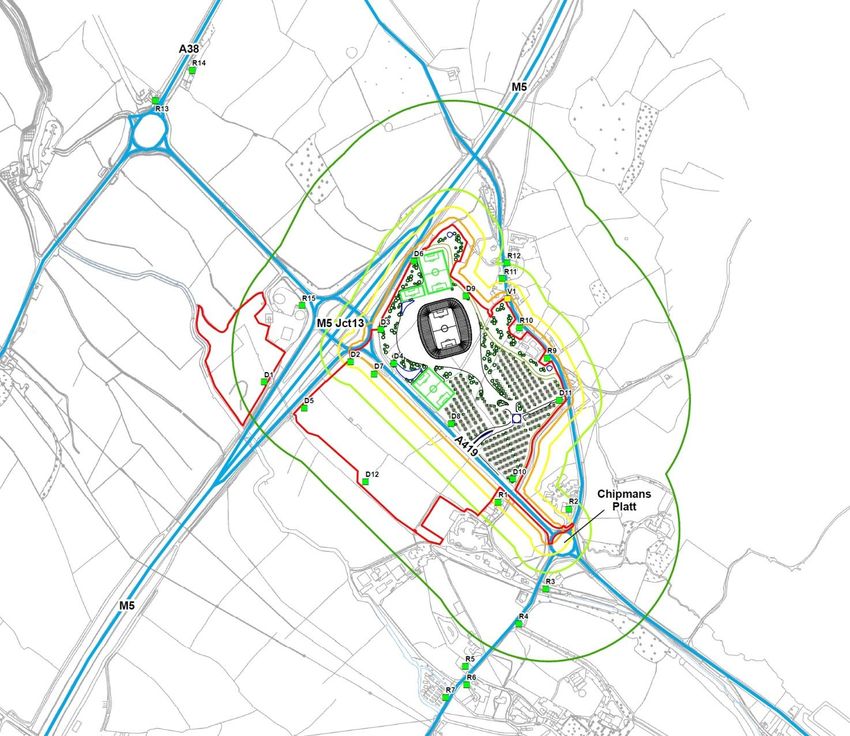
Fixed energy source details are not available at this stage of the project for the Revised Scheme.
Once identified (Reserved Matters stage) these sources may require additional assessment.

Impact of Future Air Quality on the Revised Scheme Receptors
None of the modelled proposed receptors are predicted to experience pollutant concentrations
above the annual mean NO2, PM10 or PM2.5 objectives. It is considered that increased exposure
to poor air quality at the Revised Scheme is unlikely and therefore, the air quality impact of the
development may be considered ‘not significant’.

Operational phase mitigation is considered unlikely to be required, good practice mitigation
measures to reduce the impact of emissions to air at sensitive receptors are recommended to
ensure the air quality impacts are minimised. These include good design principles, and
measures to help minimise vehicular trips and encourage more sustainable modes of travel.

Ecotricity                                                                                      iii
FGRFC Stadium, Stroud – Detailed Air Quality Assessment for Development
RSK 442684-01(02)
Abbreviations
AADT                Annual Average Daily Traffic
ADMS-Roads Atmospheric Dispersion Modelling System – Roads (a dispersion modelling
           software application)
AQAP                Air Quality Action Plan
AQMA                Air Quality Management Area
CHP                 Combined Heat and Power
Defra               Department for Environment, Food and Rural Affairs
DMP                 Dust Management Plan
EC                  European Commission
EPUK                Environmental Protection UK
EU                  European Union
HDV                 Heavy Duty Vehicle
IAQM                Institute of Air Quality Management
LAQM                Local Air Quality Management
NAQS                National Air Quality Strategy
NPPF                National Planning Policy Framework
NO2                 Nitrogen dioxide
NOx                 Oxides of nitrogen
O3                  Ozone
PM2.5               Particulate matter of size fraction approximating to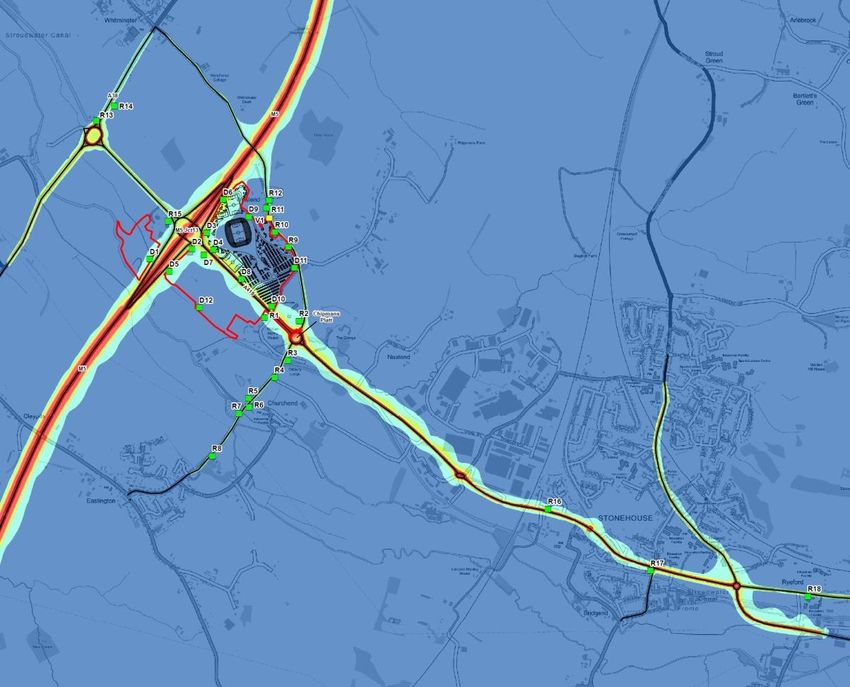
Contents
1    INTRODUCTION .............................................................................................................................. 2
     1.1 Background ..............................................................................................................................2
     1.2 Revised Scheme ......................................................................................................................2
2    LEGISLATION, PLANNING POLICY & GUIDANCE ...................................................................... 3
     2.1 Legislation ................................................................................................................................3
         2.1.1 Air Quality Strategy.......................................................................................................3
         2.1.2 Air Quality Standards....................................................................................................3
         2.1.3 The Environment Act ....................................................................................................4
     2.2 Planning Policy .........................................................................................................................4
         2.2.1 National Planning Policy Framework............................................................................4
         2.2.2 Local Planning Policy ...................................................................................................4
     2.3 Guidance Documents ...............................................................................................................5
         2.3.1 Guidance on the Assessment of Dust from Demolition and Construction ...................5
         2.3.2 Local Air Quality Management Review and Assessment Technical Guidance ...........5
         2.3.3 Land-Use Planning & Development Control: Planning for Air Quality .........................6
3    ASSESSMENT SCOPE & METHODOLOGY .................................................................................. 7
     3.1 Overall Approach ......................................................................................................................7
     3.2 Baseline Characterisation ........................................................................................................7
     3.3 Construction Phase Assessment .............................................................................................7
         3.3.1 Construction Dust and Particulate Matter ....................................................................7
         3.3.2 Emissions to Air from Construction Traffic and Plant ...................................................8
     3.4 Operational Phase Assessment ...............................................................................................8
         3.4.1 Modelling Software .......................................................................................................9
         3.4.2 Traffic Data ...................................................................................................................9
         3.4.3 Emission Factors ..........................................................................................................9
         3.4.4 Time-Varying Profile .....................................................................................................9
         3.4.5 Meteorological Data....................................................................................................11
         3.4.6 Background Air Quality Data Used in the Modelling ..................................................11
         3.4.7 Receptor Locations.....................................................................................................12
         3.4.8 Other Model Input Parameters ...................................................................................13
         3.4.9 NOx/NO2 Chemistry ....................................................................................................13
         3.4.10 Model Verification .......................................................................................................13
         3.4.11 Predicted Pollution Concentrations ............................................................................14
         3.4.12 Model Inputs Summary ..............................................................................................14
     3.5 Uncertainties and Assumptions ..............................................................................................15
4    BASELINE AIR QUALITY CHARACTERISATION .......................................................................16
     4.1 Emissions Sources and Key Air Pollutants ............................................................................16
     4.2 Local Authority Review and Assessment of Air Quality .........................................................16
         4.2.1 Stroud District Council (SDC) .....................................................................................16
     4.3 Baseline Monitoring Data .......................................................................................................16
     4.4 LAQM Support Background Data ...........................................................................................17
     4.5 Construction Phase ................................................................................................................18

Ecotricity                                                                                                                                          v
FGRFC Stadium, Stroud – Detailed Air Quality Assessment for Development
RSK 442684-01(02)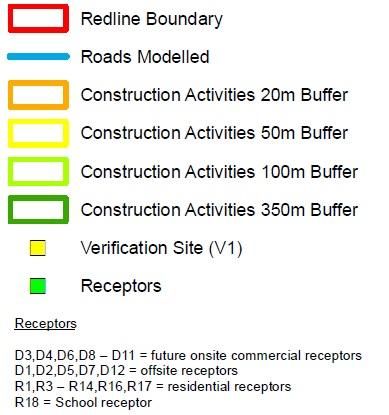
4.5.1 Construction Dust and Particulate Matter ..................................................................18
          4.5.2 Potential Dust Emission Magnitude ............................................................................18
          4.5.3 Sensitivity of the Area .................................................................................................20
          4.5.4 Risk of Effects.............................................................................................................21
      4.6 Operational Phase ..................................................................................................................23
          4.6.1 Dispersion Modelling Results .....................................................................................23
          4.6.2 Impact of the Development on Local Air Quality ........................................................23
          4.6.3 Impact of Future Air Quality on the Proposed Sensitive Receptors ...........................26
          4.6.4 Overall Significance of Operational Phase Impacts ...................................................26
5     MITIGATION MEASURES .............................................................................................................27
      5.1 Construction Phase Mitigation ................................................................................................27
      5.2 Operational Mitigation ............................................................................................................27
      5.3 Residual Impacts: Significance ..............................................................................................28
6     CONCLUSIONS .............................................................................................................................29
7     REFERENCES ...............................................................................................................................31

APPENDICES
RS Annex A Construction Dust Assessment Methodology ...........................................................32
RS Annex B Operation Impact Assessment Methodology .............................................................38
RS Annex C Traffic data .....................................................................................................................41
RS Annex D Modelling of Operational Phase – Verification Methodology and Model Results ..43
RS Annex E Contour Plots Showing Predicted Pollutant Concentrations ...................................47
RS Annex F Construction Phase Mitigation measures ...................................................................51

TABLES
Table 2.1: Air Quality Standards Relevant to the Revised Scheme .......................................................3
Table 3.1 Background Annual Average NOx, NO2, PM10 and PM2.5 Concentrations used in the
Assessment ...........................................................................................................................................12
Table 3.2: Receptors Included in the Dispersion Modelling Assessment .............................................12
Table 3.3: Summary of Inputs to the Dispersion Model ........................................................................14
Table 4.1 Annual Average Measured Pollutant Concentrations at Monitoring Sites Nearest to the Site
..............................................................................................................................................................17
Table 4.2 2016 Estimated Background Annual Average NO x, NO2, PM10 and PM2.5 Concentrations at
Site (2016-2018) ...................................................................................................................................17
Table 4.3: Summary of Dust Emissions Magnitude of Demolition Activities (Before mitigation) ..........18
Table 4.4: Summary of Dust Emissions Magnitude of Earthworks Activities (Before mitigation) .........19
Table 4.5: Summary of Dust Emissions Magnitude of Construction Activities (Before mitigation) .......19
Table 4.6: Summary of Dust Emissions Magnitude of Trackout Activities (Before mitigation) .............19
Table 4.7: Summary of Dust Emission Magnitude of the Site (Before mitigation) ................................20
Table 4.8: Sensitivity of the area ...........................................................................................................20
Table 4.9: Summary of the Dust Risk from Construction Activities ......................................................23
Table 4.10: Comparison of Predicted Long-Term NO2 Concentrations Under the ‘S2 Without
Development 2021’ and ‘S3 With Development 2021’ Scenarios ........................................................24
Table 4.11: Comparison of Predicted Long-Term PM10 and PM2.5 Concentrations Under the ‘S2
Without Development 2021’ and ‘S3 With Development 2021’ Scenarios ...........................................25

Ecotricity                                                                                                                                                   vi
FGRFC Stadium, Stroud – Detailed Air Quality Assessment for Development
RSK 442684-01(02)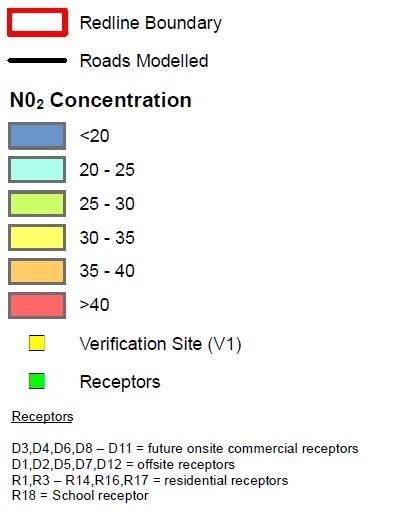
FIGURES
Figure 1.1: Revised Scheme Location ....................................................................................................2
Figure 3.1: The Roads and Receptors included in the Dispersion Modelling Assessment ..................10
Figure 3.2: Windrose from the Gloucestershire Meteorological Station in 2016 ..................................11
Figure 4.1: Construction and Trackout Activities Buffer Map ................................................................22

Ecotricity                                                                                                                            vii
FGRFC Stadium, Stroud – Detailed Air Quality Assessment for Development
RSK 442684-01(02)
1 INTRODUCTION
1.1 Background
RSK Environment Ltd (RSK) has been commissioned to undertake an assessment of
the potential air quality effects associated with the proposed Forest Green Rovers
Football Club (FGRFC) stadium development. The approximate centre of the Revised
Scheme is 377965, 206584 and it is located within the jurisdiction of Stroud District
Council (SDC). There are no air quality management areas (AQMAs) within the district.
Therefore, the Revised Scheme is not located within a declared AQMA.
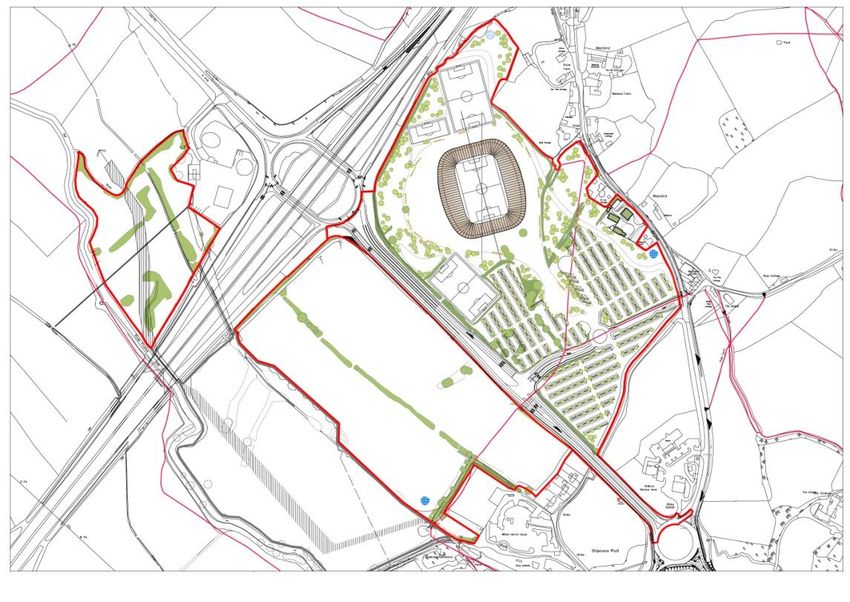
1.2 Revised Scheme
It is understood that the Revised Scheme will comprise the following:
5,000 capacity football stadium and other ancillary uses (Use Class D2)
within the stadium structure;
Two full-sized grass pitches;
Parking for 1,700 vehicles;
A signal controlled pedestrian and cycle crossing of the A419, with a
combined footway / cycleway on the south side of the A419;
A scheme for improvements to NCN45 from Stonehouse, to be funded via the
Section 106 Agreement;
Bus-only connection between the Revised Scheme and Grove Lane.
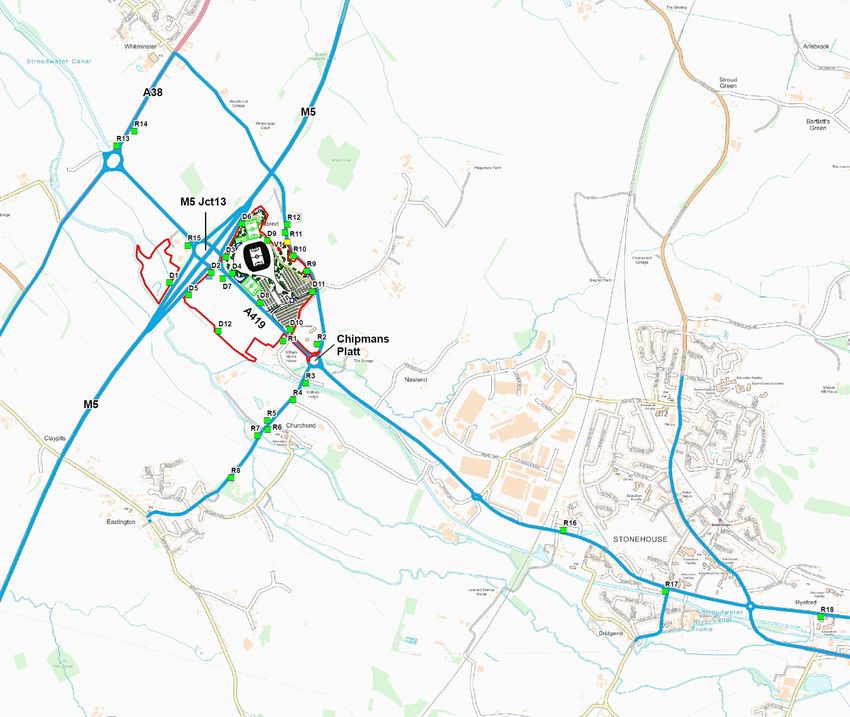
Figure 1.1: Revised Scheme Location
Ecotricity 2
FGRFC, Stroud – Detailed Air Quality Assessment for Development
RSK 442684-01(02)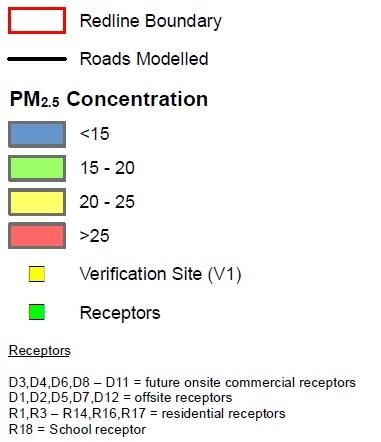
2 LEGISLATION, PLANNING POLICY &
GUIDANCE
2.1 Legislation
2.1.1 Air Quality Strategy
UK air quality policy is published under the umbrella of the Environment Act 1995, Part
IV and specifically Section 80, the National Air Quality Strategy (NAQS). The latest Air
Quality Strategy for England, Scotland, Wales and Northern Ireland – Working Together
for Clean Air, published in July 2007 sets air quality standards and objectives for ten
key air pollutants to be achieved between 2003 and 2020.
The Air Quality Framework Directive (1996) established a framework under which the
European Commission (EC) could set limit or target values for specified pollutants. The
directive identified several pollutants for which limit or target values have been, or will
be set in subsequent ‘daughter directives’. The framework and daughter directives were
consolidated by Directive 2008/50/EC on Ambient Air Quality and Cleaner Air for
Europe, which retains the existing air quality standards and introduces new objectives
for fine particulates (PM2.5).
2.1.2 Air Quality Standards
The air quality standards in the United Kingdom are derived from EC directives and are
adopted into English law via the Air Quality (England) Regulations 2000 and Air Quality
(England) Amendment Regulations 2002. The Air Quality Limit Values Regulations
2003 and subsequent amendments implement the Air Quality Framework Directive into
English Law. Directive 2008/50/EC was translated into UK law in 2010 via the Air
Quality Standards Regulations 2010.
The relevant1 standards for England and Wales to protect human health are
summarised in Table 2.1.
Table 2.1: Air Quality Standards Relevant to the Revised Scheme
Ground level
Exceedances
Substance Averaging period concentration limit
allowed per year 3
(g/m )
Nitrogen dioxide 1 calendar year - 40
(NO2) 1 hour 18 200
1 calendar year - 40
Fine particles (PM10)
24 hours 35 50
Fine particles (PM2.5)
1 year N/A 25
– target standard
1
Relevance, in this case, is defined by the scope of the assessment.
Ecotricity 3
FGRFC, Stroud – Detailed Air Quality Assessment for Development
RSK 442684-01(02)2.1.3 The Environment Act
The set air quality standards are to be used in the review and assessment of air quality
by local authorities under Section 82 of the Environment Act (1995). If exceedances are
measured or predicted through the review and assessment process, the local authority
must declare an Air Quality Management Area (AQMA) under Section 83 of the act, and
produce an Air Quality Action Plan (AQAP) to outline how air quality is to be improved
to meet the objectives under Section 84 of the act.
2.2 Planning Policy
The land use planning process is a key means of improving air quality, particularly in
the long term, through the strategic location and design of new developments. Any air
quality concern that relates to land use and its development can, depending on the
details of the proposed development, be a material consideration in the determination of
planning applications.
2.2.1 National Planning Policy Framework
In March 2012 The National Planning Policy Framework (NPPF) was published,
superseding the bulk of previous Planning Policy Statements with immediate effect. The
National Planning Policy Framework was intended to simplify the planning system and
includes a presumption in favour of sustainable development.
Section 11 of the NPPF deals with Conserving and Enhancing the Natural Environment,
and states that the intention is that the planning system should prevent ‘development
from contributing to or being put at unacceptable risk from, or being adversely affected
by unacceptable levels of soil, air, water or noise pollution or land instability’ and goes
on to state that ‘new development [should be] appropriate for its location’ and ‘the
effects (including cumulative effects) of pollution on health, the natural environment or
general amenity, and the potential sensitivity of the area or proposed development to
adverse effects from pollution, should be taken into account.’
With specific regard to air quality, the NPPF states that:
‘Planning policies should sustain compliance with and contribute towards EU
[European Union] limit values or national objectives for pollutants, taking into
account the presence of Air Quality Management Areas and the cumulative
impacts on air quality from individual sites in local areas. Planning decisions
should ensure that any new development in Air Quality Management Areas is
consistent with the local air quality action plan’.
2.2.2 Local Planning Policy
The Stroud District Local Plan was adopted in 2015. The plan contains Deliver Policy
ES5 regarding air quality and states:
“Development proposals which by virtue of their scale, nature or location are
likely to exacerbate existing areas of poor air quality, will need to demonstrate
that measures can be taken to effectively mitigate emission levels in order to
Ecotricity 4
FGRFC, Stroud – Detailed Air Quality Assessment for Development
RSK 442684-01(02)protect public health and well being, environmental quality and amenity.
Mitigation measures should demonstrate how they will make a positive
contribution to the aims of any Air Quality Strategy for Stroud District and may
include:
1. landscaping, bunding or separation to increase distance from highways and
junctions
2. possible traffic management or highway improvements to be agreed with the
local authority
3. abatement technology and incorporating site layout / separation and other
conditions in site planning
4. traffic routing, site management, site layout and phasing
5. managing and expanding capacity in the natural environment to mitigate poor
air quality.”
Following adoption of the Eastington Neighbourhood Development Plan (adopted
October 2016) the Parish Council and District Council will apply all relevant polices of
the plan in considering development proposals. Whilst there are no specific policies
relating to air quality, the overarching Neighbourhood Development Plan is in line
with higher level planning policy including the NPPF which has a presumption in favour
of sustainable development. The NPPF paragraph 7 defines sustainability in terms of:
‘an environmental role – contributing to protecting and enhancing our
natural, built and historic environment; and, as part of this, helping to
improve biodiversity, use natural resources prudently, minimise waste and
pollution, and mitigate and adapt to climate change including moving to a
low carbon economy.’
2.3 Guidance Documents
2.3.1 Guidance on the Assessment of Dust from Demolition and Construction
The Institute of Air Quality Management (IAQM) published a guidance document in
2014 (Holman et al., 2014) on the assessment of construction phase impacts. The
guidance was produced to provide advice to developers, consultants and environmental
health officers on how to assess the impacts arising from construction activities. The
emphasis of the methodology is on classifying sites according to the risk of impacts (in
terms of dust nuisance, PM10 impacts on public exposure and impact upon sensitive
ecological receptors) and to identify mitigation measures appropriate to the level of risk
identified.
2.3.2 Local Air Quality Management Review and Assessment Technical Guidance
The Department for Environment, Food and Rural Affairs (Defra) has published
technical guidance for use by local authorities in their air quality review and assessment
work. This guidance, referred to in this document as LAQM.TG(16), has been used
where appropriate in the operational phase assessment presented herein.
Ecotricity 5
FGRFC, Stroud – Detailed Air Quality Assessment for Development
RSK 442684-01(02)2.3.3 Land-Use Planning & Development Control: Planning for Air Quality
Environmental Protection UK (EPUK) and the IAQM jointly published a revised version
of the guidance note ‘Land-Use Planning & Development Control: Planning for Air
Quality’ in 2017 (herein the ‘EPUK-IAQM’ guidance) to facilitate the consideration of air
quality in the land-use planning and developmental control process. It provides a
framework for air quality considerations within local development control processes,
promoting a consistent approach to the treatment of air quality issues within
development control decisions.
Ecotricity 6
FGRFC, Stroud – Detailed Air Quality Assessment for Development
RSK 442684-01(02)3 ASSESSMENT SCOPE & METHODOLOGY
3.1 Overall Approach
The approach taken for assessing the potential air quality impacts of the Revised
Scheme may be summarised as follows:
correspondence with the local authority regarding the Revised Scheme in terms
of air quality;
baseline characterisation of local air quality;
qualitative impact assessment of the construction phase of the development;
advanced dispersion modelling assessment of air quality impacts of the Revised
Scheme under the following three scenarios:
(i) ‘Base case’ scenario representing the ‘existing’ air quality situation in 2016;
(ii) ‘Without Development’ scenario (2021, the expected year of opening with
committed/consented development but without the Revised Scheme in place);
and
(iii) ‘With Development’ scenario (2021, the expected year of opening with
committed/consented development and with the Revised Scheme in place).
recommendation of mitigation measures, where appropriate, to ensure any
adverse effects on air quality are minimised; and
identification of residual impacts resulting from the Revised Scheme.
3.2 Baseline Characterisation
Existing or baseline air quality refers to the concentrations of relevant substances that
are already present in ambient air. A desk based study has been undertaken including
a review of monitoring data available from SDC and estimated background data from
the LAQM Support website maintained by Defra. Background concentrations have been
mapped by Defra at a grid resolution of 1x1km for the whole of the UK. Consideration
has also been given to potential sources of air pollution in the vicinity of the application
site.
3.3 Construction Phase Assessment
3.3.1 Construction Dust and Particulate Matter
Construction works for the Revised Scheme have the potential to lead to the release of
fugitive dust and particulate matter. An assessment of the likely significant effects of
construction phase dust and particulate matter at sensitive receptors has therefore
been undertaken following the IAQM’s construction dust guidance.
In order to assess the potential impacts construction activities are divided into four
types:
Ecotricity 7
FGRFC, Stroud – Detailed Air Quality Assessment for Development
RSK 442684-01(02) Demolition;
Earthworks;
Construction; and
Trackout2.
RS Annex A details how the ‘dust emission magnitude’, associated with each of these
activities, is combined with the sensitivity of receptors (human or ecological), to
determine the overall ‘dust risk’.
3.3.2 Emissions to Air from Construction Traffic and Plant
Exhaust emissions from construction phase vehicles and plant may have an impact on
local air quality adjacent to the routes used by these vehicles to access the application
site and in the vicinity of the application site itself. Detailed information on the number of
vehicles and plant associated with the construction phase is not available at this stage
(and would not be until after appointment of the main construction contractors),
therefore a qualitative impact assessment has been undertaken based on professional
judgement and considering the following factors:
The likely duration of the construction phase;
The potential number and type of construction traffic and plant that could be
required; and
The number and proximity of sensitive receptors to the application site and
along the likely construction vehicle routes.
3.4 Operational Phase Assessment
Once operational, the Revised Scheme will generate additional traffic on the
surrounding road network; the emissions to air associated with this traffic have the
potential to impact on nearby sensitive receptors. The 2017 EPUK-IAQM guidance
provides an approach for assessing the significance of air quality impacts associated
with a development in relation to emissions from traffic.
To assess the impacts of a development on the surrounding area, the guidance
recommends that the degree of an impact is described by expressing the magnitude of
incremental change as a proportion of the relevant assessment level and examining this
change in the context of the new total concentration and its relationship with the
assessment criterion. The approach is further described in RS Annex B including the
descriptors for the impact significance.
The following subsections provide further information regarding input to the dispersion
model including traffic emissions sources, meteorological data and receptors included.
2
Trackout is defined as the transport of dust and dirt from the construction / demolition sites onto public road
network, where it may be deposited and then re-suspended by vehicles using the network.
Ecotricity 8
FGRFC, Stroud – Detailed Air Quality Assessment for Development
RSK 442684-01(02)3.4.1 Modelling Software
ADMS-Roads is a ‘new generation’ advanced dispersion model developed by the UK
consultancy CERC (Cambridge Environmental Research Consultants). ADMS-Roads is
widely used and validated within the UK and Europe. The model allows for the skewed
nature of turbulence within the atmospheric boundary layer. ADMS-Roads is capable of
processing hourly sequential meteorological data, whilst taking the turbulence caused
by vehicles into account in calculating the dispersion profiles of emitted pollutants.
ADMS-Roads enables the user to predict concentrations of pollutants of concern at
multiple receptor locations.
ADMS-Roads (Version 4.1) was used for assessing potential road traffic emission air
quality impacts resulting from the operational phase of the Revised Scheme.
3.4.2 Traffic Data
The transport consultants for the development scheme, PFA Consulting Ltd, provided
the traffic data for use in the air quality assessment. The traffic data used in the
modelling are presented in RS Annex C.
The road network included in the dispersion model is presented in Figure 3.1. Speed
limit data, professional judgement and LAQM.TG(16) were used to determine speeds
for use within the model, including reduced speeds at junctions.
3.4.3 Emission Factors
Vehicular emissions were calculated using the Emission Factors Toolkit (Version 7.0),
which is available from the Defra UK-AIR website. There is currently some uncertainty
on future predicted emissions rates. To address this uncertainty, it was assumed that
there would be no improvement in emission factors from the model baseline year of
2016 to the opening year of 2021. Emission scenario year 2016 was therefore used for
the ‘2016 base case’, ‘2021 Without Development’ and ‘2021 With Development’
scenarios for a conservative assessment.
3.4.4 Time-Varying Profile
Vehicle movements vary with time. The 2016 national diurnal profile was applied to all
roads, which can be seen in RS Annex C.
Ecotricity 9
FGRFC, Stroud – Detailed Air Quality Assessment for Development
RSK 442684-01(02)Figure 3.1: The Roads and Receptors included in the Dispersion Modelling Assessment3
3
Contains Ordnance Survey data. Crown Copyright and database right 2017
Ecotricity 10
FGRFC, Stroud – Detailed Air Quality Assessment for Development
RSK 442684-01(02)3.4.5 Meteorological Data
Hourly sequential meteorological data were employed in the dispersion model. The data
were recorded in 2016 at the Gloucestershire meteorological monitoring station. This is
the closest monitoring station to the Site, and is considered likely to be the most
representative.
The windrose derived from the 2016 dataset is presented in Figure 3.2. The
predominant wind direction was south-westerly.
Figure 3.2: Windrose from the Gloucestershire Meteorological Station in 2016
350° 0° 10°
340° 800 20°
330° 30°
320° 40°
600
310° 50°
300° 60°
400
290° 70°
200
280° 80°
270° 90°
260° 100°
250° 110°
240° 120°
230° 130°
220° 140°
210° 150°
200° 160°
190° 180° 170°
0 3 6 10 16 (knots)
Wind speed
0 1.5 3.1 5.1 8.2 (m/s)
3.4.6 Background Air Quality Data Used in the Modelling
Estimated background annual average concentrations in 2016 of NO2, NOx, PM10 and
PM2.5 obtained from the LAQM Support website operated by Defra were used for all
scenarios in the modelling; these are detailed in Table 3.1. The background
concentrations were kept constant at 2016 levels for the 2021 modelled scenarios, to
Ecotricity 11
FGRFC, Stroud – Detailed Air Quality Assessment for Development
RSK 442684-01(02)allow for a conservative assessment. A-Roads and Motorways have been removed
from the background data to avoid double counting.
Table 3.1 Background Annual Average NOx, NO2, PM10 and PM2.5 Concentrations used
in the Assessment
Annual Average Pollutant Concentrations
Assessment Annual Annual Annual Annual
Year Average NOX Average NO2 Average PM10 Average PM2.5
3 3 3 3
(µg/m ) (µg/m ) (µg/m ) (µg/m )
2016
14.0 10.3 16.2 11.1
Air Quality
Objective 30^ 40 40 25
^ air quality objective designated for the protection of vegetation and ecosystems only.
3.4.7 Receptor Locations
Pollutant concentrations were predicted at a number of receptors in and around the
redline boundary. Details of all specific receptors included in the modelling study (and
hence the air quality impacts assessed) are summarised in Table 3.2. The locations of
all assessed receptors are shown in Figure 3.1.
The receptors were selected to represent existing receptors and locations within the
redline boundary, considered to represent ‘worst-case’ exposure locations.
Table 3.2: Receptors Included in the Dispersion Modelling Assessment
Grid reference Height
Receptor ID Receptor Location
X Y (m)
Northwest area of redline boundary, north
1.5
D1 of M5 377603 206664
Within redline boundary – south of M5
1.5
D2 and A419 377847 206721
Within redline boundary – south of M5
1.5
D3 and north of A419 377932 206812
Within redline boundary – south of M5
1.5
D4 and north of A419 377969 206716
Within redline boundary – south of M5
1.5
D5 and A419 377716 206591
Within redline boundary – south of M5
1.5
D6 and north of A419 378026 207005
Within redline boundary – south of M5
1.5
D7 and A419 377914 206687
Within redline boundary – south of M5
1.5
D8 and north of A419 378131 206547
Within redline boundary – south of M5
1.5
D9 and north of A419 - close to Grove Lane 378173 206907
D10 Within redline boundary – south of M5 378305 206390 1.5
Ecotricity 12
FGRFC, Stroud – Detailed Air Quality Assessment for Development
RSK 442684-01(02)Grid reference Height
Receptor ID Receptor Location
X Y (m)
and north of A419
Within redline boundary – south of M5
1.5
D11 and north of A419 - close to Grove Lane 378436 206612
Within redline boundary – south of M5
1.5
D12 and A419 377889 206383
R1 Residential property close to A419 378264 206325 1.5
R2 Residential property close to Grove Lane 378463 206306 1.5
R3 Residential property close to Spring Hill 378398 206080 1.5
R4 Residential property close to Spring Hill 378322 205982 1.5
R5 Residential property close to Spring Hill 378171 205862 1.5
R6 Residential property close to Spring Hill 378175 205810 1.5
R7 Residential property close to Spring Hill 378116 205774 1.5
R8 Residential property close to Spring Hill 377963 205530 1.5
R9 Residential property close to Grove Lane 378402 206731 1.5
R10 Residential property close to Grove Lane 378324 206817 1.5
R11 Residential property close to Grove Lane 378275 206956 1.5
R12 Residential property close to Grove Lane 378289 207000 1.5
R13 Residential property close to A38 377400 207543 1.5
R14 Residential property close to A38 377296 207457 1.5
Commercial property close to M5/A419
1.5
R15 junction 377710 206880
R16 Residential property on Bristol Road 379894 205225 1.5
R17 Residential property on Downtown Road 380485 204870 1.5
R18 School on Ebley Road 381389 204722 1.5
* Mole Cottage, Grove Lane 378290 206899 2.0
Note: *Verification site location.
3.4.8 Other Model Input Parameters
In order to represent the suburban nature of the Site and surrounding area, a surface
roughness length of 0.75m was included in the model. The Monin-Obukhov length
(related to atmospheric stability) was assumed to be 30m.
3.4.9 NOx/NO2 Chemistry
The latest NOx/NO2 conversion spreadsheet/tool downloaded from the Defra LAQM
website was used to estimate the predicted roadside NO2 concentrations from modelled
NOx concentrations. The calculator is only applicable to the calculation of annual
average concentrations of NO2.
3.4.10 Model Verification
The data from 2016 at the diffusion tube NO2 monitoring site listed in Table 3.2 was
used for model verification. Model verification is described in RS Annex D.
Ecotricity 13
FGRFC, Stroud – Detailed Air Quality Assessment for Development
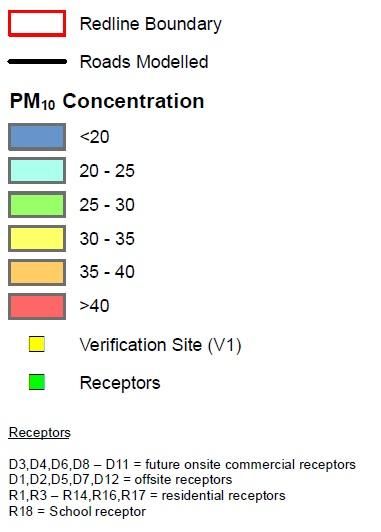
RSK 442684-01(02)3.4.11 Predicted Pollution Concentrations
NO2, PM10 and PM2.5 concentrations were, taking into account background air quality,
predicted at each receptor location for each modelled scenario. The dispersion model
results have been verified and details are presented in
RS Annex D. Isopleths, or pollution concentration contour plots, for long-term NO2,
PM10 and PM2.5 predicted concentrations for the ‘S3 With Development’ scenario have
been created and presented in RS Annex E.
3.4.12 Model Inputs Summary
The modelling input parameters for the dispersion modelling assessment are presented
in Table 3.3.
Table 3.3: Summary of Inputs to the Dispersion Model
Parameter Brief Description Input into model
NOx chemistry using a simple reaction Chemistry parameters
Chemistry scheme for NOx, NO2 and ozone (O3) included, for short term
predictions.
Predicted emission rates depend on
Emission year 2016, for all scenarios
the year of emission being used
Road source emission rates
Road source calculated form traffic flow data using
EFTv7.0
emissions an emission factor toolkit from UK-
AIR
Time varied Diurnal variations of emissions 2016 national diurnal profiles
emissions applied to road sources used
Road elevation Elevation of road above ground level No terrain file used
Road widths determined based
Road width Width of road (m) on approximate measurement
of roads (internet mapping)
Height of canyons effects turbulent
Canyon heights flow patterns; these are greater with No canyons included
larger canyon heights
Selection of different types of road to
Urban (not London) settings
Road type be assessed, inputted into the
used
emission factor toolkit calculations
Speed of the road effects the vehicle Standard speed limits used
Road speeds
emissions to air and professional judgement
Representative hourly sequential Gloucestershire 2016 data
Meteorology
meteorological data used
Allows the location of the model area
Latitude 51.7
to be determined
This defines the surface roughness of 0.75m to represent an area
Surface
the model area between parkland (0.5m) and
roughness
city (1m)
A boundary layer parameter required
to precisely describe the atmospheric
Monin-
stability conditions and to predict Assumed to be 30m
Obukhov length
dispersion of pollutants released from
road traffic
Ecotricity 14
FGRFC, Stroud – Detailed Air Quality Assessment for Development
RSK 442684-01(02)Parameter Brief Description Input into model
Concentrations of pollutants in Reference Table 3.1 for levels
Background
background locations included
Sensitive receptors at risk of
Reference Table 3.2 for
Receptors increased exposure, either existing or
receptors included
proposed
3.5 Uncertainties and Assumptions
The following uncertainties and assumptions have been made in the air quality
assessment:
In the absence of measured air quality data at the Revised Scheme location,
estimated background data from the Defra LAQM website were used in the
assessment. In reality, baseline air quality levels vary with time and location but
in the absence of on-site baseline monitoring data, the assumption that the
baseline concentrations obtained from the above-mentioned data source is
applicable to the Site location, is considered appropriate;
Vehicle emission factors were obtained from the Emission Factor Toolkit
(version 7.0), published on the DEFRA website, for the scenario year 2016;
There will be uncertainties introduced because the modelling has simplified
real-world processes into a series of algorithms. For example, it has been
assumed that wind conditions measured at Gloucestershire meteorological
monitoring station in 2016 were representative of wind conditions at the Site, as
this meteorological station is closest to the Site. Furthermore, it has been
assumed that the subsequent dispersion of emitted pollutants will conform to a
Gaussian distribution over flat terrain in order to simplify the real-world dilution
and dispersion conditions;
An important step in the assessment is verifying the dispersion model against
measured data. The model verification was based on the comparison of model
results based on 2015 factored traffic data with 2016 measured roadside NO2
diffusion tube data. As no PM10 or PM2.5 monitoring data were available near
the Site area, the adjustment factor used for the predicted roadside NOx
concentrations has been applied to the predicted PM10 and PM2.5
concentrations, as per guidance provided in the Local Air Quality Management
Technical Guidance Note LAQM.TG (16) published by Defra;
The 2016 national diurnal profile obtained from DfT has been assumed to be
applicable for the roads assessed (specific diurnal profiles were not available);
Fixed energy source details are not available at this stage of the project for the
Revised Scheme. Once identified (Reserved Matters stage) these sources may
require additional assessment; and
There is an element of uncertainty in all measured and modelled data. All
values presented in this chapter are best possible estimates.
Ecotricity 15
FGRFC, Stroud – Detailed Air Quality Assessment for Development
RSK 442684-01(02)4 BASELINE AIR QUALITY
CHARACTERISATION
Existing or baseline air quality refers to the concentrations of relevant substances that
are already present in ambient air. These substances are emitted by various sources,
including road traffic, industrial, domestic, agricultural and natural sources. Baseline air
quality data employed in this study were obtained from automatic and diffusion tube
monitoring stations maintained by SDC and from the LAQM Support website operated
by the Department for Environment, Food and Rural Affairs (Defra).
4.1 Emissions Sources and Key Air Pollutants
Transport-related emissions are one of the main sources of air pollution in urban areas.
The principal pollutants relevant to this assessment are considered to be NO2, PM10
and PM2.5 generally regarded as the most significant air pollutants released by vehicular
combustion processes, or subsequently generated by vehicle emissions in the
atmosphere through chemical reactions. These pollutants are generally considered to
have the greatest potential to result in human health impacts, and are the substances of
most concern in terms of existing levels in the area, as discussed below.
4.2 Local Authority Review and Assessment of Air Quality
As directed by the Environment Act 1995, local authorities are required to review and
assess air quality with respect to the standards and objectives for the pollutants
specified in the Government’s National Air Quality Strategy (NAQS, 2007). Where
objectives are not predicted to be met, local authorities must declare an AQMA. In
addition, local authorities are required to produce an Air Quality Action Plan (AQAP),
which outlines measures aimed at improving air quality within the designated AQMA.
4.2.1 Stroud District Council (SDC)
SDC currently does not have any AQMAs.
4.3 Baseline Monitoring Data
According to SDC’s 2016 Air Quality Progress Report, there were no automatic
monitoring stations operating within the district. Nitrogen dioxide (NO2) was monitored
using passive diffusion tubes at 25 sites.
The annual average NO2 concentrations obtained at monitoring locations within 6km
from the development site are reproduced in Table 4.1. These data show that there
were no exceedances of the annual mean standard for NO2 at the listed monitoring
locations.
Ecotricity 16
FGRFC, Stroud – Detailed Air Quality Assessment for Development
RSK 442684-01(02)Table 4.1 Annual Average Measured Pollutant Concentrations at Monitoring Sites
Nearest to the Site
Approx 3
Annual Average NO2 (µg/m )
Site ID Site Type distance from
site (kms) 2015 2016
Diffusion tube sites
Stonehouse –
Mole Cottage, Roadside 0.3 NA 16.7
Grove Lane
10 Bristol Road Kerbside 2.7 20.9 NA
Haresfield – The
Roadside 4.3 NA 24.1
Lodge
Cainscross – 22
Roadside 5.6 29.5 29.1
Westward Road
Cainscross – 2
The Rosaries Roadside 5.6 37.5 35.4
Paganhill Lane
Hardwicke –
Roadside 5.6 NA 34.6
Trevose
Air Quality Objective (annual mean) 40
4.4 LAQM Support Background Data
In addition to the local monitoring data, estimated background air quality data available
from the LAQM website, operated by Defra, may also be used to establish likely
background air quality conditions at the Site. The LAQM website provides estimated
annual average background concentrations of NOx, NO2 PM10 and PM2.5 on a 1km2 grid
basis. Table 4.2 identifies estimated annual average background NOx, NO2, PM10 and
PM2.5 concentrations at the Revised Scheme and receptor sites for the year 2016 (2013
base year maps). No exceedance of annual average air quality objectives for human
health, for NO2 or PM10 is predicted at background locations.
Table 4.2 2016 Estimated Background Annual Average NOx, NO2, PM10 and PM2.5
Concentrations at Site (2016-2018)
Estimated Annual Average Pollutant Concentrations
Assessment Annual Annual Annual Annual
Year Average NOX Average NO2 Average PM10 Average PM2.5
3 3 3 3
(µg/m ) (µg/m ) (µg/m ) (µg/m )
2016 22.4 15.9 16.4 11.3
2017 21.0 15.0 16.3 11.2
2018 19.7 14.2 16.2 11.1
Air Quality
Objective 30^ 40 40 25
2
Notes: Presented concentrations for 1km grid centered 377500, 206500; approximate centre of
development site is 378133, 206691. ^air quality objective designated for the protection of vegetation
and ecosystems only.
Ecotricity 17
FGRFC, Stroud – Detailed Air Quality Assessment for Development
RSK 442684-01(02)4.5 Construction Phase
4.5.1 Construction Dust and Particulate Matter
Fugitive dust emissions arising from construction activities are likely to be variable in
nature and will depend upon the type and extent of the activity, soil type and moisture,
road surface conditions and weather conditions. Periods of dry weather combined with
higher than average wind speeds have the potential to generate more dust.
Construction activities that are often the most significant potential sources of fugitive
dust emissions are:
Earth moving, due to the handling, storage and disposal of soil and subsoil
materials;
Construction aggregate usage, due to the transport, unloading, storage and use
of dry and dusty materials (such as cement and sand);
Movement of heavy site vehicles on dry or untreated haul routes; and,
Movement of vehicles over surfaces where muddy materials have been
transferred off-site (for example, on to public highways).
Fugitive dust arising from construction activities is mainly of a particle size greater than
the PM10 fraction (that which can potentially impact upon human health), however it is
noted that construction activities may contribute to local PM10 concentrations.
Appropriate dust control measures can be highly effective for controlling emissions from
potentially dust generating activities identified above, and adverse effects can be
greatly reduced or eliminated.
4.5.2 Potential Dust Emission Magnitude
With reference to the IAQM guidance criteria outlined in RS Annex A, the dust
emissions magnitude for demolition, earthworks, construction and trackout activities are
summarised in Table 4.3 to Table 4.6. Risk categories for the four construction
activities are summarised in Table 4.6.
Worst-case assumptions have been made, where information is not currently available,
for a conservative assessment.
Table 4.3: Summary of Dust Emissions Magnitude of Demolition Activities (Before
mitigation)
Dust Emissions
Demolition Criteria Evaluation of the Effects
Class
Total volume of buildings to 3
SmallDust Emissions
Demolition Criteria Evaluation of the Effects
Class
On-site crushing and Yes, on-site crushing and
Medium
screening screening proposed
Height of demolition activities
Small 10,000m
Soil type Large Clay
Maximum of 5-10 heavy earth
Earth moving vehicles at any
Medium moving vehicles active at any one
one time
time
Height of bunds Small 100,000 tonnes material to be
Total material moved Large
moved
Earthworks proposed in all
Work times Medium
seasons
Overall Rating Large Worse case
Table 4.5: Summary of Dust Emissions Magnitude of Construction Activities (Before
mitigation)
Dust Emissions
Construction Criteria Evaluation of the Effects
Class
3
Total building volume Large > 100,000m
On-site concrete batching or
Small None proposed
sandblasting proposed
Dust potential of construction
Medium Potentially dusty materials
materials
Overall Rating Medium Worse case
Table 4.6: Summary of Dust Emissions Magnitude of Trackout Activities (Before
mitigation)
Dust Emissions
Trackout Criteria Evaluation of the Effects
Class
Number of HDV>3.5t per day Large >50 heavy vehicles per day
Surface type of the Site Medium Mix of hard and soft
Length of unpaved road SmallTable 4.7: Summary of Dust Emission Magnitude of the Site (Before mitigation)
Construction Activities Dust Emissions Class
Demolition Medium
Earthworks Large
Construction Medium
Trackout Medium
4.5.3 Sensitivity of the Area
As per the IAQM Guidance, the sensitivity of the area takes into account a number of
factors, including:
The specific sensitivities of receptors in the area;
The proximity and number of those receptors;
In the case of PM10, the local background concentration; and,
Site specific factors, such as whether there are natural shelters, such as trees,
to reduce the risk of wind-blown dust.
Consideration is given to human and ecological receptors from the effect of the
construction site boundary and the trackout route proposed. Where necessary, for
example, the trackout route is not yet known, a conservative view on the likely route has
been taken.
Figure 4.1 shows a map indicating the construction and trackout buffers for identifying
the sensitivity of the area and Table 4.8 presents the determined sensitivity of the area
with the factors itemised which have helped to define this.
Construction activities are relevant up to 350m from the redline boundary whereas
trackout activities are only considered relevant up to 50m from the edge of the road, as
per the guidance. Only 20m and 50m buffers have been included for trackout for this
reason.
No designated ecological receptors have been identified within 50m of the application
site boundary or the anticipated trackout route. Therefore, following the IAQM guidance
ecological receptors have been screened out of the assessment and are not considered
further.
Table 4.8: Sensitivity of the area
Potential Sensitivity of the surrounding area
Effect Demolition Earthworks Construction Trackout
Receptor
sensitivity
High High High High
Dust Number of
soiling receptors
1-10 1-10 1-10 1-10
Distance fromPotential Sensitivity of the surrounding area
Effect Demolition Earthworks Construction Trackout
Sensitivity of
Medium Medium Medium Medium
the area
Receptor
High High High High
sensitivity
Annual mean
3 3 3 3
PM10Figure 4.1: Construction and Trackout Activities Buffer Map
Construction Buffer Map
Trackout Buffer Map
Ecotricity 22
FGRFC, Stroud – Detailed Air Quality Assessment for Development
RSK 442684-01(02)Table 4.9: Summary of the Dust Risk from Construction Activities
Dust Risk Effect
Potential Effect
Demolition Earthworks Construction Trackout
Dust soiling Medium risk Medium risk Medium risk Medium risk
Human health Low risk Low risk Low risk Low risk
Ecological Negligible Negligible Negligible Negligible
4.6 Operational Phase
The main potential impact of the Revised Scheme is considered to be emissions from
increased road traffic associated with the operational phase. Figure 3.1 shows the
roads and sensitive receptors included in the dispersion modelling assessment.
4.6.1 Dispersion Modelling Results
Detailed dispersion modelling was undertaken with the use of the ADMS-Roads
dispersion model software, following guidance in accordance with Local Air Quality
Management Technical Guidance (LAQM TG(16)).
The modelled concentrations were verified using monitoring data; for reference, the
methodology for this has been described in RS Annex D. Model results for NO2, PM10
and PM2.5 concentrations at receptors are presented in Table D4 (NO2) and Table D5
(PM10, PM2.5) of RS Annex D. As described in RS Annex D, following verification model
performance improved.
4.6.2 Impact of the Development on Local Air Quality
Nitrogen Dioxide
Table D4 in RS Annex D presents the predicted NO2 concentrations for the assessed
scenarios at the assessed receptor locations.
Table 4.10 shows the comparison of annual mean NO2 concentrations under the ‘S2
Without development 2021’ and ‘S3 With Development 2021’ scenarios at the assessed
receptor locations. The percentage changes in annual mean NO2 concentrations
relative to the air quality objective and the classification of impact magnitudes with
reference to the EPUK-IAQM guidance are also presented.
The maximum annual mean NO2 increase and air quality impact as a result of the
development is predicted to be 1.3g/m3 at R16 (residential property Bristol Road)
(3.3% change relative to the air quality assessment level (AQAL)). This 3.3% change
corresponds to a ‘negligible’ air quality impact, as the existing concentration isYou can also read