Ship-borne aerosol profiling with lidar over the Atlantic Ocean: from pure marine conditions to complex dust-smoke mixtures - Atmos. Chem. Phys
←
→
Page content transcription
If your browser does not render page correctly, please read the page content below
Atmos. Chem. Phys., 18, 9661–9679, 2018
https://doi.org/10.5194/acp-18-9661-2018
© Author(s) 2018. This work is distributed under
the Creative Commons Attribution 4.0 License.

Ship-borne aerosol profiling with lidar over the Atlantic Ocean:
from pure marine conditions to complex dust–smoke mixtures
Stephanie Bohlmann1,a , Holger Baars1 , Martin Radenz1 , Ronny Engelmann1 , and Andreas Macke1
1 Leibniz   Institute for Tropospheric Research, Permoserstraße 15, 04318 Leipzig, Germany
a now   at: Finnish Meteorological Institute, P.O. Box 1627, 70211, Kuopio, Finland

Correspondence: Stephanie Bohlmann (stephanie.bohlmann@fmi.fi)

Received: 19 January 2018 – Discussion started: 28 February 2018
Revised: 8 June 2018 – Accepted: 8 June 2018 – Published: 9 July 2018

Abstract. The multi-wavelength Raman lidar PollyXT has            rine values. The particle depolarisation ratio of dried marine
been regularly operated aboard the research vessel Polarstern     layers ranged between 4 and 9 % at 532 nm.
on expeditions across the Atlantic Ocean from north to south         Night measurements from PS95 and PS98 were used to
and vice versa. The lidar measurements of the RV Polarstern       illustrate the potential of aerosol classification using lidar
cruises PS95 from Bremerhaven, Germany, to Cape Town,             ratio, particle depolarisation ratio at 355 and 532 nm, and
Republic of South Africa (November 2015), and PS98 from           Ångström exponent. Lidar ratio and particle depolarisation
Punta Arenas, Chile, to Bremerhaven, Germany (April/May           ratio have been found to be the main indicator for particle
2016), are presented and analysed in detail. The latest set-up    type, whereas the Ångström exponent is rather variable.
of PollyXT allows improved coverage of the marine boundary
layer (MBL) due to an additional near-range receiver.
   Three case studies provide an overview of the aerosol
detected over the Atlantic Ocean. In the first case, marine       1   Introduction
conditions were observed near South Africa on the autumn
cruise PS95. Values of optical properties (depolarisation ra-     Aerosols, solid or liquid particles dispersed in air, play an
tios close to zero, lidar ratios of 23 sr at 355 and 532 nm)      important role in the Earth’s climate system. By scattering
within the MBL indicate pure marine aerosol. A layer of           and absorbing solar and terrestrial radiation, aerosols highly
dried marine aerosol, indicated by an increase of the particle    affect the radiation fluxes and thus the radiative budget. In
depolarisation ratio to about 10 % at 355 nm (9 % at 532 nm)      addition to this direct aerosol radiative forcing, aerosols also
and thus confirming the non-sphericity of these particles,        modify the microphysical properties of clouds by acting as
could be detected on top of the MBL. On the same cruise,          cloud condensation or ice nuclei and thereby influence the ra-
an almost pure Saharan dust plume was observed near the           diative budget indirectly (Twomey, 1977). Furthermore, the
Canary Islands, presented in the second case. The third case      presence of aerosol particles influences the lifetime of clouds
deals with several layers of Saharan dust partly mixed with       (Albrecht, 1989).
biomass-burning smoke measured on PS98 near the Cabo                 As the impact of aerosols on the climate system is vari-
Verde islands. While the MBL was partly mixed with dust           ous, it has to be considered in climate modelling to receive
in the pure Saharan dust case, an almost marine MBL was           accurate results, which is, however, challenging because not
observed in the third case.                                       all aerosol types contribute to the aerosol radiative forcing in
   A statistical analysis showed latitudinal differences in the   the same way (Ocko et al., 2012; Myhre et al., 2013) and,
optical properties within the MBL, caused by the down-            additionally, information about global aerosol distributions
mixing of dust in the tropics and anthropogenic influences in     is rare due to its high spatial and temporal variability. Thus,
the northern latitudes, whereas the optical properties of the     uncertainties in aerosol forcing and the poor understanding
MBL in the Southern Hemisphere correlate with typical ma-         of aerosol–cloud interactions represent a large uncertainty
                                                                  in current climate models despite the progress in observing

Published by Copernicus Publications on behalf of the European Geosciences Union.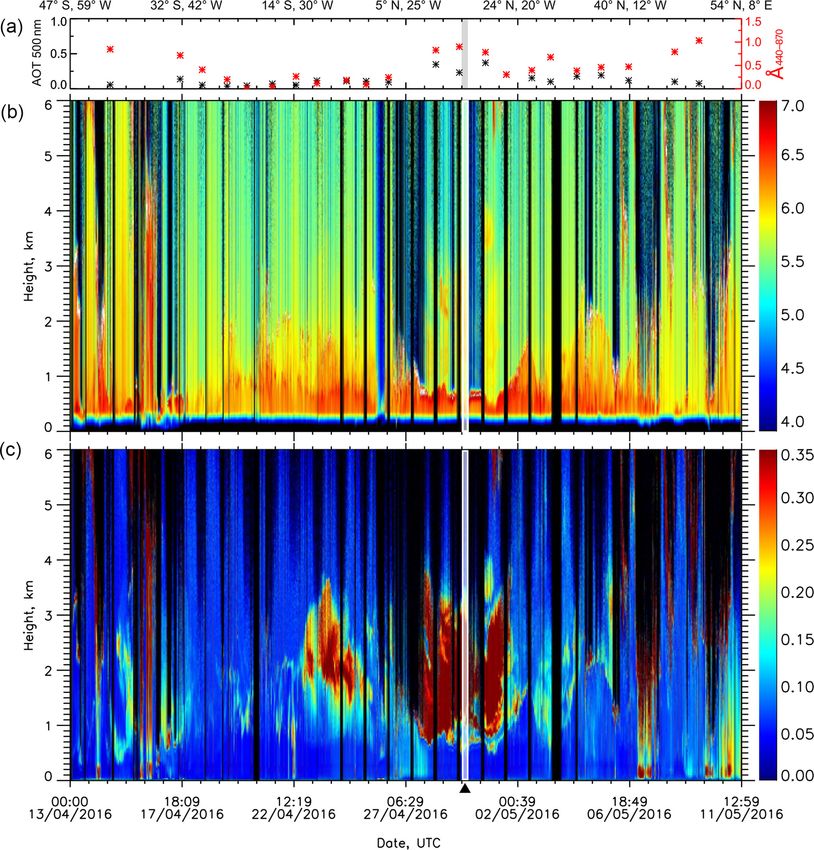
9662                                                               S. Bohlmann et al.: Aerosol profiling over the Atlantic Ocean

and modelling climate-relevant aerosol properties and atmo-
                                                                                      PS95
spheric distributions in the last years (IPCC, 2013). More
                                                                        60° N         PS98
information about the horizontal and vertical distribution of                                                    Bremerhaven
different aerosol types is needed to further improve climate
modelling and prediction and to understand its complex in-
teraction with the atmosphere. Therefore, the observation of
                                                                        30° N
the spatio-temporal aerosol distribution is an objective in a                                                2
wide range of research projects. Apart from satellite obser-                                             3
vations, most projects concentrate on observations over land.
Since about 70 % of the Earth’s surface is covered by water,               0°
aerosols and their distribution have to be investigated over the
oceans as well, even though the investigation is more chal-
lenging.
   Light detection and ranging (lidar) represents a key                 30° S                                           1
method to investigate vertically resolved aerosol properties.                                                          Cape Town
Measurements with high spatial and temporal resolution and
under ambient conditions are possible up to an altitude of
100 km depending on the lidar set-up (Wandinger, 2005).                 60° S Punta Arenas
                                                                            90° W   60° W             30° W          0°         30° E
Many institutes all over the world are performing lidar mea-
surements and create networks as shown in the 178th GAW                Figure 1. RV Polarstern cruises with PollyXT aboard. Cruise tracks
report (Bösenberg et al., 2007). While the Northern Hemi-              are taken from the Pangaea database (https://www.pangaea.de/
sphere is well covered with observation sites, there are only          expeditions/cr.php/Polarstern, last access: 24 February 2017). Black
a few lidar stations in the Southern Hemisphere. Over the              stars mark the location of the case studies presented in Sect. 3.2.
oceans, aerosol measurements are rare and to our knowl-
edge no regular, vertically resolved measurements allowing
aerosol typing are performed from ground. To close this                essential, as this knowledge is used in retrievals for space-
gap, the OCEANET project was initiated to investigate the              borne instruments like CALIPSO (Cloud-Aerosol Lidar and
transport of material and energy between the ocean and at-             Infrared Pathfinder Satellite Observation, Omar et al., 2009),
mosphere. The OCEANET project is a collective project of               which are able to investigate aerosols globally and thus also
several German research institutes and combines oceano-                over the ocean but with limited capabilities. As land-based
graphic measurements with atmospheric observations on a                observations of aerosols mostly do not allow observation
ship-borne platform. It is regularly deployed on research ves-         of pure marine conditions, only ship-borne observations are
sels (RV), such as the RV Polarstern. One instrument within            suited to make detailed studies of the marine environment
the OCEANET facility is the portable and automated Ra-                 found over the oceans. PollyXT has been further developed
man and polarisation lidar system PollyXT (Althausen et al.,           since these first cruises. The latest set-up (Engelmann et al.,
2009; Engelmann et al., 2016). This lidar system allows                2016) possesses now, in addition to the original capabilities,
aerosol typing and investigations of the atmosphere up to              four near-range channels and depolarisation measurements
about 20 km.                                                           at two wavelengths. Due to a new near-range detection unit,
   The first cruise with PollyXT on the RV Polarstern took             the height of complete overlap between the receiver field of
place in 2009. Since then, eight cruises have been performed           view and laser beam was reduced from about 1500 to 120 m
on the RV Polarstern between Bremerhaven and Punta Are-                and now enables measurements close to the lidar. Observa-
nas and between Bremerhaven and Cape Town until sum-                   tions with this advanced lidar set-up over the ocean offer the
mer 2016, covering almost the whole north–south extension              unique opportunity to investigate the MBL in addition to the
of the Atlantic Ocean. Typical cruise tracks are shown in              aerosol conditions in the free troposphere, which was not
Fig. 1. These measurements therefore represent a valuable              possible until now. In this paper three case studies covering
contribution to the knowledge of distribution and variability          typical aerosol conditions during the cruises PS95 and PS98
of aerosols over the Atlantic. The first cruises have already          will be discussed to investigate the whole atmospheric col-
been analysed by Kanitz et al. (2013, 2014). Saharan dust              umn above the ship. A statistical analysis is presented con-
and mixtures of biomass-burning smoke and dust were ob-                trasting the zonal dependence of the aerosol conditions over
served at the west coast of North Africa as well as Patagonian         the Atlantic. In Sect. 2 the Raman lidar PollyXT , the aerosol
dust over the South Atlantic. The lidar system used for these          characterisation by optical properties, and the respective data
measurements did not cover the lowermost 500–800 m of                  analysis methods are briefly introduced. Section 3 gives an
the troposphere; therefore, the marine boundary layer (MBL)            overview of the lidar measurements during PS95 and PS98,
could not be investigated. However, the investigation of op-           discusses the case studies, and shows a statistical analysis of
tical and microphysical properties of pure marine aerosol is           both cruises. In Sect. 4 the results are summarised.

Atmos. Chem. Phys., 18, 9661–9679, 2018                                                  www.atmos-chem-phys.net/18/9661/2018/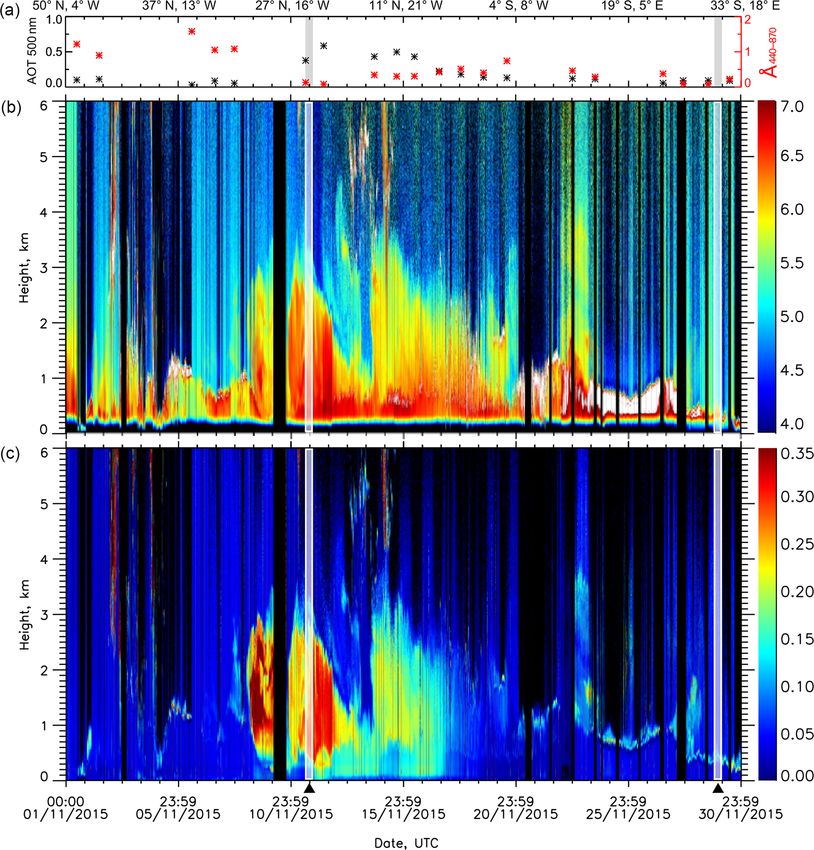
S. Bohlmann et al.: Aerosol profiling over the Atlantic Ocean                                                                 9663

2   Instrument and methods                                          gelmann et al. (2016) and are based on well established li-
                                                                    dar retrievals (Klett, 1981; Fernald, 1984; Ansmann et al.,
The lidar measurements during the Atlantic cruises were per-        1992; Murayama et al., 1999). All instrumental effects (dead-
formed with the portable Raman and polarisation lidar sys-          time correction, overlap correction, background subtraction)
tem PollyXT –OCEANET. A detailed description of the opti-           have been considered and the high-quality standards of EAR-
cal set-up can be found in Althausen et al. (2009) and Engel-       LINET (European Aerosol Research Lidar Network; Pap-
mann et al. (2016).                                                 palardo et al., 2014) have been applied to characterise the
   The latest set-up of PollyXT –OCEANET enables the mea-           instrument.
surement of backscatter coefficient profiles at 355, 532,              For the data analysis in this study vertical smoothing
and 1064 nm and extinction coefficient profiles at 355 and          lengths between 127 and 457 m were applied depending on
532 nm. Furthermore, depolarisation measurements at 355             the signal-to-noise ratio. Details are given within the figures.
and 532 nm are possible. A second detection unit enables            GDAS1 (Global Data Assimilation System) data were used
measurements near the lidar at 355 and 532 nm and the corre-        for the data analysis as soundings upon RV Polarstern were
sponding Raman wavelengths 387 and 607 nm down to about             only launched once a day during noon. The marine boundary
120 m above the lidar (Engelmann et al., 2016).                     layer top is determined following the procedure described in
   The backscatter coefficient β describes the amount of the        Baars et al. (2008).
light backscattered to the lidar at an angle of 180◦ . The at-
tenuation of the emitted light due to absorption and scatter-
ing on the way through the atmosphere is described by the           3     Results
extinction coefficient α. The ratio of extinction to backscat-
                                                                    3.1    Lidar observations during RV Polarstern cruises
ter coefficient is called lidar ratio S. As the extinction is the
                                                                           across the Atlantic
attenuation of light due to scattering and absorption, the lidar
ratio can be used to determine the absorbing capacity of the        The temporal development of the range-corrected signal (i.e.
backscattering particles. Absorbing aerosols like soot have         the uncalibrated attenuated backscatter signal) of the autumn
a much higher lidar ratio than non-absorbing particles like         transit cruise PS95 is shown in Fig. 2b. RV Polarstern de-
sea salt (Müller et al., 2007; Groß et al., 2011). The relation-    parted on 29 October 2015 from Bremerhaven (Germany)
ship of the backscatter or extinction coefficient at two wave-      and arrived on 1 December 2015 at Cape Town (Republic
lengths λ1 , λ2 as a function of the ratio of these wavelengths     of South Africa). The first days of this cruise were charac-
is given by the backscatter or extinction-related Ångström          terised by low-level clouds and rain indicated by high sig-
exponent Å (Ångström, 1929). It indicates the particle size.        nals (white colours). On 9 November (33◦ N), the lidar could
Small particles show a strong wavelength dependence; thus,          detect a lofted plume of Saharan dust above the MBL be-
Å is greater than 1. In contrast, the scattering on large par-      tween 600 m and 3 km height. From 12 November (24◦ N),
ticles is almost wavelength independent and Å is approxi-           increasing depolarisation in the MBL could be observed
mately zero (Eck et al., 1999; Müller et al., 2007; Baars et al.,   (Fig. 2c) resulting from deposition and down-mixing of dust
2016).                                                              from higher altitudes. The dust top height decreased from
   The emitted laser light of the PollyXT lidar is linear po-       2.8 km on 11 November down to 1.5 km on 13 November.
larised. In the atmosphere, the light is depolarised when scat-     About noon on 14 November 2015, a new dust plume with
tered by non-spherical particles like dust or ice crystals. The     a lower volume depolarisation ratio and a dust top height
detected light therefore contains a cross-polarised compo-          of 3.5 km was observed. RV Polarstern steadily moved to-
nent in addition to the parallel-polarised light and can be         wards the equator so that the dust region was left behind in
detected separately. The ratio of cross-polarised to parallel-      the night from 17 to 18 November (3◦ N). After entering the
polarised light backscattered by particles is called particle de-   Southern Hemisphere on 19 November, marine stratocumu-
polarisation ratio. If the particles are mainly spherical, the      lus clouds occurred frequently. Around noon on 23 Novem-
particle depolarisation ratio is about zero because the lin-        ber (10◦ S), minor traces of dust between 1 and 4 km could
ear polarised light has been returned to the lidar without          be observed again. Considering HYSPLIT trajectories (not
changing the polarisation state. Non-spherical particles show       shown), these depolarising layers could consist of dust from
higher depolarisation ratios. This quantity therefore enables       the Kalahari Desert. From 24 November (12◦ S) onwards,
the determination of the particle sphericity.                       the sky was mostly overcast. At the end of the cruise, on
   Ångström exponent, lidar ratio, and depolarisation ratio         29 and 30 November, almost pure marine conditions could
are indicators of the aerosol type. By knowing typical values       be observed. The 500 nm aerosol optical thickness (AOT;
of the lidar ratio, Ångström exponent, and particle depolari-       Fig 2a), measured with a Microtops sun photometer, ranged
sation ratio, the dominant particle type can be specified.          around 0.1 on the Northern Hemisphere, increased in the
   The retrieval of those lidar-derived parameters from             dust-influenced northern tropics to around 0.5, and decreased
PollyXT measurements and the corresponding error estima-            below 0.1 in the Southern Hemisphere.
tion are described in detail by Baars et al. (2016) and En-

www.atmos-chem-phys.net/18/9661/2018/                                                Atmos. Chem. Phys., 18, 9661–9679, 2018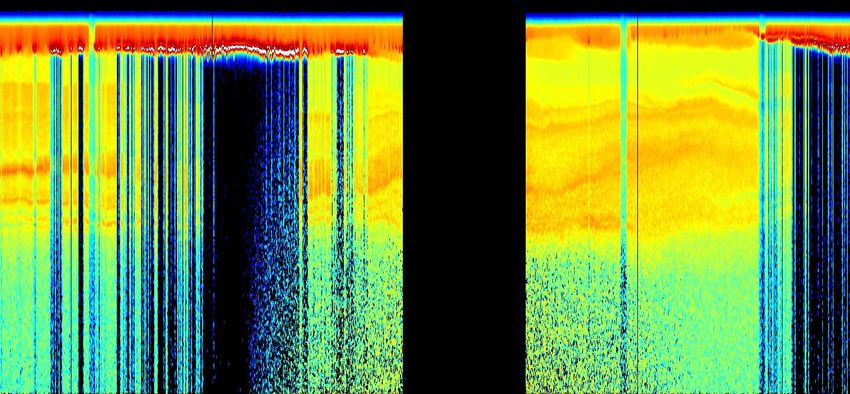
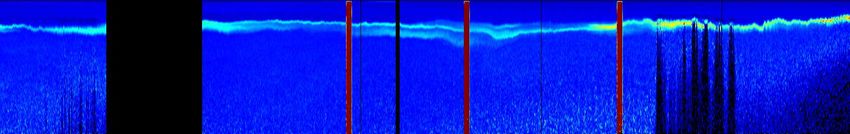
9664                                                              S. Bohlmann et al.: Aerosol profiling over the Atlantic Ocean

Figure 2. Observational overview of the autumn cruise PS95 from Bremerhaven to Cape Town. Time series of the 500 nm daily mean
AOT and daily mean 440–870 nm Ångström exponent derived with Microtops sun-photometer measurements (a), height–time display of the
1064 nm range-corrected lidar signal (b), and the volume depolarisation ratio at 532 nm (c). White bars mark the case studies discussed in
Sect. 3.2.

   The spring transit cruise PS98 started on 11 April 2016 in          by low clouds and rain. From 22 April (12◦ S) to 25 April
Punta Arenas (Chile) and ended on 11 May 2016 in Bremer-               (4◦ S), a lofted dust plume between 1.5 km and 3.5 km height
haven. Time series of the range-corrected signal and volume            could be detected. Crossing the Intertropical Convergence
depolarisation ratio at 532 nm are shown in Fig. 3. Because            Zone (at around 5◦ N) on the 27 and 28 April, thunderstorms,
of a failure of the 1064 nm photomultiplier tube (PMT), no             rain showers, and clouds with low base heights were pre-
measurements at this wavelength were available. After start-           dominant. After leaving this region, the lidar observed Saha-
ing regular measurements in the night from 12 to 13 April,             ran dust above the marine boundary layer again. The bottom
the weather was dominated by clouds. In the night from 14              height of the dust layer decreased from 1.5 km on 22 April
to 15 April (40◦ S), thin depolarising layers at around 2.5 km         down to around 600 m on 30 April. In the afternoon of 1 May
could be observed. According to HYSPLIT backward trajec-               (23◦ N), RV Polarstern left the dust region. After a short stop
tories (not shown), the air mass originated from the Patago-           at the port of Las Palmas (Gran Canaria, Spain) on 3 May, the
nian region; thus, the layers could contain traces of Patago-          cruise was continued towards the European continent and the
nian dust. Observations on 16 and 17 April were dominated              aerosol conditions were more and more influenced by anthro-

Atmos. Chem. Phys., 18, 9661–9679, 2018                                                  www.atmos-chem-phys.net/18/9661/2018/
S. Bohlmann et al.: Aerosol profiling over the Atlantic Ocean                                                                            9665

Figure 3. Same as Fig. 2 but for the spring cruise PS98 from Punta Arenas to Bremerhaven. Due to the failure of the 1064 nm channel, the
532 nm range-corrected signal is shown in the middle panel. The white bar indicates the time period of the case study discussed in Sect. 3.2.3.

pogenic sources. From 6 May onwards, mostly overcast sky                  the Northern Hemisphere than in the Southern Hemisphere,
with small cloud gaps was predominant. The AOT at 500 nm                  which indicates a higher aerosol load in the former.
(Fig. 3a) showed a similar zonal behaviour as on the PS95
cruise. The AOT at 500 nm was below 0.1 in the Southern                   3.2   Case studies
Hemisphere, except for 17 April, and steadily increased to
the maximum of 0.37 on 30 April. After leaving the dust-
influenced region, the AOT ranged between 0.1 and 0.2 in                  Three night measurements from PS95 and PS98 were se-
the Northern Hemisphere.                                                  lected to present typical atmospheric conditions by means
   Regular cruises across the Atlantic Ocean from north to                of a detailed discussion of the optical properties in the MBL
south in the northern hemispheric autumn and from south                   and in lofted layers. First, almost pure marine conditions with
to north in the northern hemispheric spring provided a large              an overlying dried marine aerosol layer during the autumn
amount of lidar data over the Atlantic. Dust has been reg-                cruise PS95 are discussed. Second, a case study on the same
ularly observed in the northern tropics and subtropics west               cruise but with Saharan dust near the Canary Islands is pre-
of the Saharan desert. The AOT at 500 nm, measured with                   sented. Third, a case during the spring cruise in 2016 (PS98)
a Microtops sun photometer, has been slightly higher in                   with Saharan dust and biomass-burning aerosol mixtures
                                                                          near the Cabo Verde islands is shown. These three case stud-

www.atmos-chem-phys.net/18/9661/2018/                                                       Atmos. Chem. Phys., 18, 9661–9679, 2018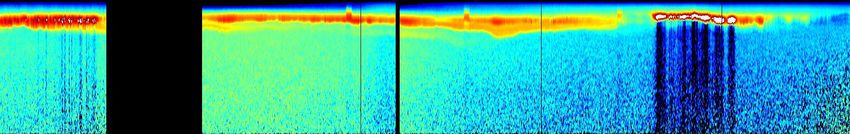
9666 S. Bohlmann et al.: Aerosol profiling over the Atlantic Ocean
(a) 29° S, 12° E 29° S, 12° E 30° S, 13° E 30° S, 14° E 31° S, 14° E 31° S, 15° E 32° S, 16° E
0.15 0.4
AOT 500 nm
Å440−870
0.10
0.2
0.05
0.00 0.0
(b)
(c)
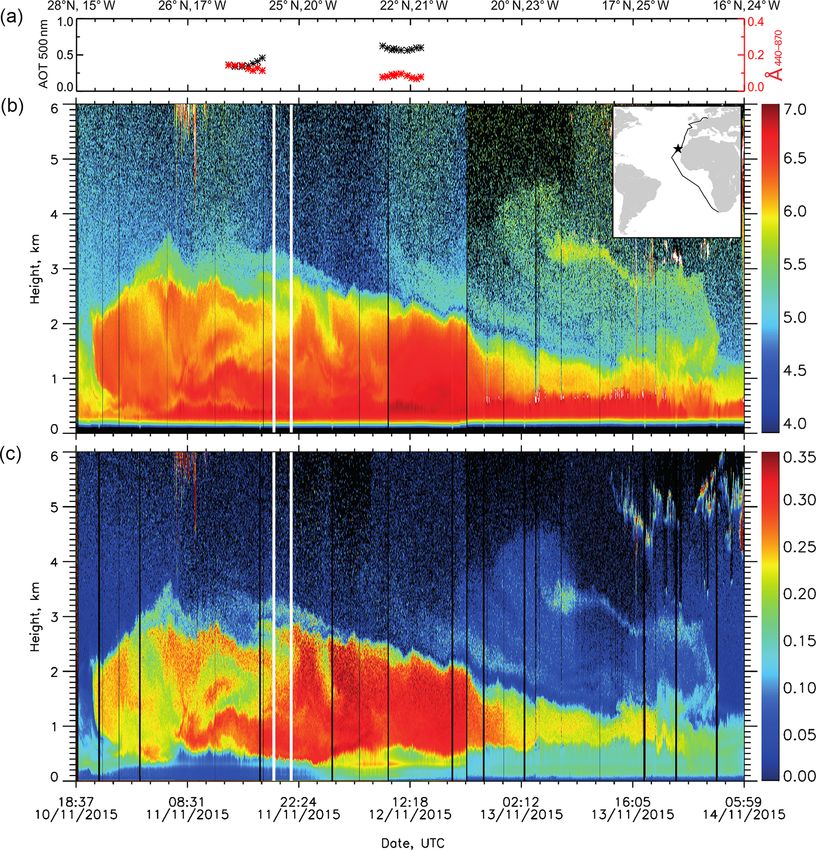
Figure 4. Marine conditions during PS95: time series of the Microtops sun-photometer-derived AOT at 500 and 440/870 nm Ångström
exponent (a), 1064 nm range-corrected signal (b), and 532 nm volume depolarisation ratio (c). Vertical white lines indicate the signal-
averaging period for profiles shown in Fig. 5. The black star in the cruise map shows the location of RV Polarstern during this period.
ies are marked with black stars on the cruise tracks (Fig. 1) panel. Mean AOT at 500 nm of 0.09 ± 0.01 on 29 November
and with white lines in the cruise overviews (Fig. 2, 3). (0.09 ± 0.02 on 30 November) and an Ångström exponent
of 0.08 ± 0.02 (0.23 ± 0.08) clearly indicate marine condi-
3.2.1 PS95 – marine aerosol conditions tions for remote oceanic areas, not influenced by continental
aerosol sources. In these regions, the AOT at 500 nm is typ-
On 29 and 30 November 2015 at the end of the cruise PS95, ically below 0.1 and the Ångström exponent less than 0.4
clean conditions could be observed near Cape Town. In this (Smirnov et al., 2006).
area, the dominant aerosol was of marine origin according to The time series of the volume depolarisation ratio (Fig. 4b)
CALIPSO aerosol classification (Omar et al., 2009). shows a thin layer of enhanced depolarisation at the top of
In Fig. 4, the time series of the range-corrected signal the MBL at 300–400 m. This layer consists of dried marine
at 1064 nm and the volume depolarisation ratio at 532 nm particles and will be discussed later in this section.
from 29 and 30 November 2015 are shown. Additionally, the Mean profiles of the measured optical properties are
AOT at 500 nm and the Ångström exponent at 440/870 nm shown in Fig. 5 for 30 November 01:15–02:30 UTC. In
by sun-photometer measurements are shown in the upper the right panel, GDAS1 and radio sounding profiles are
Atmos. Chem. Phys., 18, 9661–9679, 2018 www.atmos-chem-phys.net/18/9661/2018/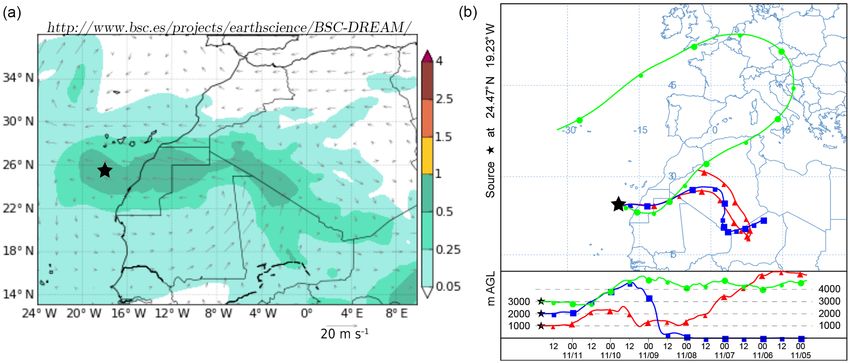
S. Bohlmann et al.: Aerosol profiling over the Atlantic Ocean                                                                                                 9667

Figure 5. Profiles averaged for 30 November 2015, 01:15–02:30 UTC. Backscatter coefficient and depolarisation ratios are smoothed with
127.5 m vertical length. Extinction coefficients, lidar ratios, and Ångström exponents are smoothed with 127.5 up to 242 m and afterwards
with 367.5 m. Meteorological data from GDAS1 (30 November 2015, 00:00 UTC) and radio sounding measurements (29 November 2015,
12:00 UTC) are also presented.

shown. The temperature inversion and decrease of the rel-
ative humidity (RH) as well as the strong decrease of the
                                                                                                                                         -30
                                                                       at 31.48° S 14.51° E

backscatter signal (Baars et al., 2008) suggest the MBL top
height at about 300 m. Within the MBL, the lidar ratio was
23 ± 2 sr at 355 and 23 ± 1 sr at 532 nm, which agrees with
                                                                                                                                     -35
results during the second Aerosol Characterization Experi-
ment ACE-2 (S532 23 ± 3 sr; Müller et al., 2007) and are                                      0       5       10      15      20               25
                                                                                                                                                    30
slightly higher than results of the Saharan Mineral Dust                                                                                                 35

Experiment SAMUM-2a (S532 18 ± 4 sr and S355 18 ± 2 sr;                                                                             -40
                                                                       Source

Groß et al., 2011).
   The special highlight in this case study is the increase
of the depolarisation ratio at the top of the MBL, whereas                                                                         -45

the lidar ratio within this layer is low, 16 ± 1 sr (355 nm)
and 13 ± 3 sr (532 nm). Thus, this layer cannot consist of
biomass-burning aerosol or dust mixtures. The particle de-                                                                         -50
                                                                           Meters AGL

polarisation ratios at 355 and 532 nm are around zero in the                                                                                              5000
                                                                                                                                                          4000
MBL (large, spherical particles) and increase from 300 to                                                                                                 3000
about 450 m, shortly above the MBL top. After this peak,                                                                                                  2000
                                                                                              1000                                                        1000
the depolarisation decreases to about zero again. Consider-                                    300
                                                                                                      00 18 12 06 00 18 12 06 00 18 12 06 00 18 12 06
ing the profiles of relative humidity and temperature, a cor-                                        11/30       11/29       11/28       11/27

relation with the relative humidity is obvious. The relative
                                                                       Figure 6. NOAA HYSPLIT backward trajectories for 4 days ending
humidity decreases from about 90 % near the ground to un-
                                                                       at the position of RV Polarstern (31.48◦ S, 14.51◦ E; marked by
der 20 % above 600 m. In the layer the RH is about 50 % ac-
                                                                       the black star) on 30 November 2015, 02:00 UTC, at 300, 600, and
cording sounding data and about 40 % according to GDAS1.               1000 m a.g.l.
Simultaneously the temperature increases. HYSPLIT back-
ward trajectories (Fig. 6) indicate that the air parcels arriving
at 300, 600, and 1000 m had only been carried over the South
Atlantic Ocean the last 7 days; thus, it can be assumed that           cence relative humidity, which is around 70–74 % depend-
the air mass contains mostly marine aerosol, e.g. sea salt.            ing on the composition of the sea salt (Tang et al., 1997).
Sea salt aerosol exists as dry particles at low relative humid-        If the RH decreases to the crystallisation relative humidity
ity. Since sea salt is hygroscopic, the salt particles absorb          (45–48 %; Tang et al., 1997), the particles crystallise from
water to form droplets when the RH exceeds the deliques-               the droplet. At a RH above the crystallisation relative hu-
                                                                       midity, the sea salt particles are in solution with water and

www.atmos-chem-phys.net/18/9661/2018/                                                                        Atmos. Chem. Phys., 18, 9661–9679, 2018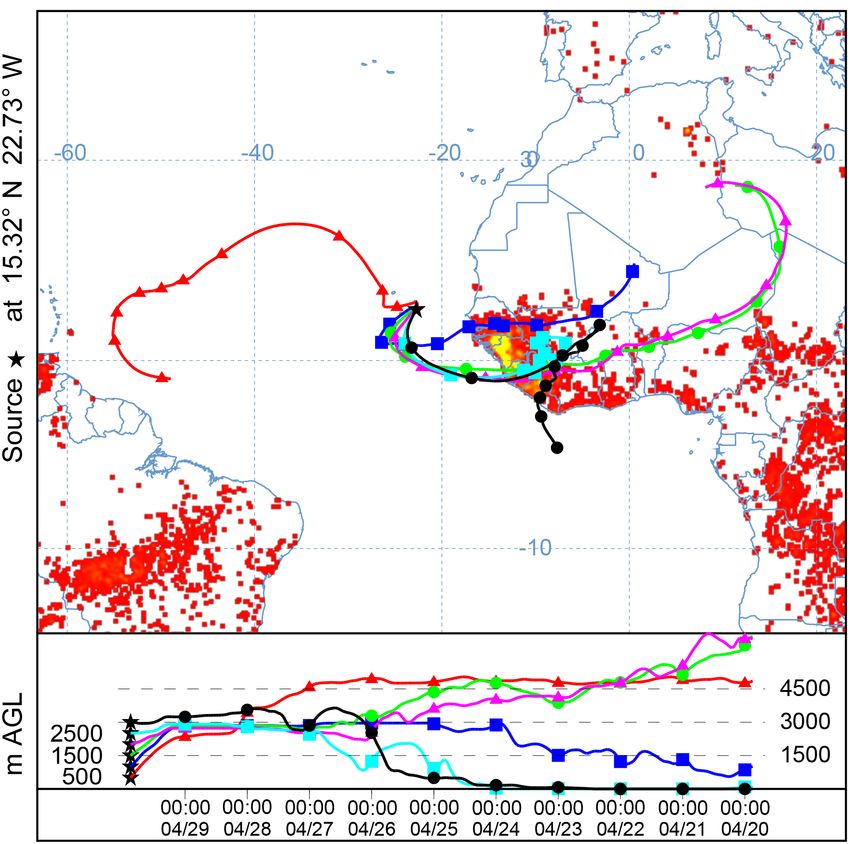
9668                                                               S. Bohlmann et al.: Aerosol profiling over the Atlantic Ocean

Figure 7. (a) Column-integrated dust concentration (g m2 ) and 3000 m wind on 11 November 2015, 12:00 UTC, from the BSC-
DREAM8b model (Dust Regional Atmospheric Model), operated by the Barcelona Supercomputing Center (http://www.bsc.es/ess/
bsc-dust-daily-forecast, last access: 14 November 2016). (b) The 7-day NOAA HYSPLIT backward trajectories ending at the position
of RV Polarstern on 11 November 2015, 20:00 UTC (24.27◦ N, 19.23◦ W). The position of RV Polarstern is marked by the black star.

show low values of δ ≈ 3 % (Tesche et al., 2011a). When the            EarthCARE, and other lidars should take these feature into
RH is below the crystallisation relative humidity, the sea salt        account, if relative humidity measurements are available, to
particles crystallise and exist as non-spherical particles due         not misclassify these aerosols as, for example, mixed dust.
to the cubic shape of NaCl, the main constituent of sea salt
aerosol (Zieger et al., 2017). As non-spherical particles they         3.2.2   PS95 – Saharan dust
cause higher depolarisation ratios. In this case, dried sea-salt
particles caused depolarisation ratios up to 9 % at 532 nm             When RV Polarstern approached the Canary Islands during
and 10 % at 355 nm. Previous studies showed similar results.           the autumn cruise 2015, the first dust plume was observed in
Murayama et al. (1999) measured high depolarisation ratios             the evening of 10 November at around 28◦ N. The dust could
(≈ 10 %) at 532 nm in the lower atmosphere associated with             be measured until 14 November.
sea breeze events in the coastal area of Tokyo Bay. During the            Figure 7a presents the column-integrated concentration on
Saharan Aerosol Long-range Transport and Aerosol-Cloud-                11 November 2015, 12:00 UTC, from the BSC-DREAM8b
Interaction Experiment (SALTRACE) winter campaign 2014                 model, operated by the Barcelona Supercomputing Center.
at Barbados, Haarig et al. (2017) detected an increase of the          The increased column dust load above the Atlantic at the po-
particle depolarisation ratio up to 12 % at 355 nm, 15 % at            sition of RV Polarstern is illustrated by dark green colour.
532 nm, and 10 % at 1064 nm when the RH drops below                    According to HYSPLIT backward trajectories (Fig. 7b), the
50 %. Sakai et al. (2000) observed low depolarisation ratios           air mass measured on 11 November 20:00 UTC originated
(< 5 %) at 532 nm over a wide range of relative humidities,            from the Saharan desert. Only air masses that arrived at 3 km
whereas δ par > 10 % was measured at low RH (< 50 %) in                had been carried also over European areas in the last 7 days.
air masses which had passed over the Pacific Ocean. In a lab-             The range-corrected signal at 1064 nm and the 532 nm vol-
oratory chamber experiment, Sakai et al. (2010) found lin-             ume depolarisation ratio of the first dust plume are shown
ear depolarisation ratios at 532 nm of 1 ± 0.1 % for droplets,         in Fig. 8. Additionally, sun-photometer measurements from
8 ± 1 % for sea salt crystals, and 21 ± 2 % for NaCl crystals.         11 and 12 November are given. The sun-photometer-derived
   Thus, we can conclude that marine particles were trans-             Ångström exponent at 440/870 nm is 0.13 on 11 November
ported above the MBL top, dried, and crystallised and there-           and 0.08 for the day after. The daily averaged AOT at 500 nm
fore cause a high particle depolarisation ratio even though            for these days is 0.38 (11 November) and 0.58 (12 Novem-
the backscattering is low compared to the MBL.                         ber). The dust layer reached heights about 3 to 3.5 km on
   This case confirms that marine aerosol can cause depolar-           11 November and slightly descended towards 14 November.
isation in the lidar signal when RH is low. Without consider-          From 13 November lofted layers between 2 and 3.5 km with
ing this property of marine aerosol, aerosol layers above the          a lower depolarisation ratio than the first dust plume could be
MBL causing depolarisation may be falsely classified. Auto-            observed.
matic classification algorithms like the ones for CALIPSO,

Atmos. Chem. Phys., 18, 9661–9679, 2018                                                 www.atmos-chem-phys.net/18/9661/2018/
S. Bohlmann et al.: Aerosol profiling over the Atlantic Ocean                                                                           9669

Figure 8. First dust event observed during PS95: time series of the Microtops sun-photometer-derived AOT (500 nm) and 440/870 nm
Ångström exponent (a), 1064 nm range-corrected signal (b), and 532 nm volume depolarisation ratio (c). Vertical white lines indicate the
signal-averaging period for profiles shown in Fig. 9. The black star in the cruise map shows the location of RV Polarstern during this period.

   Averaged profiles of the measured optical properties and              campaign in Senegal (Veselovskii et al., 2016). According
radio sounding and GDAS1 profiles of temperature and rel-                to Veselovskii et al. (2016), this spectral behaviour may be
ative humidity are shown in Fig. 9 for 11 November 19:30–                caused by specific refractive index characteristics induced
21:00 UTC (white frame in Fig. 8). Backscatter profiles show             by the chemical composition of the particles. The mean li-
an increased backscatter coefficient at all wavelengths from             dar ratio at 532 nm (355 nm) in the height of the lofted
the MBL top (around 400 m) up to 2.8 km. The backscat-                   aerosol layer is 53 ± 2 sr (61 ± 4 sr). The lidar ratio at 355 nm
ter coefficient at 532 nm is larger than at 355 nm, whereas              is higher than at 532 nm, which results from the higher
the extinction coefficient is wavelength independent. Even               backscatter coefficient at 532 nm and agrees with values
though this is an atypical spectral behaviour, comparable ob-            found for dust during the SHADOW campaign (Veselovskii
servations of higher 532 nm than 355 nm backscatter coef-                et al., 2016). Consequently, the mean backscatter-related
ficient have already been observed in dust layers near the               355/532 nm Ångström exponent is negative (−0.4 ± 0.1).
Cabo Verde islands (Rittmeister et al., 2017), in the east-              Negative backscatter-related Ångström exponents are gener-
ern Mediterranean at Crete (Tsekeri et al., 2017), and during            ally found when scattering properties of dust are modelled
the SHADOW (Study of SaHAran Dust Over West Africa)                      by assuming a spheroidal shape distribution. The values then

www.atmos-chem-phys.net/18/9661/2018/                                                       Atmos. Chem. Phys., 18, 9661–9679, 2018
9670 S. Bohlmann et al.: Aerosol profiling over the Atlantic Ocean
Figure 9. Profiles averaged for 11 November 2015, 19:30–21:00 UTC. Dust fraction calculated following Tesche et al. (2009). Radio sound-
ing profiles from 11 November 2015, 12:00 UTC, and GDAS1 profiles (11 November 2015, 18:00 UTC) are presented in the right panel.
typically vary between −0.5 and −2 depending on the as- tion ratio at 532 nm as well as Microtops sun-photometer
sumptions of the spectral refractive index and the size and measurements on 29 April 2016 are shown in Fig. 10.
shape distributions. The extinction-related Ångström expo- Sun-photometer measurements determined an average AOT
nent at 355/532 nm of 0.1 ± 0.5 and the backscatter-related at 500 nm of 0.23 and an Ångström exponent of 0.9 for
Ångström exponent at 532/1064 nm of 0.4 ± 0.1 are in good 440/870 nm.
agreement with values for dust measured during SAMUM- An increased backscatter coefficient at both wavelengths
355/532 532/1064 indicates aerosol layers between 0.9 and 3 km. These layers
2b (Åext ≈ 0.22 ± 0.27, Åbsc ≈ 0.45 ± 0.16; Tesche
et al., 2011a). Furthermore, the aerosol layer between 600 m are separated from the MBL, which reached a height of about
and 2.8 km is characterised by a nearly height-constant parti- 500 m according to the increased backscatter signal and the
cle depolarisation ratio of 29 ± 1 % at 532 nm and 25 ± 1 % GDAS1 and radio sounding data. The mean lidar ratio at
at 355 nm. The increased particle depolarisation ratios indi- 355 nm is 22 ± 1 sr, the mean backscatter-related 355/532 nm
cate a non-spherical particle shape and are in good agree- Ångström exponent is 0.9 ± 0.0, and the mean particle depo-
ment with values found for pure dust during SAMUM-2a larisation ratios are around zero at both wavelengths in the
par par MBL. These values are indicators of a pure marine boundary
(δ532 ≈ 30 % and δ355 ≈ 25 %; Groß et al., 2011; Tesche
et al., 2011a). The fraction of dust and smoke can be esti- layer without dust (see marine case, Sect. 3.2.1).
mated using a method described by Tesche et al. (2009). As- Mean profiles of the optical properties averaged from
par 29 April 2016 between 20:15 and 21:00 UTC are shown
suming a δ532 of 31 % for pure dust and 5 % for smoke, the
fraction of dust in this layer amounts to over 90 % (Fig. 9, in Fig. 11. Regarding the backscatter profile, the aerosol-
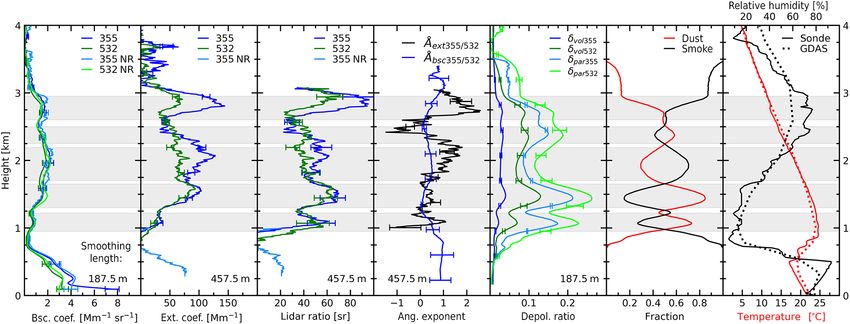
panel 6) and can therefore be considered as pure dust. laden region above the MBL can be divided into five lay-
The MBL reached a height of about 400 m according to the ers. The layers extend from 0.9 to 1.2, 1.3 to 1.6, 1.7 to 2.2,
backscatter profile. Lidar ratios at 532 and 355 nm are 30 ± 3 2.3 to 2.5, and from 2.6 to 3.0 km and are marked grey in
and 30 ± 2 sr in the MBL, which are higher than the char- Fig. 11. The 532 nm near-range extinction coefficient and li-
acteristic values for marine aerosol (see marine case study dar ratio was not reliable because of a misalignment of the
Sect. 3.2.1) and suggest a mixture of marine aerosol with 532 nm near-range channel which does not affect the Ra-
other particles. Particle depolarisation ratios are also slightly man backscatter retrievals. The mean lidar ratio in the first
higher, 9 % at 532 nm and 6 % at 355 nm, and indicate the layer is 48 ± 4 and 46 ± 9 sr at 532 and 355 nm, respec-
mixing of dust into the MBL. Therefore, also the MBL is in- tively. The mean backscatter-related 355/532 nm Ångström
fluenced by the frequent dust emission in the Saharan desert. exponent is 0.4 ± 0.1 and ranges between the typical values
of dust (0.16 ± 0.45, SAMUM-2b) and smoke (0.90 ± 0.26,
3.2.3 PS98 – mixed aerosol layers SAMUM-2a; Tesche et al., 2011b). The same applies for
the mean particle depolarisation ratio, which is 20 ± 2 % at
During the spring cruise PS98, extended aerosol layers with 532 nm and 15 ± 2 % at 355 nm. These values are in good
enhanced depolarisation were observed near the Cabo Verde agreement with values for dust and smoke mixtures mea-
par
islands. The range-corrected signal and volume depolarisa- sured during SAMUM-2a (δ355,532 ≈ 16 %; Tesche et al.,
Atmos. Chem. Phys., 18, 9661–9679, 2018 www.atmos-chem-phys.net/18/9661/2018/S. Bohlmann et al.: Aerosol profiling over the Atlantic Ocean 9671
(a) 12° N, 24° W 13° N, 24° W 14° N, 24° W 14° N, 23° W 15° N, 23° W 15° N, 23° W 16° N, 22° W
1.0 1.5
AOT 500 nm
Å 440−870
1.0
0.5
0.5
0.0 0.0
(b)
(c)
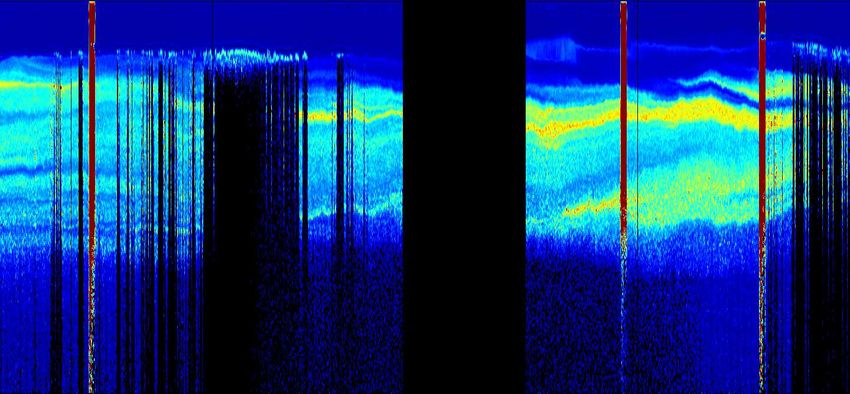
Figure 10. Complex aerosol layering with smoke and dust on PS98: sun-photometer-derived AOT at 500 and 440/870 nm Ångström expo-
nent (a), 532 nm range-corrected signal (b), and volume depolarisation ratio (c). Vertical white lines indicate the signal-averaging period for
profiles shown in Fig. 11. The black star in the cruise map shows the location of RV Polarstern during this period.
2011a) and represent a dust fraction of 63 %, applying the respectively. This indicates the presence of small, absorb-
method described by Tesche et al. (2009), which is shown in ing particles. The particle depolarisation ratio, 13 ± 1 % at
Fig. 11 (panel 6). 532 nm and 9 ± 1 % at 355 nm, is small compared to the other
The second layer extends from 1.3 to 1.6 km. The mean layers. Therefore, it can be concluded that this layer con-
lidar ratio is 57 ± 7 and 63 ± 8 sr at 532 and 355 nm, re- tains a significant amount of non-depolarising particles like
spectively. Mean backscatter and extinction-related Å at smoke. According to Tesche et al. (2009) the fraction of dust
355/532 nm amount 0.1 ± 0.1 and 0.4 ± 0.2, respectively. is only around 35 %.
The mean particle depolarisation ratio of 24 ± 2 % at 532 nm Between 2.3 and 2.5 km, in the fourth layer, the par-
and 19 ± 2 % at 355 nm suggests a mixture of depolarising ticle depolarisation ratio rises again (18 ± 1 % at 532 nm,
dust and non-depolarising smoke with a dust fraction of 77 % 14 ± 3 % at 355 nm). The mean lidar ratio is 40 ± 11 sr
following Tesche et al. (2009). at 355 nm and 42 ± 3 sr at 532 nm. The mean backscatter
In the third layer, the mean lidar ratio is 40 ± 6 sr at and extinction-related Å at 355/532 nm is 0.26 ± 0.06 and
532 nm and 50 ± 6 sr at 355 nm. The mean backscatter and 0.08 ± 0.80. According to Tesche et al. (2009) the fraction
extinction-related Å at 355/532 nm is 0.4 ± 0.1 and 1 ± 0.4, of dust in this layer is around 55 %.
www.atmos-chem-phys.net/18/9661/2018/ Atmos. Chem. Phys., 18, 9661–9679, 20189672 S. Bohlmann et al.: Aerosol profiling over the Atlantic Ocean
Figure 11. Averaged profiles for 29 April 2016, 20:15–21:00 UTC. Dust and smoke fractions calculated following Tesche et al. (2009).
Meteorological data from GDAS1 (29 April 2016, 21:00 UTC) and radio sounding measurements (29 April 2016, 15:00 UTC). Layers are
marked grey.
The fifth layer is characterised by a high lidar ratio up
to 88 sr at 532 nm and 68 sr at 355 nm and high backscatter
and extinction-related Ångström exponents of 0.4 ± 0.2 and
1.6 ± 0.6, respectively. Particle depolarisation ratios decrease
with increasing height and amount around 16 % at 532 nm
(13 % at 355 nm) at the lower edge and 8 % at 532 nm (5 % at
355 nm) at the top. Using the dust–smoke separation method
described by Tesche et al. (2009), the dust fraction decreases
from 47 to 14 % within this layer.
Figure 12 presents the HYSPLIT backward trajectories for
the last 10 days arriving at the position of RV Polarstern at
different altitudes. Air masses arriving in the MBL (500 m)
had been carried only over the Atlantic Ocean the last 10 days
and therefore contained mostly marine aerosol. Air masses
arriving between 1 and 3 km were advected from the African
continent. The air masses arriving at 1 km height originated
from the Saharan desert and passed over active fire areas
south-west of the Saharan desert 6 days before arriving at the
position of RV Polarstern. Trajectories arriving at 1.5 and
2 km also passed over the Saharan desert and active biomass-
burning regions, but have never been close to the ground. As
investigated by Nisantzi et al. (2014), fires can support the
upward transport of dust into the free troposphere. A high
amount of dust in addition to biomass-burning aerosol could Figure 12. NOAA HYSPLIT backward trajectories ending at
therefore also be detected in these altitudes. In contrast, air 29 April 2016 21:00 UTC at the position of RV Polarstern
(15.32◦ N, 22.73◦ W; marked by the black star) at different alti-
masses arriving at 2.5 and 3 km were on ground level over
tudes. Additionally, fires detected by MODIS on-board the Terra
active fire regions for several days and could take up a high
and Aqua satellites are shown. Fires are accumulated over the 10-
amount of biomass-burning aerosol. day period from 20 to 29 April 2016. Yellow colour indicates a large
During this night measurement, five layers with different number of fires, and red dots indicate a low number of fires in the
fractions of dust and smoke could be detected. At the same considered period (https://lance.modaps.eosdis.nasa.gov/firemaps,
time, the MBL was almost pure marine without mixed-in accessed: 24 February 2017).
dust or smoke particles. This case study shows that the MBL
is not always influenced by dust and smoke transport and dif-
Atmos. Chem. Phys., 18, 9661–9679, 2018 www.atmos-chem-phys.net/18/9661/2018/S. Bohlmann et al.: Aerosol profiling over the Atlantic Ocean 9673
(a) 40 N 20 N 0N 20 S 40 S (b) 40 N 20 N 0N 20 S 40 S
Height [km] 3 PS95 3 PS98
2 2
1 1
532 [Mm 1]
300 300
200 200
100 100
80 80
S532 [sr]
60 60
40 40
20 20
30 30
532 [%]
20 20
par
10 10
1.5 1.5
1.0 1.0
355/532
0.5 0.5
0.0 0.0
Åbsc
0.5 0.5
40 N 20 N 0N 20 S 40 S 40 N 20 N 0N 20 S 40 S
05/11/15 13/11/15 19/11/15 26/11/15 06/05/16 01/05/16 26/04/16 20/04/16 14/04/16
Figure 13. Mean values of extinction coefficient, lidar ratio and particle depolarisation ratio at 532 nm, and the backscatter-related Ångström
exponent at 355/532 nm (top down) for MBL (blue), elevated aerosol layers (black), and dried marine layers (red) on PS95 (a) and PS98 (b)
from north to south. Error bars indicate the standard deviation. MBL top height and extent of the elevated layers are shown in the first row.
ferent aerosol types can occur at the same time above the At- lidar ratio and particle depolarisation ratio at 532 nm, and
lantic. the backscatter-related Ångström exponent at 355/532 nm
are shown in the panels below. Blue dots illustrate the MBL
3.3 Statistical analysis mean values derived from near-range measurements. Mean
values of the elevated aerosol layers are derived from far-
A statistical analysis of all Raman measurements with suit- range signals and are illustrated with black dots, whereas
able weather conditions and signal quality was performed to mean values of the dried marine layers are illustrated red.
provide an overview of latitudinal differences and charac- These mean values are derived from near-range signals. An
teristics of the different aerosol types observed over the At- exception is the measurement at 22◦ S where the far-range
lantic. A total of 45 night measurements from PS95 and PS98 signal is used because of the height of the dried marine layer.
were selected for analysis with respect to optical aerosol Error bars represent the standard deviation. Measurements at
properties. Each measurement was screened for separated 355 nm are not shown for the sake of clarity but show similar
aerosol layers. The MBL and, when present, elevated aerosol results.
layers and layers of dried marine aerosol, as presented in the Mean MBL lidar ratios during PS95 are around 25 ± 3 sr
first case study, have been analysed separately. These layers in the northern latitudes and 20 ± 3 sr in the Southern Hemi-
with enhanced depolarisation ratio directly above the MBL sphere. In the region of dust, between 35◦ N and the equator,
will be named dried marine layers. the mean lidar ratio in the MBL is 30 ± 6 sr. The increased
lidar ratio is caused by down-mixing of dust from higher al-
3.3.1 Time series titudes, whereas the lidar ratio in the southern latitudes cor-
relates with pure marine values. Anthropogenic aerosol from
The MBL top height and the extent of analysed elevated the European continent influences the MBL in northern lat-
aerosol layers and dried marine layers are shown in the first itudes; the lidar ratio is therefore slightly higher than for a
row of Fig. 13 for PS95 (panel a) and PS98 (panel b), illus- pure marine environment. High particle depolarisation ratios
trated with blue dots and black and red bars, respectively. The up to 18 % in the MBL confirm the presence of depolaris-
MBL top height ranges between 300 and 900 m and shows no ing particles in the region west of the Sahara, while it is be-
clear latitudinal trend. Mean values of extinction coefficient, low 1 % in the European-influenced North Atlantic and the
www.atmos-chem-phys.net/18/9661/2018/ Atmos. Chem. Phys., 18, 9661–9679, 20189674 S. Bohlmann et al.: Aerosol profiling over the Atlantic Ocean
marine-dominated South Atlantic. During PS98, no signifi- is slightly lower than in the MBL, it is about 40 sr in the case
cant increase of the MBL lidar ratio between 35◦ N and the measured during PS98 but shows high uncertainty in the lat-
equator could be observed. The mixing of dust into the MBL ter. Mean Ångström exponents are around 0.5 during PS95
is therefore considered to be negligible. This is confirmed and around 1 during PS98, but do not show a clear difference
by a continuous low particle depolarisation ratio of less than from MBL mean values.
1 % in the MBL throughout the whole cruise. This contrast Differences in optical aerosol properties between northern
to PS95 can be explained by seasonal variations in the dust and southern latitudes and the dust-influenced region west
transport and deposition processes over the Atlantic. of the Saharan desert were detected. Whereas the North-
Elevated aerosol layers were mainly observed between ern Hemisphere is influenced by anthropogenic pollution,
30◦ N and 15◦ S and show a wide range of mean lidar and southern latitudes are more likely to be influenced by ma-
particle depolarisation ratios, caused by different particle rine aerosols only. Nevertheless, pure marine conditions, not
types in these layers. The mean particle depolarisation ra- influenced by aerosol originating from the continent, are rare
tio in elevated layers decreases from around 30 % at 25◦ N and could only be observed at the end of PS95 near South
towards the south during PS95, which suggests an increasing Africa. Mostly, low-level clouds at the top of the MBL at the
mixing with other less depolarising particles. At 1 and 12◦ S southern latitudes prohibited the lidar data analysis and thus
during PS95 and in the upper aerosol layers at 15 and 19◦ N the evaluation of more cases of pure marine conditions. In
during PS98, the lidar ratio is higher than the other days (64– about 65 % of the cruise time in the Southern Hemisphere
88 sr) while the particle depolarisation is low (< 10 %). This and 50 % in total during both cruises, clouds along the cruise
indicates a mixture with other absorbing, non-depolarising track did not allow lidar data analysis.
particles like biomass-burning aerosol. During PS98 at 5◦ S,
2500 km from the African coast, the lidar ratio between 1.5 3.3.2 Optical properties for particle typing
and 2.4 km is around 35 sr, which is considerably lower than
the characteristic values of pure dust (S532 ≈ 55 sr; Tesche Mean values of optical properties of the MBL and elevated
et al., 2011a). This may result from marine aerosol trans- aerosol layers from PS95 and PS98 (shown in Fig. 13) are
ported upward by turbulent mixing processes (Haarig et al., discussed to illustrate the potential of aerosol classification
2017). using intensive optical quantities. Similar to classifications
Latitudinal differences can also be seen in the course of shown by Burton et al. (2012) and Groß et al. (2015) the
the backscatter-related Ångström exponent at 355/532 nm in lidar ratio at 355 nm (532 nm) is presented against the parti-
355/532 cle depolarisation ratio at 355 nm (532 nm) for elevated lay-
the MBL during PS95. The mean Åbsc is around 0 in the
dust region, whereas it is around 1 in the northern and 0.5 in ers (black), MBL (blue), and dried marine layers (red). Error
southern latitudes. This suggests a mixture of marine aerosol bars were omitted for the sake of clarity. Coloured ellipses
and large dust particles in the MBL between 35◦ N and the denote the different aerosol categories.
equator, whereas in northern and southern mid-latitudes the A clear separation of marine and dust-influenced MBL
fraction of smaller particles dominates. In elevated layers, measurements can be seen. Pure marine MBL measurements
355/532 show lidar ratios between 13 and 40 sr and particle depolari-
mean Åbsc ranges between −0.5 and 0.5. From 30 to
◦ 355/532 sation ratios less than 2.5 % at 355 and 532 nm, whereas the
20 N, Åbsc is negative and in the second part of the
particle depolarisation ratio of dust-influenced MBL mea-
plume it becomes positive. According to Veselovskii et al.
surements ranges between 5 and 20 %, caused by a signifi-
(2016) a low backscatter-related Ångström exponent indi-
cant amount of non-spherical particles in the MBL. The lidar
cates an increased imaginary part of the refractive index at
ratio within these layers also shows a tendency to higher val-
355 nm compared to 532 nm and therefore a higher absorp-
ues with increasing particle depolarisation, caused by dust
tion at 355 nm than at 532 nm. This is a result from different
particles. Elevated aerosol layers can be divided into lay-
aerosol sources and particle properties. During the second
355/532 ers with a high particle depolarisation ratio (20–30 %) and
cruise, mean Åbsc ranges between −0.5 and 1.5. In dusty a lidar ratio of about 50–60 sr, layers with a lidar ratio be-
layers the mean Å is generally smaller than in the MBL – tween 30 and 75 sr and a moderate particle depolarisation
an exception is the upper layer at 19◦ N. In this layer, a high ratio (< 20 %), and layers with a high lidar ratio (> 80 sr)
amount of small soot particles cause a high Ångström expo- and a low particle depolarisation ratio (< 10 %). The first
nent. Ångström exponents in the MBL do not show indica- category is considered for pure dust cases, whereas the mix-
tions of down-mixed dust during this cruise. ing with other non-depolarising particles is the second cate-
The most prominent feature of dried marine layers is the gory, named dusty mixtures. These particles could be spher-
enhanced particle depolarisation ratio of about 4–9 % com- ical marine particles or biomass-burning aerosol. If the lidar
pared to the MBL with depolarisation ratios below 3 %. ratio is higher than reference values of pure dust (≈ 55 sr),
Those values are similar to previous observations by Mu- the aerosol is considered to be soot; a lower lidar ratio in-
rayama et al. (1999) and Sakai et al. (2000, 2010). Whereas dicates a mixture with marine particles. Layers in the third
the lidar ratio in the dried marine layer measured during PS95 category with lidar ratios greater than 80 sr and a particle de-
Atmos. Chem. Phys., 18, 9661–9679, 2018 www.atmos-chem-phys.net/18/9661/2018/S. Bohlmann et al.: Aerosol profiling over the Atlantic Ocean 9675
(a) 100 (b) 100
Smoke Smoke
80 Dusty mixtures 80
Dusty mixtures
Lidar ratio 355 nm [sr]
Lidar ratio 532 nm [sr]
Dust
60 60
Dust
40 40
MBL mixture MBL mixture
20 20
Dried marine
Dried marine
Marine Marine
0 0
0 5 10 15 20 25 30 35 0 5 10 15 20 25 30 35
Particle depolarisation ratio 355 nm [%] Particle depolarisation ratio 532 nm [%]
Figure 14. Lidar ratio as a function of the particle depolarisation ratio at 355 nm (a) and at 532 nm (b) from all analysed MBL (blue), elevated
aerosol layer (black), and dried marine layer (red) measurements of PS95 and PS98. Coloured ellipses denote the different aerosol categories.
polarisation lower than 10 % are considered as smoke domi- marine environment compared to the lidar ratio and depolar-
nated. Mean values at 355 and 532 nm show similar results, isation ratio.
although lidar ratios at 355 nm tend to be slightly higher for Resulting from the preceding investigations, we consider
all aerosol categories. As clearly seen, some of the mixed the lidar ratio together with the particle depolarisation ra-
aerosol states do overlap and a clear separation by the lidar tio as best indicators for particle classification above the
ratio and depolarisation ratio is not possible. Atlantic. A clear characteristic in terms of lidar ratio and
Therefore, to complete the picture of particle-type- Ångström exponent for the dried marine layers is not visi-
dependent optical properties, the backscatter and extinction- ble. Further observations of those layers are needed to get a
related Ångström exponents at 355/532 nm and the comprehensive picture of dried marine aerosol properties.
backscatter-related Ångström exponent at 532/1064 nm are The values presented above might be valuable information
considered for particle type separation in addition to the li- for new aerosol typing schemes needing knowledge from
dar and depolarisation ratio in Fig. 15. The backscatter and marine areas at the specific lidar wavelengths as, for exam-
extinction-related Ångström exponent as a function of the ple, for the upcoming EarthCARE mission. The operated li-
particle depolarisation ratio (Fig. 15 bottom face) shows that dar will measure at 355 nm but also requires information on
the Ångström exponent is not a suitable parameter for the the spectral behaviour of the optical aerosol properties to ob-
separation of pure marine and dust-influenced MBL, while tain radiation closure, which is one goal of this mission.
a clear separation is possible considering the depolarisation
ratio (pure marine: δ par < 5 %; aerosol mixtures in the MBL:
5 % < δ par < 20 %). For elevated aerosol layers, a slight ten- 4 Conclusions
dency towards negative backscatter-related Ångström ex-
ponents at 355/532 nm with increasing depolarisation ra- Multi-wavelength Raman polarisation lidar measurements
tio values can be seen (Fig. 15a, c). The extinction-related from two ship-borne cruises across the Atlantic Ocean
Ångström exponent at both depolarisation wavelengths is (meridional direction) were analysed. Pure marine, pure dust,
more widely dispersed than the backscatter-related Ångström and dust–smoke mixed conditions were observed. The MBL
exponent but shows similar patterns (Fig. 15b, d). In the was often mixed with dust near the equator and northern
illustration of the backscatter-related Ångström exponent subtropics, whereas in the outer tropics the marine influence
at 532/1064 nm against the particle depolarisation ratio at dominated. One highlight was the observation of dried ma-
532 nm (Fig. 15e) no tendency to smaller Ångström expo- rine aerosol at the top of the MBL, which was relatively of-
nents with higher depolarisation ratio of the elevated aerosol ten observed during the cruises aboard RV Polarstern but
layers can be observed; thus, this parameter is obviously not has been rarely reported in literature so far. Dried marine
suitable for a distinction between the different aerosol types. particles cause particle depolarisation ratios up to 9 % corre-
Considering the lidar ratio as a function of the backscat- lated with a decreasing relative humidity below 50 %. In the
ter and extinction-related Ångström exponents (Fig. 15 right northern tropics, west of the Saharan desert, various aerosol
face), it again becomes obvious that the Ångström exponent layers could be observed during the cruises across the At-
is a much less powerful parameter for aerosol typing in a lantic from north to south in the frame of the OCEANET
project. In addition to a pure Saharan dust plume with a neg-
www.atmos-chem-phys.net/18/9661/2018/ Atmos. Chem. Phys., 18, 9661–9679, 20189676 S. Bohlmann et al.: Aerosol profiling over the Atlantic Ocean
(a) (b)
(c) (d)
(e)
Figure 15. Three-dimensional illustration of the relation between lidar ratio, depolarisation ratio, and backscatter and extinction-related
Ångström exponent. Blue dots represent MBL measurements, black dots elevated aerosol layers, and red dots dried marine layers. Coloured
ellipses denote the different aerosol categories as in Fig. 14.
ative backscatter-related Ångström exponent of −0.4 ± 0.1 A statistical analysis showed latitudinal differences and
at 355/532 nm near the Canary Islands, Saharan dust lay- the potential for aerosol classification of these cruises. Op-
ers partly mixed with biomass-burning smoke were observed tical properties in the MBL were influenced by down-mixing
near the Cabo Verde islands. of dust in the tropics and anthropogenic sources in the north-
ern latitudes. In the Southern Hemisphere, optical properties
of the MBL correlate with typical marine values. The mixing
Atmos. Chem. Phys., 18, 9661–9679, 2018 www.atmos-chem-phys.net/18/9661/2018/S. Bohlmann et al.: Aerosol profiling over the Atlantic Ocean 9677
of dust in the MBL was low, confirmed by a continuous par- larstern lidar data are available upon request from TROPOS (please
ticle depolarisation ratio of less than 1 % in the MBL in the contact polly@tropos.de).
Southern Hemisphere. On both cruises, the MBL top never
exceeded 900 m. Elevated aerosol layers were mainly ob-
served in the Northern Hemisphere tropics and reached up to Author contributions. SB and HB performed the data analysis and
4 km. Layers of dried non-spherical marine aerosol on top of led the manuscript writing. RE, SB, and MR realised the experi-
the MBL could be observed only a few times, since, in about mental set-up on board the RV Polarstern and were responsible for
the lidar measurements. AM initialised the OCEANET project and
65 % of the time in southern hemispheric mid-latitudes, low-
the corresponding atmospheric measurement on board the RV Po-
level clouds prohibited the processing of the lidar data for
larstern. All authors have contributed to the scientific discussion
aerosol properties. and the manuscript preparation.
All 45 night measurements from PS95 and PS98 were
used to illustrate dependencies between lidar ratio, particle
depolarisation ratio, and Ångström exponent for the differ- Competing interests. The authors declare that they have no conflict
ent aerosol types. Lidar ratio and particle depolarisation ratio of interest.
are the main indicators for the characterisation of the parti-
cle types observed over the Atlantic, whereas the Ångström
exponent is not a good indicator for aerosol typing. Ma- Acknowledgements. The authors acknowledge support through
rine, dust, and smoke aerosols could be clearly identified ACTRIS under grant agreement no. 262254 and ACTRIS-2 under
with particle depolarisation and lidar ratio. But care must be grant agreement no. 654109 from the European Union’s Horizon
taken when layers of dried marine aerosol occur at the top 2020 research and innovation programme. We thank the Alfred
of the MBL, as the enhanced depolarisation ratio (4–9 %) Wegener Institute and the RV Polarstern crew for their incredible
could lead to wrong conclusions about the mixing state of the effort in making those measurements possible (acknowledgement
no. AWI_PS95_00, AWI_PS98_00). Furthermore, we thank the
aerosol by inferring the presence of mineral dust. We there-
German Weather Service (DWD) for their support during the
fore recommend considering the relative humidity and the cruises PS95 and PS98 and appreciate the effort of the AERONET
vertical connection to the marine boundary layer when per- MAN, HYSPLIT, and the Barcelona Supercomputing Center teams
forming aerosol typing over the ocean, e.g. by space-borne to provide additional data.
lidars such as CALIOP or EarthCARE.
The values obtained increase the knowledge of the aerosol Edited by: Armin Sorooshian
conditions in marine environments which make 70 % of the Reviewed by: Ali Omar and two anonymous referees
Earth’s surface. Therefore, the presented results may also be
a valuable contribution for the data analysis of satellite re-
trievals, which are the only instruments able to cover this
large part of the Earth at the moment. The obtained data can References
also be used to validate and further improve model calcula-
tions, for example, by evaluation of the height of the different AERONET MAN: AERONET Maritime Aerosol Network
aerosol layers. Nevertheless, future studies are needed to ex- database, available at: https://aeronet.gsfc.nasa.gov/new_web/
pand the knowledge of dried marine aerosol, its drying pro- maritime_aerosol_network.html, last access: 15 January 2018.
Albrecht, B. A.: Aerosols, cloud microphysics, and
cesses, and interactions with aerosols above and within the
fractional cloudiness, Science, 245, 1227–1230,
MBL.
https://doi.org/10.1126/science.245.4923.1227, 1989.
Althausen, D., Engelmann, R., Baars, H., Heese, B., Ansmann,
A., Müller, D., and Komppula, M.: Portable Raman lidar
Data availability. Meteorological data of all RV Polarstern cruises PollyXT for automated profiling of aerosol backscatter, extinc-
are available on the Pangaea database (AWI, 2017). For lidar data tion, and depolarization, J. Atmos. Ocean. Tech., 26, 2366–2378,
analysis, GDAS1 (Global Data Assimilation System) height pro- https://doi.org/10.1175/2009JTECHA1304.1, 2009.
files of the National Weather Service’s National Centers for En- Ångström, A.: On the Atmospheric Transmission of Sun Radiation
vironmental Prediction (NCEP) were used (GDAS, 2018). Trajec- and on Dust in the Air, Geogr. Ann., 11, 156–166, 1929.
tories are calculated with the NOAA (National Oceanic and At- Ansmann, A., Wandinger, U., Riebesell, M., Weitkamp, C., and
mospheric Administration) HYSPLIT (HYbrid Single-Particle La- Michaelis, W.: Independent measurement of extinction and
grangian Integrated Trajectory) model (HYSPLIT, 2018). The fire backscatter profiles in cirrus clouds by using a combined
data detected by MODIS (Moderate Resolution Imaging Spectro- Raman elastic-backscatter lidar, Appl. Opt., 31, 7113–7131,
radiometer) that are additionally shown are available at MODIS https://doi.org/10.1364/AO.31.007113, 1992.
(2017). BSC-DREAM8b model simulations are operated by the AWI: Meteorological data of RV Polarstern cruises, Pan-
Barcelona Supercomputing Center (BSC DREAM, 2016). AOT gaea database, https://doi.org/10.1594/PANGAEA.856030,
data can be downloaded from the AERONET Maritime Aerosol https://doi.org/10.1594/PANGAEA.856031,
Network (MAN) database (AERONET MAN, 2018). The RV Po- https://doi.org/10.1594/PANGAEA.861660, last access: 24
February 2017.
www.atmos-chem-phys.net/18/9661/2018/ Atmos. Chem. Phys., 18, 9661–9679, 2018You can also read