Estimating leopard density across the highly modified human-dominated landscape of the Western Cape, South Africa

Page created by Holly Freeman
 
CONTINUE READING
Estimating leopard density across the highly modified human-dominated landscape of the Western Cape, South Africa
Estimating leopard density across the highly
              modified human-dominated landscape of the
              Western Cape, South Africa
              CAROLYN H. DEVENS, MATT W. HAYWARD, THULANI TSHABALALA, AMY DICKMAN
                               J E A N N I N E S . M C M A N U S , B O O L S M U T S and M I C H A E L J . S O M E R S

              Abstract Apex predators play a critical role in maintaining                                    Keywords Camera trapping, carnivore conservation,
              the health of ecosystems but are highly susceptible to habitat                                 leopard, Panthera pardus, secr, SPACECAP, spatially
              degradation and loss caused by land-use changes, and to                                        explicit capture–recapture
              anthropogenic mortality. The leopard Panthera pardus is
                                                                                                             Supplementary material for this article is available at
              the last free-roaming large carnivore in the Western
                                                                                                             https://doi.org/./S
              Cape province, South Africa. During –, we carried
              out a camera-trap survey across three regions covering
              c. , km of the Western Cape. Our survey comprised
               camera sites sampling nearly , camera-trap nights,
                                                                                                             Introduction
              resulting in the identification of  individuals. We used two
              spatially explicit capture–recapture methods (R programmes
              secr and SPACECAP) to provide a comprehensive density
              analysis capable of incorporating environmental and an-
                                                                                                             T     he exponential growth of the human population is
                                                                                                                   threatening all levels of biodiversity, including large
                                                                                                             carnivores, with % of species’ populations experiencing
              thropogenic factors. Leopard density was estimated to be                                       continuing declines (Estes et al., ; Ripple et al., ).
              . and . leopards/ km, using secr and SPACECAP,                                       Large carnivores are particularly at risk of extinction
              respectively. Leopard population size was predicted to be                                      because of their small population sizes, slow reproductive
              – individuals for our three study regions. With these                                    rates, complex social structures and requirement for
              estimates and the predicted available leopard habitat for the                                  large and contiguous habitats with sufficient prey (Cardillo
              province, we extrapolated that the Western Cape supports an                                    et al., ; Ripple et al., ). These characteristics, and
              estimated – individuals. Providing a comprehensive                                       their vulnerability to negative interactions with humans,
              baseline population density estimate is critical to understand-                                have driven declines of some of the most wide-ranging
              ing population dynamics across a mixed landscape and help-                                     carnivores (Cardillo et al., ; Ray et al., ;
              ing to determine the most appropriate conservation actions.                                    Swanepoel et al., ; Wolf & Ripple, ).
              Spatially explicit capture–recapture methods are unbiased                                          Although the leopard is considered the most adaptable
              by edge effects and superior to traditional capture–mark–                                      large carnivore (Ripple et al., ), range declines of –%
              recapture methods when estimating animal densities. We                                         globally, –% in Africa and –% in southern
              therefore recommend further utilization of robust spatial                                      Africa indicate that leopard populations are not as re-
              methods as they continue to be advanced.                                                       silient to anthropogenic influences as previously believed
                                                                                                             (Jacobson et al., ). Major anthropogenic threats to
                                                                                                             leopards include ongoing habitat loss and fragmentation
              CAROLYN H. DEVENS* (Corresponding author,          orcid.org/0000-0002-7539-
              0969), MATT W. HAYWARD† and MICHAEL J. SOMERS¶ ( orcid.org/0000-0002-                          (Harcourt et al., ; Crooks, ; Swanepoel et al.,
              5836-8823) Mammal Research Institute, Department of Zoology and                                ), depletion of prey resources (Woodroffe, ;
              Entomology, University of Pretoria, Pretoria, South Africa
              E-mail chdevens@gmail.com
                                                                                                             Karanth & Chellam, ), unsustainable hunting levels
                                                                                                             (Woodroffe, ; Harcourt et al., ) and direct perse-
              THULANI TSHABALALA‡, JEANNINE S. MCMANUS§ and BOOL SMUTS§ Research
              Department, Landmark Foundation, Riversdale, South Africa                                      cution by people (Harcourt et al., ; Treves & Karanth,
              AMY DICKMAN WildCRU, Oxford University, Abingdon, UK                                           ; Treves et al., ; Treves & Naughton-Treves,
              *Also at: Research Department, Landmark Foundation, Riversdale, South Africa
                                                                                                             ; McManus et al., ; Swanepoel et al., ).
              †Also at: School of Environmental and Life Sciences, University of Newcastle,                  Increasing human population density and loss of habitat
              Callaghan, Australia                                                                           increase the likelihood of resource competition with people,
              ‡Also at: School of Agricultural, Earth and Environmental Sciences, University
              of KwaZulu-Natal, Durban, South Africa                                                         often resulting in human–carnivore conflict (Woodroffe,
              §Also at: Department of Biodiversity and Conservation Biology, University of                   ; Cardillo et al., ). Persecution often includes
              the Western Cape, Cape Town, South Africa                                                      indiscriminate use of lethal methods to manage livestock
              ¶Also at: Centre for Invasion Biology, University of Pretoria, Pretoria, South
              Africa                                                                                         depredation by carnivores (e.g. snares, poisoned carcasses,
              Received  December . Revision requested  March .                                    gin traps (leg-hold traps), gun traps, live trapping) and tar-
              Accepted  November . First published online  September .                           geted (often retaliatory) hunting (McManus et al., ).

              This is an Open Access article, distributed under the terms of the Creative Commons Attribution licence (http://creativecommons.org/licenses/by/4.0/), which permits unrestricted re-use,
Downloaded from      https://www.cambridge.org/core.
               distribution,                            IP address:
                             and reproduction in any medium,        46.4.80.155,
                                                             provided the originalonwork
                                                                                     22 Jan  2021 at cited.
                                                                                         is properly 15:24:38, subject to the Cambridge Core terms of use, available at https://www.cambridge.org/core/terms.
https://doi.org/10.1017/S0030605318001473
                             Oryx, 2021, 55(1), 34–45 © The Author(s), 2019. Published by Cambridge University Press on behalf of Fauna & Flora International doi:10.1017/S0030605318001473
Estimating leopard density across the highly modified human-dominated landscape of the Western Cape, South Africa
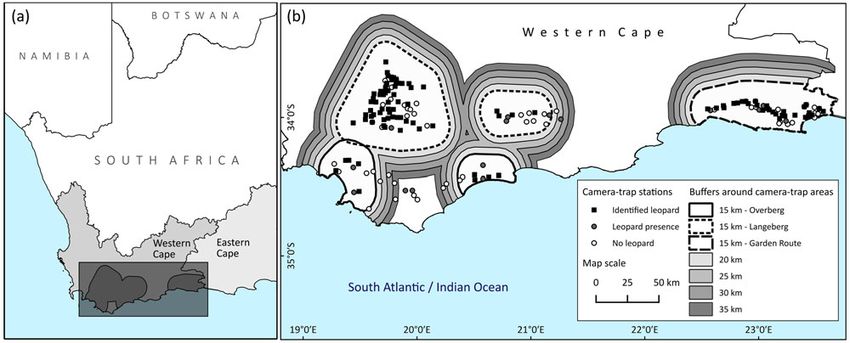
Leopard density in South Africa’s Western Cape                      35

               Estimating a species’ density across various types of land                          Fewster, ), spatially explicit capture–recapture models
           cover (i.e. habitat and vegetation type) and land uses (i.e.                            are becoming increasingly robust and comprehensive.
           residential/urban land, cultivated land, commercial and                                    These statistical and methodological advances provide
           recreational land and areas protected for conservation)                                 multiple options that can be applied to specific study ques-
           can help determine how population numbers are affected                                  tions while making population density estimates increasing-
           by landscape features. Density estimates are not equally                                ly reliable. Inaccurate density estimates can lead to biased
           robust, and under- or overestimating populations can have                               population estimates, with serious implications for conser-
           substantial implications for conservation management and                                vation management (Soisalo & Cavalcanti, ).
           policy (Foster & Harmsen, ; Hayward et al., ). For                                 The estimation of a baseline population density for
           example, Soisalo & Cavalcanti () demonstrated how                                   leopards in South Africa’s Western Cape province is
           overestimating jaguar Panthera onca populations by five                                 fundamental for understanding how this regionally im-
           individuals per  km inflated the overall population                                 portant population responds to landscape-scale threats
           estimate by , individuals across their , km                                  and changes. By estimating densities across landscapes of
           study region. Density estimation also depends upon data                                 varying resource availability and threats, we can examine
           quality, with a large enough sample size and capture prob-                              drivers of regional density variation and improve conserva-
           ability for the chosen analysis method (Foster & Harmsen,                               tion management for disjunct populations.
           ).
               Conservationists and ecologists constantly seek to im-
           prove the methodology for estimating animal population                                  Study area
           abundances and densities (Griffiths & van Schaik, ;
                                                                                                   This study covers c. , km in three areas (Langeberg,
           Karanth & Nichols, ; Karanth & Nichols, ). The
                                                                                                   Overberg and Garden Route) in the Western Cape, South
           use of camera traps and photo capture–recapture analysis
                                                                                                   Africa (Fig. ). The topography varies from the Cape Fold
           is a common and effective non-invasive practice for ob-
                                                                                                   Mountain peaks with an altitude of . , m that extend
           taining data on wildlife population dynamics, particularly
                                                                                                   , km east to west, to coastal and low-lying valleys
           of rare or elusive species (Foster & Harmsen, ). Leo-
                                                                                                   at ,  m altitude (Thamm & Johnson, ). Biomes
           pards, like many other large felids, are challenging to
                                                                                                   included in our study are Thicket, Afro-temperate forest
           monitor because of their large home ranges, low population
                                                                                                   (Forest), Sandstone fynbos (Fynbos), Nama-Karoo, Succu-
           density and primarily solitary and elusive nature (Karanth &
                                                                                                   lent-Karoo and Savanna (Mucina & Rutherford, ).
           Nichols, ; Treves & Karanth, ). Global population
                                                                                                       In the Langeberg we deployed camera traps in the
           estimates across the leopard’s vast geographical distribution
                                                                                                   greater Riversdale/Heidelberg area on the southern slopes
           do not account for the health and sustainability of smaller,
                                                                                                   of Langeberg Mountain Range, in the greater Greyton area
           isolated regional metapopulations across a variety of habitat
                                                                                                   on the southern slope of Riviersonderend Mountain Range
           types, countries and levels of human landscape modification
                                                                                                   and in the Robertson Wine Valley (Breede River Valley)
           and pressure.
                                                                                                   situated between the Langeberg and Riviersonderend
               Camera-trap surveys have become an important data
                                                                                                   Mountain Ranges. In the Overberg we surveyed the greater
           collection method for population and density studies
                                                                                                   Hermanus area to the west, the greater Cape Agulhas and
           because they are non-invasive, practical and affordable
                                                                                                   Arniston areas to the south along the coast, and the greater
           (Karanth, ; Karanth & Nichols, ; Foster &
                                                                                                   De Hoop Nature Reserve area to the eastern extent of the
           Harmsen, ). The capture–recapture method relies on
                                                                                                   surveyed region. Along the Garden Route we surveyed
           individuals being identifiable (Karanth, ; Silver et al.,
                                                                                                   temperate forest along the southern slopes of the Outeniqua
           ) and has been the predominant approach used in
                                                                                                   and Tsitsikamma Mountains from George in the west to
           felid density studies.
                                                                                                   the Bloukrans River in Plettenberg Bay in the east.
               More recently, spatial capture–recapture or spatially
           explicit capture–recapture methods have become popular
           because they provide comprehensive analyses that can in-                                Methods
           corporate environmental and anthropogenic factors when
           estimating animal densities. These methods enable density                               Camera-trap surveys
           analyses to include spatio-temporal data from capture
           histories, providing direct estimates of population density                             We undertook seven large-scale camera-trap surveys during
           that remain unbiased by edge effects (Chase Grey et al.,                                June –March , focusing on likely presence of leo-
           ). By allowing for flexibility in individual heterogeneity                          pards inside and outside protected areas and across different
           with the consideration of capture probability relative to trap                          agricultural land-use zones (livestock, crops, forestry). We
           location, spatial covariates such as habitat, and intrinsic fac-                        used Cuddeback Attack IR (Cuddeback, Green Bay, USA)
           tors such as sex and age (Foster & Harmsen, ; Efford &                              digital infrared cameras and selected camera-trap locations

           Oryx, 2021, 55(1), 34–45 © The Author(s), 2019. Published by Cambridge University Press on behalf of Fauna & Flora International doi:10.1017/S0030605318001473
Downloaded from https://www.cambridge.org/core. IP address: 46.4.80.155, on 22 Jan 2021 at 15:24:38, subject to the Cambridge Core terms of use, available at https://www.cambridge.org/core/terms.
https://doi.org/10.1017/S0030605318001473
Estimating leopard density across the highly modified human-dominated landscape of the Western Cape, South Africa
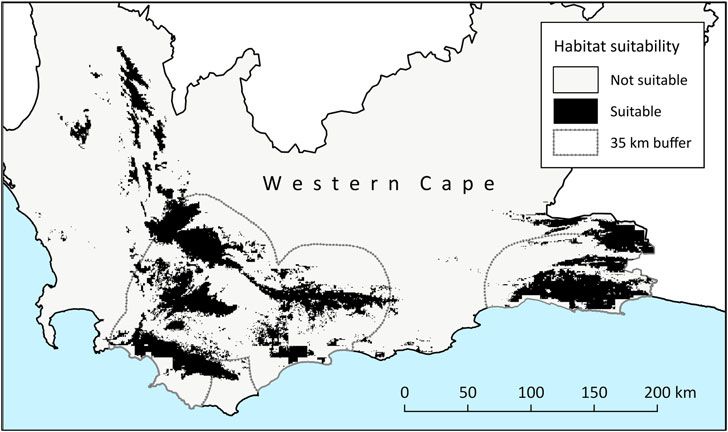
36         C. H. Devens et al.

             FIG. 1 (a) Location of the study areas in the Western Cape province, South Africa. (b) Camera-trap surveys conducted across the
             Langeberg (, km), Garden Route (, km) and Overberg (, km) areas. Data from camera stations with identified
             leopards were analysed with programmes SPACECAP and secr with various buffers.

             based on the highest likelihood of leopard activity as deter-                           density estimates than non-spatial methods (Obbard et al.,
             mined by physical evidence (scat, spoor and territorial scent                           ; Gerber et al., ; Gopalaswamy et al., ; Noss
             and scratch markings on trees), as well as habitat type and                             et al., ; Braczkowski et al., ). We calculated density
             topography (Karanth & Nichols, ). At each camera-                                   estimates using two spatially explicit capture–recapture
             trap station, we positioned two cameras to capture both                                 methods within the programming environment R ..
             flanks of a passing leopard. The stations were placed –                               (R Development Core Team, ): () the maximum
             km apart to achieve even coverage of the sampling area                                  likelihood based estimator programme secr .. (Efford
             and camera stations remained active for a minimum of                                   et al., ; Efford, , ), which is a more robust
             months to ensure maximum likelihood of leopard activity                                 version of programme DENSITY (Efford, ), and () the
             being captured without violating the closed population as-                              Bayesian estimator programme SPACECAP .. (Gopalaswamy
             sumption (Karanth & Nichols, ; Devens et al., ).                                et al., ). Previous studies have applied these two pro-
                                                                                                     grammes to compare density estimates (Kalle et al., ;
                                                                                                     Thapa et al., ) and to compare results of spatially explicit
             Capture–recapture identification                                                        capture–recapture with non-spatial methods (Noss et al.,
                                                                                                     ; Braczkowski et al., ). We used these programmes
             Individual leopards can be identified from clear photo-
                                                                                                     for comparison of two spatially explicit capture–recapture
             graphs of both flanks by their unique rosette markings.
                                                                                                     methods and to determine the most robust and inclusive
             Identification from single flank photos is possible, but
                                                                                                     density estimate range for each study region.
             needs to be based upon the observation of characteristics
                                                                                                        For the analysis with secr we categorized camera traps as
             such as the animal’s overall size, neck girth, injuries or
                                                                                                     count detectors, which allows repeat detections. Count data
             scars. Although such characteristics may be useful, incor-
                                                                                                     can result from devices such as automatic camera traps.
             rectly identified individuals could bias density estimates,
                                                                                                     Count detectors record the presence of an animal at a trap
             resulting in overestimation of the population if flank photos
                                                                                                     location without restricting movement and allow .  detec-
             of the same animal were erroneously assigned to two indi-
                                                                                                     tion of an individual at a particular site on any occasion. The
             viduals. We therefore only utilized double flank capture
                                                                                                     secr.fit function was run for each regional survey phase
             events for identification.
                                                                                                     using models of time (g*T) and behavioural response
                                                                                                     (g*b), as well as buffers of , , ,  and  km
             Data analysis                                                                           surrounding the minimal convex polygon around camera
                                                                                                     stations in each camera-trapping area. These buffers
             Spatially explicit capture–recapture methods for density                                ensured inclusion of all leopard home ranges within reach
             analyses are more comprehensive and reliable than tra-                                  of camera traps (Kalle et al., ) and made density estima-
             ditional capture–recapture analyses (Borchers & Efford,                                 tion more reliable by determining the point at which the
             ; Kalle et al., ; Gopalaswamy et al., ; Chase                               density estimate stabilized (Kalle et al., ; Chase Grey
             Grey et al., ; Thapa et al., ) and produce lower                                et al., ).

                           Oryx, 2021, 55(1), 34–45 © The Author(s), 2019. Published by Cambridge University Press on behalf of Fauna & Flora International doi:10.1017/S0030605318001473
Downloaded from https://www.cambridge.org/core. IP address: 46.4.80.155, on 22 Jan 2021 at 15:24:38, subject to the Cambridge Core terms of use, available at https://www.cambridge.org/core/terms.
https://doi.org/10.1017/S0030605318001473
Leopard density in South Africa’s Western Cape                      37

               SPACECAP was used to estimate abundance and density                                 ‘Spatial Capture–Recapture’ option runs a spatially explicit
           using spatially-explicit capture–recapture models to derive                             capture–recapture analysis. The Markov-Chain Monte
           spatial Bayesian estimates with trap response. A grid of                                Carlo settings varied between study areas and buffers.
           equally spaced points  km apart was generated in QGIS                                  Markov-Chain Monte Carlo iterations were set between
           . (QGIS Development Team, ) and clipped to the sur-                               , and , with a burn-in period between ,
           veyed area containing the camera trap array combined with                               and , iterations and a thinning rate of . The data aug-
           an extended surrounding area, known as the state-space, at                              mentation numbers were c. – times the number of ani-
           distances of , , ,  and  km. These points represent                           mals identified in each regional survey and varied between
           all potential home range centres of all leopards within the                              and ,. We assessed chain convergence with the
           survey. The potential home range centres file included the                              Geweke diagnostic test produced within the SPACECAP out-
           geographical coordinates and habitat suitability of each of                             put in the form of z-score values. Z-scores between −. and
           these points within the state-space. We determined habitat                              +. implied adequate convergence and confirmed that the
           suitability using Maxent .. (Phillips et al., ; Phillips                         Markov-Chain Monte Carlo analysis was run with a suffi-
           et al., ) model output comprising environmental vari-                               ciently long burn-in period. The SPACECAP output also pro-
           ables, including eight WorldClim bioclimatic variables                                  duces a Bayesian P-value to provide additional assessment of
           obtained from WorldClim website (Hijmans et al., ),                                 the model fit where P-values close to  or  imply that the
           human footprint index (WCS & CIESIN, ), altitude, an-                               model is inadequate. The adequacy of the data augmentation
           thropogenic biomes (Ellis & Ramankutty, ), Globcover                                number can be checked in the ‘density plot for psi’ and
            (FAO, ), South African National Bio-diversity                                  ‘density plot for N’ files included within the output files.
           Institute ecosystem status of vegetation types (Rouget                                  All densities obtained with SPACECAP produced z-scores
           et al., ), and a subset of location data obtained from                              that achieved convergence, as well as sufficient model fit
           two leopards resident in the area that were equipped with                               and data augmentation number. The output also included
           GPS collars. We used the Natural Breaks function (Jenks,                                pixel-specific density estimates (animals per km), which
           ) in ArcMap .. to code the model output as either                              we used to create a pixel density map of the study areas
           (not suitable = –.) or  (suitable = .–.).                           and compare leopard densities across various land covers
           The habitat suitability generated in this way (Jenks                                    and uses to illustrate relationship with anthropogenic factors.
           method) was recorded for each point and a home range cen-
           tre input file was generated for each area’s buffer distances
           (Fig. ).                                                                               Results
               We ran SPACECAP with a  km pixel area, and set
           the model definitions to ‘Trap response present’, ‘Spatial                              Camera-trap data and sampling effort
           Capture–Recapture’, ‘half normal’ detection function and
           the capture encounters ‘Bernoulli’s process’. The ‘Trap                                 The total sampling effort for the Overberg (November –
           response present’ option implements a ‘trap-specific’ behav-                            March ) was , camera-trap nights across a total
           ioural response in which the probability of capture at a spe-                           of  camera-trap locations ( cameras). This yielded 
           cific trap increases (or decreases) after the initial capture. The                      leopard photographs (captures), with eight individuals

                                                                                                                                           FIG. 2 Maxent probability
                                                                                                                                           distribution model of leopard
                                                                                                                                           habitat suitability in the Western
                                                                                                                                           Cape and considering this study’s
                                                                                                                                            km buffers around camera-trap
                                                                                                                                           areas. Distribution model is
                                                                                                                                           reclassified with Natural Breaks
                                                                                                                                           function.

           Oryx, 2021, 55(1), 34–45 © The Author(s), 2019. Published by Cambridge University Press on behalf of Fauna & Flora International doi:10.1017/S0030605318001473
Downloaded from https://www.cambridge.org/core. IP address: 46.4.80.155, on 22 Jan 2021 at 15:24:38, subject to the Cambridge Core terms of use, available at https://www.cambridge.org/core/terms.
https://doi.org/10.1017/S0030605318001473
38         C. H. Devens et al.

             identified in  of them. These individuals were detected at

                                                                                                                                                                                                                                                                                                                    Identified
                                                                                                                                                                                                                                                                                                                    leopards
             nine of the  camera-trap sites (Table ).

                                                                                                                           TABLE 1 Summary of capture–recapture camera-trap survey sampling effort and leopard Panthera pardus capture results across three study areas in the Western Cape, South Africa.
                 The total sampling effort for the two phases of the

                                                                                                                                                                                                                                                                                                                                                8
                                                                                                                                                                                                                                                                                                                                               21
                                                                                                                                                                                                                                                                                                                                               42
                                                                                                                                                                                                                                                                                                                                               24
                                                                                                                                                                                                                                                                                                                                               71
             Langeberg survey (April –December ) consisted
             of , camera-trap nights across a total of  camera-trap

                                                                                                                                                                                                                                                                                                             Total leopard pictures
             locations ( cameras). This yielded  leopard captures,
             from which  individual leopards were identified in 

                                                                                                                                                                                                                                                                                                             enabling leopard
             photographs, and these individuals were detected at  of

                                                                                                                                                                                                                                                                                                             identification
             the  camera-trap sites (Table ).
                 The total sampling effort for the three phases of the

                                                                                                                                                                                                                                                                                                                                                40
                                                                                                                                                                                                                                                                                                                                                86
                                                                                                                                                                                                                                                                                                                                               250
                                                                                                                                                                                                                                                                                                                                               125
                                                                                                                                                                                                                                                                                                                                               376
             Garden Route survey area (May –December ) was
             , camera-trap nights across a total of  camera-trap
             locations ( cameras). This yielded  leopard captures,

                                                                                                                                                                                                                                                                                                                    Total leopard
             of which  individual leopards were identified in  photo-

                                                                                                                                                                                                                                                                                                                    pictures
             graphs, and these individuals were detected at  of the 

                                                                                                                                                                                                                                                                                                                                               118
                                                                                                                                                                                                                                                                                                                                               142
                                                                                                                                                                                                                                                                                                                                               454
                                                                                                                                                                                                                                                                                                                                               238
                                                                                                                                                                                                                                                                                                                                               714
             camera-trap sites (Table ). The total sampling effort was
             , camera-trap nights across  camera-trap locations
             ( cameras), with  leopard captures and  identified

                                                                                                                                                                                                                                                                                                                    Total camera-
             individuals (Table ).

                                                                                                                                                                                                                                                                                                                    trap nights
                                                                                                                                                                                                                                                                                                                                                2,880
                                                                                                                                                                                                                                                                                                                                                3,600
                                                                                                                                                                                                                                                                                                                                                7,110
                                                                                                                                                                                                                                                                                                                                                4,530
                                                                                                                                                                                                                                                                                                                                               13,590
             Density estimates

             The spatially explicit capture–recapture density estimates

                                                                                                                                                                                                                                                                                                                    Camera-trap stations
             varied by region and between regional phases, and estimates

                                                                                                                                                                                                                                                                                                                    with leopard IDs
             from secr were lower than those from SPACECAP. The effect
             of using various buffers within the two programmes, par-
             ticularly SPACECAP, demonstrated the sensitivity to buffer
             width and data augmentation size (Kalle et al., ). We cal-

                                                                                                                                                                                                                                                                                                                                                 9
                                                                                                                                                                                                                                                                                                                                                33
                                                                                                                                                                                                                                                                                                                                                58
                                                                                                                                                                                                                                                                                                                                                33
                                                                                                                                                                                                                                                                                                                                               100
             culated mean density estimates from stabilized buffer values
             to ensure the study area was large enough to avoid capturing
                                                                                                                                                                                                                                                                                                                    Camera-trap

             any individuals residing outside the buffered region during
                                                                                                                                                                                                                                                                                                                    stations

             the survey.
                 In the Overberg, secr density estimates stabilized at
                                                                                                                                                                                                                                                                                                                                                32
                                                                                                                                                                                                                                                                                                                                                40
                                                                                                                                                                                                                                                                                                                                                79
                                                                                                                                                                                                                                                                                                                                                42
                                                                                                                                                                                                                                                                                                                                               151
             . leopards/ km (CI .–.). Both phases in the
             Langeberg had density estimates that were stable across all
                                                                                                                                                                                                                                                                                                                    Regional
                                                                                                                                                                                                                                                                                                                    phases

             five buffers with a phase one density estimate of . leo-
             pards/ km (CI .–.) and a phase two estimate of
                                                                                                                                                                                                                                                                                                                                               1
                                                                                                                                                                                                                                                                                                                                               3
                                                                                                                                                                                                                                                                                                                                               2

                                                                                                                                                                                                                                                                                                                                                                     6

             . leopards/ km (CI .–.). The Garden Route’s
             first phase had an estimated density of . leopards/ km
                                                                                                                                                                                                                                                                                                             (active nights)
                                                                                                                                                                                                                                                                                                             Survey phase

             (CI .–.) with densities stable across all buffers, whereas
                                                                                                                                                                                                                                                                                                             duration

             phase two had an estimated density of . leopards/ km
             (CI .–.) and phase three produced a density estimate of
                                                                                                                                                                                                                                                                                                                                                90
                                                                                                                                                                                                                                                                                                                                                90
                                                                                                                                                                                                                                                                                                                                                90
                                                                                                                                                                                                                                                                                                                                                90
                                                                                                                                                                                                                                                                                                                                               270

             . leopards/ km (CI .–.; Table ). We calculated
                                                                                                                                                                                                                                                                                                                                               Oct. 2012–Mar. 2015

                                                                                                                                                                                                                                                                                                                                                                     July 2011–Mar. 2015
                                                                                                                                                                                                                                                                                                                                               Apr. 2012–Jan. 2013

             the mean density for multi-phase study areas resulting in
                                                                                                                                                                                                                                                                                                                                               July 2011–Sep. 2012

             . leopards/ km in the Overberg, compared to
             . leopards/ km (CI .–.) in the Langeberg and
                                                                                                                                                                                                                                                                                                                               Survey period

             . leopards/ km (CI .–.) along the Garden
             Route. The highest estimated density was Langeberg’s
             phase two with . leopards/ km, and the lowest was
             . leopards/ km in the Overberg (Table ).
                                                                                                                                                                                                                                                                                                                                               Garden Route

                 SPACECAP produced an Overberg density estimate of
                                                                                                                                                                                                                                                                                                                               Study area

                                                                                                                                                                                                                                                                                                                                               Langeberg

             . leopards/ km (CI .–.), Langeberg phase one
                                                                                                                                                                                                                                                                                                                                               Overberg

             and two density estimates of . (CI .–.) and . (CI
                                                                                                                                                                                                                                                                                                                                               Mean
                                                                                                                                                                                                                                                                                                                                               Total

             .–.) leopards/ km, respectively, and Garden

                           Oryx, 2021, 55(1), 34–45 © The Author(s), 2019. Published by Cambridge University Press on behalf of Fauna & Flora International doi:10.1017/S0030605318001473
Downloaded from https://www.cambridge.org/core. IP address: 46.4.80.155, on 22 Jan 2021 at 15:24:38, subject to the Cambridge Core terms of use, available at https://www.cambridge.org/core/terms.
https://doi.org/10.1017/S0030605318001473
Downloaded from https://www.cambridge.org/core. IP address: 46.4.80.155, on 22 Jan 2021 at 15:24:38, subject to the Cambridge Core terms of use, available at https://www.cambridge.org/core/terms.
                                                                                                                                                                                                      Oryx, 2021, 55(1), 34–45 © The Author(s), 2019. Published by Cambridge University Press on behalf of Fauna & Flora International doi:10.1017/S0030605318001473

                                                                                                                                                                                                                                                                                                                                                                       TABLE 2 Density estimates from programmes secr and SPACECAP, with standard error (SE), standard deviation (SD), % confidence intervals (CI), range of buffers that achieved mean
                                                                                                                                                                                                                                                                                                                                                                       density estimate stabilization, area of regional  km buffer, number of leopards estimated within the surveyed area, and the Bayesian P-value for model fit.

                                                                                                                                                                                                                                                                                                                                                                                           Density estimate                                         Buffer range of means’
                                                                                                                                                                                                                                                                                                                                                                                           (leopards/100 km2)                                       stabilization (km)                                 Estimated no. of leopards             P-value
                                                                                                                                                                                                                                                                                                                                                                                           secr                           SPACECAP                                                                     secr               SPACECAP
                                                                                                                                                                                                                                                                                                                                                                                           mean ± SE (95% CI)             mean ± SD (95% CI)        secr       SPACECAP      35 km buffer area (km2)   (95% CI)           (95% CI)           SPACECAP
                                                                                                                                                                                                                                                                                                                                                                       Langeberg
                                                                                                                                                                                                                                                                                                                                                                       Phase 1             0.29 ± 0.05 (0.20–0.41)        1.67 ± 0.26 (1.21–2.18)   15–35      15–30                                                                         0.86
                                                                                                                                                                                                                                                                                                                                                                       Phase 2             0.70 ± 0.15 (0.57–1.76)        2.11 ± 0.35 (1.46–2.82)   15–35      25–35                                                                         0.55
                                                                                                                                                                                                                                                                                                                                                                       Area mean           0.50 ± 0.10 (0.39–1.09)        1.89 ± 0.30 (0.89–2.50)                            19,063.42                 93.41              360.30             0.71
                                                                                                                                                                                                                                                                                                                                                                                                                                                                                                       (74.35–205.88)     (169.70–476.60)
                                                                                                                                                                                                                                                                                                                                                                       Garden Route
                                                                                                                                                                                                                                                                                                                                                                       Phase 1             0.50 ± 0.26 (0.19–1.32)        1.44 ± 0.58 (0.55–2.54)   15–35      20–30                                                                         0.47
                                                                                                                                                                                                                                                                                                                                                                       Phase 2             0.34 ± 0.11 (0.18–0.63)        0.92 ± 0.16 (0.65–1.22)   25–35      20–35                                                                         0.73
                                                                                                                                                                                                                                                                                                                                                                       Phase 3             0.29 ± 0.13 (0.13–0.67)        0.51 ± 0.10 (0.36–0.70)   20–35      15–35                                                                         0.60
                                                                                                                                                                                                                                                                                                                                                                       Area mean           0.38 ± 0.17 (0.17–0.87)        0.96 ± 0.28 (0.52–1.49)                             6,680.34                 25.39              64.13              0.60
                                                                                                                                                                                                                                                                                                                                                                                                                                                                                                       (11.36–58.12)      (34.74–99.54)
                                                                                                                                                                                                                                                                                                                                                                       Overberg

                                                                                                                                                                                                                                                                                                                                                                                                                                                                                                                                                            Leopard density in South Africa’s Western Cape
                                                                                                                                                                                                                                                                                                                                                                       Phase 1             0.17 ± 0.10 (0.06–0.48)        0.69 ± 0.30 (0.39–1.28)   30–35      25–35          7,910.04                 13.45              54.58              0.63
                                                                                                                                                                                                                                                                                                                                                                                                                                                                                                       (4.75–37.97)       (30.85–101.25)
                                                                                                                                                                                                                                                                                                                                                                       Overall mean        0.35 ± 0.12 (0.21–0.81)        1.18 ± 0.29 (0.60–1.76)                            11,217.93                 44.08              159.67             0.65
                                                                                                                                                                                                                                                                                                                                                                                                                                                                                                       (30.15–100.66)     (78.42–225.79)
                                                                                                                                                                                                                                                                                                                                                                       Total area without overlap1                                                                           29,258.43                 132.25             479.01
                                                                                                                                                                                                                                                                                                                                                                                                                                                                                                       (90.46–301.97)     (235.25–677.38)
                                                                                                                                                                                                                                                                                                                                                                       
                                                                                                                                                                                                                                                                                                                                                                       The area total is without  km buffer land overlap between survey areas.

                                                                                                                                                                                                                                                                                                                                                                                                                                                                                                                                                            39
40         C. H. Devens et al.

             Route phase one, two and three of . leopards/ km (CI                                Analysis with secr and SPACECAP resulted in an
             .–.), . leopards/  km (CI .–.) and . leo-                         overall estimated leopard density of . leopards/ km
             pards/ km (CI .–.), respectively. Again, we calcu-                             (CI .–.) and . leopards/ km (CI .–.) re-
             lated the mean density for multi-phase areas; the Overberg                              spectively. The output from SPACECAP includes a pixel
             was . leopards/ km, compared to . leopards/                                density file, which we converted into a fine-scale map
             km (CI .–.) in the Langeberg and . leopards/                                using QGIS, showing the variation of estimated animal
             km (CI .–.) along the Garden Route (Table ).                                    densities across each of the potential home range centres
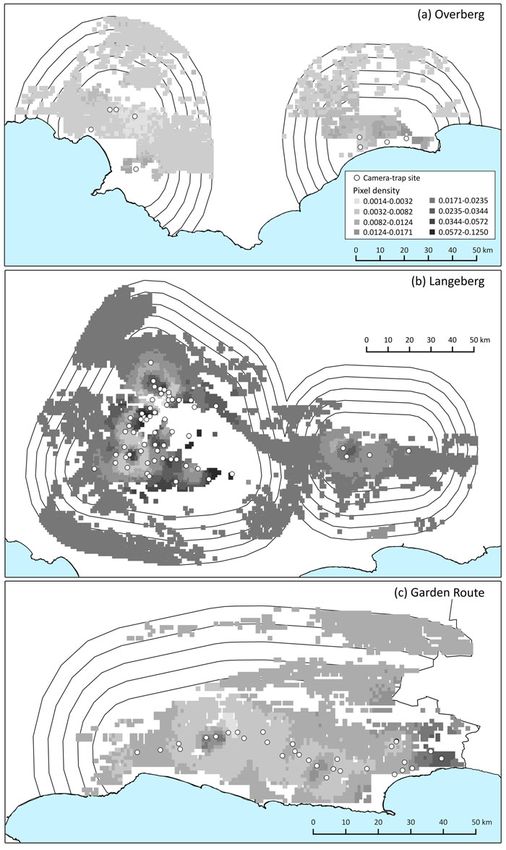
                                                                                                                                        FIG. 3 Pixelated ( km) SPACECAP
                                                                                                                                        leopard density maps showing the
                                                                                                                                        (a) Overberg, (b) Langeberg and
                                                                                                                                        (c) Garden Route study areas.
                                                                                                                                        Camera-trap sites shown are sites
                                                                                                                                        with individually identified leopards.

                           Oryx, 2021, 55(1), 34–45 © The Author(s), 2019. Published by Cambridge University Press on behalf of Fauna & Flora International doi:10.1017/S0030605318001473
Downloaded from https://www.cambridge.org/core. IP address: 46.4.80.155, on 22 Jan 2021 at 15:24:38, subject to the Cambridge Core terms of use, available at https://www.cambridge.org/core/terms.
https://doi.org/10.1017/S0030605318001473
Leopard density in South Africa’s Western Cape                      41

                                                                                                   estimate of  leopards (CI .–.) in the total study
                                                                                                   area (Table ).
                                                                                                      With the regional SPACECAP mean density estimates
                                                                                                   there would be c.  leopards (CI .–.) in the Garden
                                                                                                   Route,  leopards (CI .–.) in the Overberg and 
                                                                                                   leopards (CI .–.) in the Langeberg (Table ), yield-
                                                                                                   ing a total estimate of  leopards (CI .–.; Table ).
                                                                                                   Comparatively, using the total area of all three regions’
                                                                                                    km buffers (without overlap) and the overall SPACECAP
                                                                                                   mean density provides a population estimate of  leopards
                                                                                                   (CI .–.) for the entire study area (Table ).
                                                                                                      Our study area of ,. km comprises % of the
                                                                                                   Western Cape’s total area (, km). To provide a
                                                                                                   population outlook at the provincial level we extrapolated
                                                                                                   an ecologically useful Western Cape abundance estimate
                                                                                                   using our secr and SPACECAP mean density estimates
                                                                                                   and Swanepoel et al.’s () estimated , km of
                                                                                                   remaining suitable leopard habitat in Western Cape (%
                                                                                                   of the province). This suggests that the entire Western
                                                                                                   Cape could harbour as few as  (CI .–.) and as
           FIG. 4 Sum of SPACECAP leopard pixel density estimates                                  many as  (CI .–.) leopards (Table ).
           (leopards/km) for different land-cover types in the Western
           Cape study areas. ‘Agriculture’ includes cultivated commercial
           fields, orchards and plantations, ‘urban’ includes residential and
                                                                                                   Discussion
           urban commercial land, and ‘other’ includes dams, roads and
           railways.                                                                               This study covered c. , km and is one of the most
                                                                                                   extensive leopard camera-trap density estimate surveys con-
                                                                                                   ducted in the Western Cape province of South Africa. We
           (Fig. ). Using these pixel density values, we also created
                                                                                                   compared the use of two spatially explicit capture–recapture
           study area graphs depicting the sum of pixel densities across
                                                                                                   methods for a regionally imperilled disjunct leopard popu-
           land cover categories (CapeNature, ) and protected
                                                                                                   lation. Our comprehensive density analysis investigated
           areas (Department of Environmental Affairs, ; Fig. ).
                                                                                                   leopard persistence in a predominately human-modified
                                                                                                   and privately-owned landscape with varying degrees of
           Estimated population numbers                                                            conflict and persecution.
                                                                                                       It is important to reiterate that our study area incorpo-
           Combining this study’s total area with each region’s                                    rates variation across vegetation types, landscape topography
            km buffer width (Garden Route ,. km; Overberg                                 and degree of landscape modification and fragmentation.
           ,. km; Langeberg ,. km) with the regional                                Because of its highly cultivated agricultural landscape
           secr mean density estimates results in an estimate of  leo-                           (mainly grain production, as well as livestock farming), the
           pards (CI .–.) in the Garden Route,  leopards (CI                               Overberg is commonly considered as the breadbasket of the
           .–.) in the Overberg and  leopards (CI .–.)                               Cape. The Langeberg’s Breede River Valley is encircled by
           in the Langeberg (Table ). The total estimate for all areas                            the Cape Fold Mountain ranges and is dominated by
           combined was  leopards (CI .–.; Table ). In                                  fynbos, vineyards and orchards, whereas the Garden Route
           comparison, combining the total non-overlapping area                                    is a long stretch of the south-western coast situated between
           of all three study area’  km buffers (,. km) with                             mountains to the north and the Indian Ocean to the south,
           the overall secr mean density produces a population                                     which harbours a unique mixture of fynbos, indigenous

           TABLE 3 Comparison of estimated population size of leopards using the total area within this study’s  km buffer distance (without regional
           survey overlap) and Swanepoel et al.’s () estimate for suitable leopard habitat in the Western Cape.

           Area                                                                                secr (0.35 leopards/100 km2)             SPACECAP (1.18 leopards/100 km2)
           Total buffered area of this study (29,258.43 km2)                                   102.4 (95% CI 61.4–237.0)                345.3 (95% CI 175.6–515.0)
           Suitable leopard habitat in the Western Cape (49,850 km2;                           174.5 (95% CI 104.7–403.8)               588.2 (95% CI 299.1–877.4)
               Swanepoel et al., 2013)

           Oryx, 2021, 55(1), 34–45 © The Author(s), 2019. Published by Cambridge University Press on behalf of Fauna & Flora International doi:10.1017/S0030605318001473
Downloaded from https://www.cambridge.org/core. IP address: 46.4.80.155, on 22 Jan 2021 at 15:24:38, subject to the Cambridge Core terms of use, available at https://www.cambridge.org/core/terms.
https://doi.org/10.1017/S0030605318001473
42         C. H. Devens et al.

                                                                                                     predominantly non-conflict crop cultivation (vineyard and
                                                                                                     orchard) in a valley surrounded by natural mountain vege-
                                                                                                     tation. Additionally, the majority (%) of the estimated
                                                                                                     leopard pixel density on agricultural land across all study
                                                                                                     areas occurs in cultivated commercial fields and % occurs
                                                                                                     in forestry plantations, which can generally be considered
                                                                                                     non-conflict agriculture.
                                                                                                         All three areas demonstrate a discrepancy between suit-
                                                                                                     able habitat and land designated as protected for the conser-
                                                                                                     vation and sustainability of biodiversity (Figs  & ). The
                                                                                                     vast majority of each area’s estimated leopard pixel density
                                                                                                     occurs on non-protected land with the highest percentage
                                                                                                     occurring in the Overberg (%) (Fig. ; Supplementary
                                                                                                     Table ).
                                                                                                         Our secr and SPACECAP estimates are some of the lowest
                                                                                                     national density estimates for leopards and are comparable
                                                                                                     to three other studies in the Western Cape (Martins, ;
                                                                                                     Mann, ; Devens et al., ; Table ). The difference be-
                                                                                                     tween the estimates from the two programmes was greater
                                                                                                     than expected, which could be attributed partially to the
             FIG. 5 Sum of SPACECAP leopard pixel density estimates                                  extra Maxent habitat mask covariate modelling incorpo-
             (leopards/km) for suitable leopard habitat within protected and                        rated into the SPACECAP analyses. The likelihood method
             non-protected areas for each study area in the Western Cape.                            requires substantially less computation time than the
                                                                                                     Bayesian approach (seconds or minutes vs hours or days),
             temperate forest and forestry plantations. The agricultural                             is less sensitive to buffer width and data augmentation size
             land in all three areas is utilized by leopards, as evidenced                           and has greater convenience and versatility for customiza-
             by capture and recapture locations and suitable habitat                                 tion with covariates and models. SPACECAP entails checks
             extending beyond natural vegetation (Fig. ) and protected                              to verify that convergence is achieved, model fit is sufficient,
             area boundaries (Fig. ). None of our identified territorial                            and data augmentation is adequate. Hence, it is more
             adult leopards remained strictly within protected areas,                                appropriate and robust for small sample sizes. Our mean
             and most did not utilize any protected land within their                                SPACECAP density estimate of . leopards/ km is
             home range. Although protected areas play a crucial role                                directly comparable to results from Devens et al. (),
             in the conservation of natural landscapes, they do not                                  who reported mean density estimates of . and .–.
             encompass the entirety of remaining natural vegetation or                               leopards/ km for SPACECAP and two GPS methods,
             existing leopard habitat. In the Western Cape % of conser-                            respectively (Table ). The GPS methods used data from
             vation areas contain suitable leopard habitat but only % of                            collared leopards and incorporated home range size
             leopard habitat occurs within conservation areas (Swanepoel                             (home range density estimate) and home range overlap of
             et al., ).                                                                          same-sex neighbouring leopards (socially considerate dens-
                These findings, together with estimated leopard densities                            ity estimate). Therefore, we suggest our SPACECAP results
             within highly modified, cultivated and non-protected land                               are more accurate and reliable for determining the spatial
             (Figs  & ), suggest that non-protected, mostly privately                              requirements of species. We recommend spatially explicit
             owned land plays an important role in sustaining the                                    capture–recapture methods for future research, with the
             Western Cape leopard population. Both spatially explicit                                specific incorporation of GPS collar data, because these
             capture–recapture methods suggest that the Langeberg                                    methods are the most robust at capturing a species’ spatial
             winelands region supports the highest leopard density and                               ecology within a population.
             the Overberg’s agricultural landscape the lowest. The sum                                   We extrapolated an ecological density (number of indivi-
             of each study area’s pixel densities is consistent with these                           duals per useable area) using our density estimates and a
             findings (Fig. ). Although densities estimates vary between                            prediction of , km suitable leopard habitat remaining
             study areas, the composition of land-cover and protected                                in the Western Cape (Swanepoel et al., ). Our findings
             land utilized within each area is comparatively consistent                              suggest that there are – leopards remaining (Table ).
             (Supplementary Tables  & ). The Langeberg’s leopard                                   However, this may be an optimistic estimation. Habitat
             pixel densities on agricultural land are higher than in the                             modelling is not infallible and identified suitable habitat is
             other two study areas, and equal to the Garden Route’s                                  not necessarily useable for wide-ranging species such as the
             natural vegetation (Fig. ). This can be attributed to the                              leopard. The available habitat estimate included fragmented

                           Oryx, 2021, 55(1), 34–45 © The Author(s), 2019. Published by Cambridge University Press on behalf of Fauna & Flora International doi:10.1017/S0030605318001473
Downloaded from https://www.cambridge.org/core. IP address: 46.4.80.155, on 22 Jan 2021 at 15:24:38, subject to the Cambridge Core terms of use, available at https://www.cambridge.org/core/terms.
https://doi.org/10.1017/S0030605318001473
Leopard density in South Africa’s Western Cape                      43

           TABLE 4 Published South African leopard population density estimates for data collected after , with the analysis programme used.

           Region                                                           Source                                 Density estimate (leopards/100 km2)                 Programme1
           Various (Western Cape)                                           This study                             0.17–0.50 (mean 0.35)                               secr
                                                                                                                   0.69–1.89 (mean 1.18)                               SPACECAP
           Various (Western Cape, Eastern Cape)                             Devens et al. (2018)                   0.24–1.89 (mean 0.95)                               SPACECAP
                                                                                                                   0.90                                                HRDE
                                                                                                                   1.11                                                SCDE
           Little Karoo (Western Cape)                                      Mann (2014)                            0.50                                                CAPTURE
                                                                                                                   1.18                                                DENSITY
           Cederberg Mountains (Western Cape)                               Martins (2010)                         1.80–2.30                                           CAPTURE
           Phinda-Mkhuze Complex (Kwazulu-Natal)                            Balme et al. (2010)                    2.49–11.11                                          CAPTURE
           Zululand Rhino Reserve (Kwazulu-Natal)                           Chapman & Balme (2010)                 2.50–7.00                                           CAPTURE
           Phinda Private Game Reserve (Kwazulu-Natal)                      Braczkowski et al. (2016)              3.40                                                secr
                                                                                                                   3.65                                                SPACECAP
                                                                                                                   7.28–9.28                                           CAPTURE
           Waterberg Mountains (Limpopo)                                    Swanepoel et al. (2015)                4.56–6.59                                           secr
           Phinda Private Game Reserve (Kwazulu-Natal)                      Balme et al. (2009a)                   6.97                                                CAPTURE
           Phinda Private Game Reserve (Kwazulu-Natal)                      Balme et al. (2009b)                   7.17–11.21                                          CAPTURE
           Soutpansberg Mountains (Limpopo)                                 Chase Grey et al. (2013)               10.70                                               SPACECAP
           N’wanetsi Concession (Kruger National Park)                      Maputla et al. (2013)                  12.70                                               CAPTURE
           
            HRDE, home range density estimate; SCDE, socially considerate density estimate.

           habitat, small isolated pockets of habitat and areas of habitat                         Iris Englund Foundation, National Lotteries Distribution Trust
           subject to edge effects and anthropogenic pressures. These                              Fund, Mones Michaels Trust, Arne Hanson and the Deutsche Bank
                                                                                                   South Africa Foundation for assisting in funding this research. MJS
           factors can lead to habitat areas being unable to accommo-
                                                                                                   was supported by the National Research Foundation. We acknowledge
           date viable populations (Woodroffe & Ginsberg, ). In                                Landmark Foundation for providing the resources to enable this
           addition, our maximum Western Cape population estimate                                  research, and thank private landowners and CapeNature for their
           of  individuals is well below the minimum viable popu-                               cooperation and assistance.
           lation size necessary to maintain genetic diversity (Traill
                                                                                                   Author contributions Study conception: CHD, BS, JM; method-
           et al., ). The genetic population structure of leopards
                                                                                                   ology design, data collection and writing: CHD; data analysis: CHD,
           in the Western Cape and Eastern Cape provinces indicates                                TT; revisions: MS, MH, AD, TT, BS.
           very low to moderate gene flow between the three subpopu-
           lations (McManus et al., ).                                                         Conflicts of interest None.
               Although highly adaptable, the leopard is a widely per-
           secuted species that experiences varying levels of anthro-                              Ethical standards All authors have abided by the Oryx guidelines on
                                                                                                   ethical standards, and fieldwork was conducted with the necessary
           pogenic threats and habitat loss. Our results suggest that                              approvals and permits from appropriate institutions and statutory
           protected areas are inadequate to secure the long-term con-                             authorities. Cape Nature Research Permit to collect fauna specimens
           servation of leopards in the Western Cape. By establishing                              for scientific research in the Western Cape was granted to CHD in
           density and population size estimates in an increasingly                                August 2014 (permit no.: AAA007-00130-0056) and prior camera-
           fragmented and modified landscape, we increase the under-                               trap data was covered under a Cape Nature Permit for JM. These per-
                                                                                                   mits were granted for the purposes of collaring leopards. CHD was also
           standing of how leopards can persist in human-dominated
                                                                                                   granted an Animal Ethics Committee Approval Certificate from the
           areas, influencing conservation planning for the species. For                           University of Pretoria in February 2014–December 2016 (project num-
           adaptive and wide-ranging species such as large carnivores,                             ber: EC005-14). We did not collect specimens for this study, and all
           non-protected and human-dominated areas are becoming                                    fieldwork was conducted ethically with the cooperation of local conser-
           increasingly important for genetic dispersal and land-                                  vation authorities and landowners.
           scape connectivity (Boron et al., ). The threats and con-
           servation conflicts affecting the leopard in South Africa’s
           Cape region are affecting all apex carnivores globally.                                 References
           Accurate density estimates are critically important as                                  B A L M E , G.A., H U N T E R , L.T. & S LO TO W , R. (a) Evaluating
           numerous anthropogenic interests continue to threaten                                      methods for counting cryptic carnivores. Journal of Wildlife
           leopards, their resources and habitat.                                                     Management, , –.
                                                                                                   B A L M E , G.A., S LO T O W , R. & H U N T E R , L.T. (b) Impact of
           Acknowledgements We thank the ABAX Foundation,                                             conservation interventions on the dynamics and persistence
           Development Bank South Africa, Green Fund, United Nations                                  of a persecuted leopard (Panthera pardus) population. Biological
           Environmental Program, Global Environmental Facility, Henry and                            Conservation, , –.

           Oryx, 2021, 55(1), 34–45 © The Author(s), 2019. Published by Cambridge University Press on behalf of Fauna & Flora International doi:10.1017/S0030605318001473
Downloaded from https://www.cambridge.org/core. IP address: 46.4.80.155, on 22 Jan 2021 at 15:24:38, subject to the Cambridge Core terms of use, available at https://www.cambridge.org/core/terms.
https://doi.org/10.1017/S0030605318001473
44         C. H. Devens et al.

             B A L M E , G.A., S LO T OW , R. & H U N T E R , L.T.B. () Edge effects                               F O S T E R , R.J. & H A R M S E N , B.J. () A critique of density estimation
                 and the impact of non-protected areas in carnivore conservation:                                          from camera-trap data. The Journal of Wildlife Management, ,
                 leopards in the Phinda-Mkhuze Complex, South Africa. Animal                                               –.
                 Conservation, , –.                                                                            G E R B E R , B.D., K A R P A N T Y , S.M. & K E L LY , M.J. () Evaluating the
             B O R C H E R S , D.L. & E F F O R D , M.G. () Spatially explicit maximum                                 potential biases in carnivore capture–recapture studies associated
                 likelihood methods for capture–recapture studies. Biometrics, ,                                         with the use of lure and varying density estimation techniques using
                 –.                                                                                                  photographic-sampling data of the Malagasy civet. Population
             B O R O N , V., T Z A N O P O U LO S , J., G A L LO , J., B A R R A G A N , J., J A I M E S -                 Ecology, , –.
                 R O D R I G U E Z , L., S C H A L L E R , G. & P A Y Á N , E. () Jaguar densities                 G O P A L A S WA M Y , A.M., R OY L E , J.A., H I N E S , J.E., S I N G H , P., J AT H A N N A ,
                 across human-dominated landscapes in Colombia: the contribution                                           D., K U M A R , N.S. & K A R A N T H , K.U. () Program SPACECAP:
                 of unprotected areas to long term conservation. PLOS ONE, ,                                             software for estimating animal density using spatially explicit
                 e.                                                                                                 capture–recapture models. Methods in Ecology and Evolution,
             B R AC Z KO W S K I , A.R., B A L M E , G.A., D I C K M A N , A., F AT T E B E R T , J.,                      , –.
                 J O H N S O N , P., D I C K E R S O N , T. et al. () Scent lure effect on                         G R I F F I T H S , M. & VA N S C H A I K , C.P. () The impact of human traffic
                 camera-trap based leopard density estimates. PLOS ONE, ,                                                on the abundance and activity periods of Sumatran rain forest
                 e.                                                                                                 wildlife. Conservation Biology, , –.
             C A R D I L LO , M., P U R V I S , A., S E C H R E S T , W., G I T T L E M A N , J.L., B I E L B Y , J.   H A R C O U R T , A., P A R K S , S. & W O O D R O F F E , R. () Human
                 & M AC E , G.M. () Human population density and extinction                                            density as an influence on species/area relationships: double
                 risk in the world’s carnivores. PLOS Biology, , e.                                                    jeopardy for small African reserves? Biodiversity & Conservation,
             C A P E N AT U R E () / Western Cape Landcover Product.                                           , –.
                 Vector Geospatial Dataset. Western Cape Nature Conservation                                           H A Y WA R D , M.W., B O I TA N I , L., B U R R O W S , N.D., F U N S T O N , P.,
                 Board, Bridgetown, South Africa.                                                                          K A R A N T H , K.U., M AC K E N Z I E , D. et al. () Ecologists need to use
             C H A P M A N , S. & B A L M E , G. () An estimate of leopard population                                  robust survey design, sampling and analysis methods. Journal of
                 density in a private reserve in KwaZulu-Natal, South Africa, using                                        Applied Ecology, , –.
                 camera traps and capture–recapture models. South African Journal                                      H I J M A N S , R.J., C A M E R O N , S.E., P A R R A , J.L., J O N E S , P.G., J A R V I S , A.
                 of Wildlife Research, , –.                                                                        () Very high resolution interpolated climate surfaces for global
             C H A S E G R E Y , J.N., K E N T , V.T. & H I L L , R.A. () Evidence of a high                           land areas. International Journal of Climatology: a Journal of the
                 density population of harvested leopards in a montane                                                     Royal Meteorological Society, , –.
                 environment. PLOS ONE, , –.                                                                       J AC O B S O N , A.P., G E R N G R O S S , P., L E M E R I S , JR, J.R., S C H O O N O V E R , R.F.,
             C R O O K S , K.R. () Relative sensitivities of mammalian                                                 A N C O , C., B R E I T E N M O S E R -W Ü R S T E N , C. et al. () Leopard
                 carnivores to habitat fragmentation. Conservation Biology, ,                                            (Panthera pardus) status, distribution, and the research efforts
                 –.                                                                                                  across its range. PeerJ, , e.
             D E P A R T M E N T O F E N V I R O N M E N T A L A F F A I R S () South Africa                       J E N K S , G.F. () The data model concept in statistical mapping.
                 Protected Areas Database (SAPAD_OR__Q). Http://egis.                                                 International Yearbook of Cartography, , –.
                 environment.gov.za [accessed  March ].                                                          K A L L E , R., R A M E S H , T., Q U R E S H I , Q. & S A N K A R , K. () Density of
             D E V E N S , C., T S H A B A L A L A , T., M C M A N U S , J. & S M U T S , B. ()                        tiger and leopard in a tropical deciduous forest of Mudumalai Tiger
                 Counting the spots: the use of a spatially explicit capture–recapture                                     Reserve, southern India, as estimated using photographic capture–
                 technique and GPS data to estimate leopard (Panthera pardus)                                              recapture sampling. Acta Theriologica, , –.
                 density in the Eastern and Western Cape, South Africa. African                                        K A R A N T H , K.U. () Estimating tiger (Panthera tigris) populations
                 Journal of Ecology, , –.                                                                             from camera-trap data using capture–recapture models. Biological
             E F FO R D , M.G. () secr—spatially explicit capture–recapture in R.                                      Conservation, , –.
                 R package version ... Https://CRAN.R-project.org/package=secr                                      K A R A N T H , K.U. & C H E L L A M , R. () Carnivore conservation at the
                 [accessed  March ].                                                                                 crossroads. Oryx, , –.
             E F FO R D , M.G. () secr: Spatially explicit capture–recapture models.                               K A R A N T H , K.U. & N I C H O L S , J.D. () Estimation of tiger densities in
                 R package version ... Https://CRAN.R-project.org/package=secr                                         India using photographic captures and recaptures. Ecology, ,
                 [accessed  March ].                                                                                 –.
             E F FO R D , M.G. & F E W S T E R , R.M. () Estimating population size by                             K A R A N T H , K.U. & N I C H O L S , J.D. () Ecological Status and
                 spatially explicit capture–recapture. Oikos, , –.                                                Conservation of Tigers in India. Final Technical Report to the
             E F FO R D , M.G., B O R C H E R S , D.L. & B Y R O N , A.E. () Density                                   Division of International Conservation, US Fish and Wildlife
                 estimation by spatially explicit capture–recapture: likelihood-based                                      Service, Washington, DC, USA, Wildlife Conservation Society,
                 methods. In Modeling Demographic Processes in Marked                                                      New York, USA, and Centre for Wildlife Studies, Bangalore, India.
                 Populations (eds D.L. Thomson, E.G. Cooch & M.J. Conroy),                                             M A N N , G. () Aspects of the ecology of leopards (Panthera pardus) in
                 pp. –. Springer, New York, USA.                                                                     the Little Karoo, South Africa. PhD thesis, Rhodes University,
             E L L I S , E.C. & R A M A N K U T T Y , N. () Putting people in the map:                                 Grahamstown, South Africa.
                 anthropogenic biomes of the world. Frontiers in Ecology and the                                       M A P U T L A , N.W., C H I M I M B A , C.T. & F E R R E I R A , S.M. ()
                 Environment, , –.                                                                                  Calibrating a camera-trap based biased mark–recapture sampling
             E S T E S , J.A., T E R B O R G H , J., B R A S H A R E S , J.S., P O W E R , M.E., B E R G E R , J.,         design to survey the leopard population in the N’wanetsi
                 B O N D , W.J. et al. () Trophic downgrading of planet Earth.                                         concession, Kruger National Park, South Africa. African Journal of
                 Science, , –.                                                                                    Ecology, , –.
             FAO (F O O D A N D A G R I C U LT U R E O R G A N I Z A T I O N O F T H E U N I T E D                     M A R T I N S , Q.E. () The ecology of the leopard Panthera pardus
                 N AT I O N S ) () FAO GeoNetwork. Land Cover of South Africa –                                        in the Cederberg Mountains. PhD thesis, University of Bristol,
                 Globcover Regional. FAO, Rome, Italy. Http://www.fao.org/                                                 Bristol, UK.
                 geonetwork/srv/en/metadata.show?currTab=simple&id=                                               M C M A N U S , J., D I C K M A N , A., G AY N O R , D., S M U T S , B. &
                 [accessed  June ].                                                                                  M AC D O N A L D , D. () Dead or alive? Comparing costs and

                              Oryx, 2021, 55(1), 34–45 © The Author(s), 2019. Published by Cambridge University Press on behalf of Fauna & Flora International doi:10.1017/S0030605318001473
Downloaded from https://www.cambridge.org/core. IP address: 46.4.80.155, on 22 Jan 2021 at 15:24:38, subject to the Cambridge Core terms of use, available at https://www.cambridge.org/core/terms.
https://doi.org/10.1017/S0030605318001473
Leopard density in South Africa’s Western Cape                              45

               benefits of lethal and non-lethal human–wildlife conflict mitigation                            S O I S A LO , M.K. & C AVA L C A N T I , S.M.C. () Estimating the density
               on livestock farms. Oryx, , –.                                                             of a jaguar population in the Brazilian Pantanal using camera traps
           M C M A N U S , J., D A LT O N , D.L., K OT Z É , A., S M U T S , B. & D I C K M A N , A.              and capture–recapture sampling in combination with GPS
               () Gene flow and population structure of a solitary top                                        radio-telemetry. Biological Conservation, , –.
               carnivore in a human-dominated landscape. Ecology and Evolution,                                S WA N E P O E L , L.H., L I N D S E Y , P., S O M E R S , M.J., H O V E N , W.V. &
               , –.                                                                                        D A L E R U M , F. () Extent and fragmentation of suitable leopard
           M U C I N A , L. & R U T H E R FO R D , M.C. (eds) () The Vegetation of                            habitat in South Africa. Animal Conservation, , –.
               South Africa, Lesotho and Swaziland. South African National                                     S WA N E P O E L , L.H., S O M E R S , M.J. & D A L E R U M , F. () Density
               Biodiversity Institute, Pretoria, South Africa.                                                    of leopards Panthera pardus on protected and non-protected
           N O S S , A.J., G A R D E N E R , B., M A F F E I , L., C U É L L A R , E., M O N TA Ñ O , R.          land in the Waterberg Biosphere, South Africa. Wildlife Biology,
               et al. () Comparison of density estimation methods for mammal                                  , –.
               populations with camera traps in the Kaa-lya del Gran Chaco                                     T H A M M , A.G. & J O H N S O N , M.R. () The Cape Supergroup. In
               landscape. Animal Conservation, , –.                                                       The Geology of South Africa (eds M.R. Johnson, C.R. Anhaeusser &
           O B B A R D , M.E., H O W E , E.J. & K Y L E , C.J. () Empirical comparison                        R.J. Thomas), pp. –. Geological Society of South Africa,
               of density estimators for large carnivores. Journal of Applied Ecology,                            Johannesburg/Council for Geoscience, Pretoria, South Africa.
               , –.                                                                                      T H A P A , K., S H R E S T H A , R., K A R K I , J., T H A P A , G.J., S U B E D I , N.,
           P H I L L I P S , S.J., D U D I K , M., S C H A P I R E , R.E. () Maxent Software                  P R A D H A N , N.M.B. et al. () Leopard Panthera pardus fusca
               for Modelling Species Niches and Distributions (version ..).                                    density in the seasonally dry, subtropical forest in the Bhabhar of
               Http://biodiversityinformatics.amnh.org/open_source/maxent                                         Terai Arc, Nepal. Advances in Ecology, , –.
               [accessed  July ].                                                                        T R E V E S , A. & K A R A N T H , K.U. () Human–carnivore conflict and
           P H I L L I P S , S.J., A N D E R S O N , R.P. & S C H A P I R E , R.E. () Maximum                 perspectives on carnivore management worldwide. Conservation
               entropy modeling of species geographic distributions. Ecological                                   Biology, , –.
               Modelling, , –.                                                                        T R E V E S , A. & N A U G H T O N -T R E V E S , L. () Evaluating lethal control
           QGIS D E V E LO P M E N T T E A M () QGIS Geographic Information                                   in the management of human–wildlife conflict. Conservation
               System. Open Source Geospatial Foundation, Beaverton, USA.                                         Biology, , –.
               Http://qgis.osgeo.org [accessed  March ].                                                 T R E V E S , A., N A U G H T O N -T R E V E S , L., H A R P E R , E.K., M L A D E N O F F ,
           R C O R E T E A M () R: a Language and Environment for Statistical                                 D.J., R O S E , R.A., S I C K L E Y , T.A. & W Y D E V E N , A.P. ()
               Computing. R Foundation for Statistical Computing, Vienna,                                         Predicting human–carnivore conflict: a spatial model derived
               Austria. Http://www.R-project.org [accessed  July ].                                         from  years of data on wolf predation on livestock. Conservation
           R A Y , J.C., H U N T E R , L.T.B. & Z I G O U R I S , J. () Setting Conservation                  Biology, , –.
               and Research Priorities for Larger African Carnivores. Wildlife                                 T R A I L L , L.W., B R A D S H AW , C.J.A. & B R O O K , B.W. () Minimum
               Conservation Society, New York, USA.                                                               viable population size: a meta-analysis of  years of published
           R O U G E T , M., R E Y E R S , B., J O N A S , Z., D E S M E T , P., D R I V E R , A., M A Z E ,      estimates. Biological Conservation, , –.
               K. et al. () South African National Spatial Biodiversity                                    WCS (W I L D L I F E C O N S E R VA T I O N S O C I E T Y ) & CIESIN (C E N T E R
               Assessment : Technical Report. Volume : Terrestrial                                           F O R I N T E R N AT I O N A L E A R T H S C I E N C E I N F O R M AT I O N N E T W O R K )
               Component. South African National Biodiversity Institute,                                          () Last of the Wild Project, Version ,  (LWP-): Global
               Pretoria, South Africa.                                                                            Human Footprint Dataset (Geographic). NASA Socioeconomic Data
           R I P P L E , W.J., E S T E S , J.A., B E S C H TA , R.L., W I L M E R S , C.C., R I T C H I E ,       and Applications Center, Palisades, USA. Https://doi.org/./
               E.G., H E B B L E W H I T E , M. et al. () Status and ecological effects                       HMHF [accessed  June ].
               of the world’s largest carnivores. Science, , .                                       W O L F , C. & R I P P L E , W.J. () Range contractions of the world’s
           R S T U D I O T E A M () R Studio: Integrated Development for R.                                   large carnivores. Royal Society Open Science, , .
               RStudio, Inc., Boston, USA. Http://www.rstudio.com [accessed                                  W O O D R O F F E , R. () Predators and people: using human densities
               March ].                                                                                       to interpret declines of large carnivores. Animal Conservation, ,
           S I LV E R , S.C., O S T R O , L.E.T., M A R S H , L.K., M A F F E I , L., N O S S , A.J.,             –.
               K E L LY , M.J. et al. () The use of camera traps for estimating                            W O O D R O F F E , R. & G I N S B E R G , J.R. () Edge effects and the
               jaguar Panthera onca abundance and density using capture/                                          extinction of populations inside protected areas. Science, ,
               recapture analysis. Oryx, , –.                                                             –.

           Oryx, 2021, 55(1), 34–45 © The Author(s), 2019. Published by Cambridge University Press on behalf of Fauna & Flora International doi:10.1017/S0030605318001473
Downloaded from https://www.cambridge.org/core. IP address: 46.4.80.155, on 22 Jan 2021 at 15:24:38, subject to the Cambridge Core terms of use, available at https://www.cambridge.org/core/terms.
https://doi.org/10.1017/S0030605318001473
You can also read