Assumptions about fence permeability influence density estimates for brown hyaenas across South Africa
←
→
Page content transcription
If your browser does not render page correctly, please read the page content below
www.nature.com/scientificreports
OPEN Assumptions about fence
permeability influence density
estimates for brown hyaenas
across South Africa
Kathryn S. Williams1,2,9, Samual T. Williams1,2,3,4,9*, Rebecca J. Welch5,
Courtney J. Marneweck5, Gareth K. H. Mann7,8, Ross T. Pitman7,8, Gareth Whittington‑Jones7,
Guy A. Balme7,8, Daniel M. Parker5,6 & Russell A. Hill1,2,3
Wildlife population density estimates provide information on the number of individuals in an area
and influence conservation management decisions. Thus, accuracy is vital. A dominant feature in
many landscapes globally is fencing, yet the implications of fence permeability on density estimation
using spatial capture-recapture modelling are seldom considered. We used camera trap data from
15 fenced reserves across South Africa to examine the density of brown hyaenas (Parahyaena
brunnea). We estimated density and modelled its relationship with a suite of covariates when fenced
reserve boundaries were assumed to be permeable or impermeable to hyaena movements. The
best performing models were those that included only the influence of study site on both hyaena
density and detection probability, regardless of assumptions of fence permeability. When fences
were considered impermeable, densities ranged from 2.55 to 15.06 animals per 100 km2, but when
fences were considered permeable, density estimates were on average 9.52 times lower (from 0.17 to
1.59 animals per 100 km2). Fence permeability should therefore be an essential consideration when
estimating density, especially since density results can considerably influence wildlife management
decisions. In the absence of strong evidence to the contrary, future studies in fenced areas should
assume some degree of permeability in order to avoid overestimating population density.
Natural barriers such as bodies of water and mountain ranges influence movement patterns and gene flow in
wildlife populations1–3. Man-made physical barriers such as roads and fences similarly impact w ildlife4–7. With
the human population undergoing exponential growth and a continuing demand for ecotourism, enclosing
wildlife in fenced areas is widespread in southern Africa8,9. Fences demarcate boundaries, reduce human-wildlife
conflict, protect resources, and prevent disease transmission; yet they also disrupt the natural movement patterns
of animals, which can cause ecosystem imbalances such as reducing genetic influx and causing over-exploitation
of resources8,10. As a result, fencing for conservation is highly c ontroversial8,11.
In many parts of the world, wildlife is confined to fenced areas, and this is especially true in South Africa
where it is a legal requirement to fence an area containing dangerous game s pecies8,12. Although fences are often
successful at confining cattle and large herbivores, fences are semi-permeable for many mammals including some
large predators13–15. Holes under fences are created by erosion and by digging species16, and when a fence line is
breached, species detect and exploit holes q uickly17. To maintain the integrity of a fence, continuous upkeep is
required which is costly (approximately US $32,000 per annum to maintain 100 km of fencing in South Africa)16.
1
Department of Anthropology, Durham University, Dawson Building, South Road, Durham DH1 3LE,
UK. 2Primate and Predator Project, PO Box 522, Louis Trichardt 0920, South Africa. 3Department of Zoology,
University of Venda, Thohoyandou 0950, South Africa. 4Institute for Globally Distributed Open Research and
Education (IGDORE), Johannesburg, South Africa. 5School of Biology and Environmental Sciences, University of
Mpumalanga, Nelspruit 1200, South Africa. 6Wildlife and Reserve Management Research Group, Department of
Zoology and Entomology, Rhodes University, PO Box 94, Grahamstown 6140, South Africa. 7Panthera, 8 W 40th
Street 18th Floor, New York, NY 10018, USA. 8Institute for Communities and Wildlife in Africa, University of Cape
Town, Private Bag X3, Rondebosch 7701, South Africa. 9These authors contributed equally: Kathryn S. Williams
and Samual T. Williams. *email: samual.t.williams@gmail.com
Scientific Reports | (2021) 11:620 | https://doi.org/10.1038/s41598-020-77188-7 1
Vol.:(0123456789)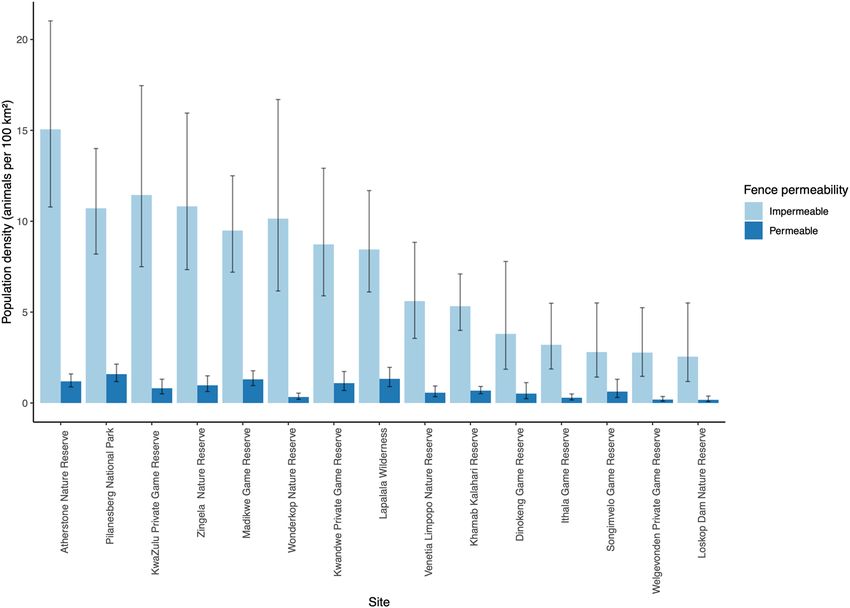
www.nature.com/scientificreports/
Maintenance of the majority of fences is underfunded in Africa, leading to a high occurrence of boundaries that
are semi-permeable for species such as mammalian c arnivores10.
In reserves where fences, including predator proof fences, are not maintained to the highest standard, brown
hyaenas (Parahyaena brunnea) transverse boundaries by digging new holes and opportunistically expanding
pre-existing holes18. Although brown hyaenas can survive, and often succeed, outside of protected areas, the
highest population densities of brown hyaenas have been reported in small fenced reserves that are thought to be
impermeable to the movement of brown h yaenas19–21. It is speculated that these brown hyaena population densi-
ties resulted from a lack of emigration, small reserve size, an abundance of large sympatric predators (carrion
providers), and high levels of prey a vailability19,21. The influence of these factors on hyaena population density
(the number of individuals per unit area), however, has not been tested.
Spatial capture-recapture (SCR) is a common method utilised to estimate densities from camera trap i mages22.
The state variable in SCR is a spatial point process where each point represents an individual’s activity centre,
and the state-space incorporates these regions of activity c entres23. The hypothesis being that animals with
activity centres outside of this state-space region have little chance of being captured23. One is free to specify
the state-space and therefore estimates will be biased if this area is so small that some captured animals have
activity centres outside of this region. In enclosed areas, some researchers restrict the state-space to fence lines
when estimating population densities of large carnivores using SCR modelling19,21,24,25. In open areas or fenced
areas where cross-boundary movement is probable, a larger state-space buffer is employed in SCR modelling to
encompass home ranges and activity centres that span beyond the study area26,27. How one deals with individuals
that do not necessarily reside within a reserve but do traverse, and are detected, within it (i.e. the definition of
the state-space), therefore has strong implications for the density estimates produced. The accuracy of density
estimates is paramount as they are often central to conservation management decisions, yet there is a paucity
of research on how assumptions regarding the permeability of fenced reserve boundaries (i.e. the defined state-
space) affects density estimates, especially for large carnivores.
Due to their small population size and high levels of intentional and accidental persecution, brown hyaenas
are listed as Near Threatened both globally28 and regionally in South Africa29. Their current resident range
is restricted to six countries including South Africa, which is thought to support approximately 20% of the
total remaining p opulation29. Furthermore, research into the distribution, population size, and trends of brown
hyaenas at a national scale has been identified as a top priority for brown hyaena c onservation28,29, requiring
reliable density estimates over a large area. In this study, we estimate the population density of brown hyaenas in
15 fenced reserves in South Africa, making two contrasting assumptions about the permeability of the reserve
boundary fences to the movement of brown hyaenas at each site: 1) reserve boundaries are impermeable (with
the state-space clipped to the reserve boundary fence line), and 2) reserve boundaries are permeable (with a
larger, unclipped state-space). We consider the repercussions of varying state-space in SCR modelling and the
implications for conservation management when assessing fenced areas. In addition, we investigate which factors
drive brown hyaena density at fenced sites and compare the results when fences are considered impermeable
and permeable.
Results
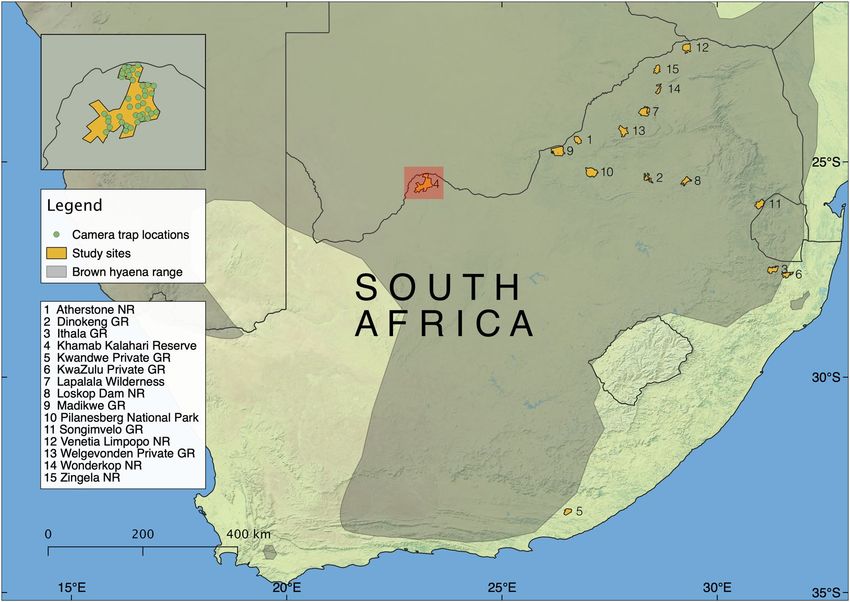
At 15 survey sites across South Africa (Fig. 1, Table 1) we collected 2690 camera trapping capture events of brown
hyaenas (Table S1). We discarded 298 (11.08%) brown hyaena captures because image quality was insufficient
to allow identification of individuals (Table S1). The majority of discarded captures had only one photograph
(n = 289); therefore, the hyaena was only visible from one side, making identification more difficult. A total of
362 identifiable brown hyaenas were captured on 2392 occasions (Table S1).
The top population density models relating to both assumptions of fence permeability included only the site
covariate on both g0 (detection probability when the distance between the activity centre of an animal and the
camera trap is zero) and on density (Table 2, Table S2). Density estimates derived from the top model ranged from
2.55 to 15.06 animals per 100 km2 at each site when fences were considered to be impermeable, and from 0.17 to
1.59 animals per 100 km2 when fences were considered to be permeable to hyaena movement (Fig. 2, Table S3).
When fences were assumed to be permeable, hyaena density estimates were on average 9.5 times lower than
when fences were assumed to be impermeable to hyaena movement. Furthermore, we found an inverse relation-
ship between reserve size and the ratio of brown hyaena density estimates modelled using different assumptions
about fence permeability (Fig. 3, Table 3). In contrast, population size estimates were 1.6 times greater for models
that assumed fence permeability (see Table S4). The general patterns of activity centre location were relatively
similar for both model permeable and impermeable formulations at most study sites (Fig. S1). Estimates in
smaller reserves were more sensitive to assumptions regarding the permeability of reserve boundaries to brown
hyaena movement.
Discussion
Our study represents the largest and widest-ranging collection of density estimates to date for brown hyaenas.
Our density estimates for each site varied substantially depending on whether fences were considered to be per-
meable or impermeable to the movement of brown hyaenas. Hyaena population densities were approximately
ten times greater among impermeable estimates than permeable estimates due to the state-space difference
associated with this assumption.
The population density of brown hyaenas has been estimated at only a handful of sites that are fully enclosed
by fencing19,21,32,33, despite fences encompassing a large proportion of protected and non-protected land through-
out the species range8,9,34. Overall, our estimates fit within the ranges of most previous studies20,21,35,36. Our
estimates for permeable fenced areas (0.17–1.59 animals per 100 k m2) were slightly lower than, but comparable
Scientific Reports | (2021) 11:620 | https://doi.org/10.1038/s41598-020-77188-7 2
Vol:.(1234567890)www.nature.com/scientificreports/
Figure 1. Map showing the locations of the survey sites where brown hyaena population densities were
estimated. Inset map shows an example layout of a camera trap array at Khamab Kalahari Reserve. In the legend
NR refers to Nature Reserve, and GR refers to Game Reserve. Created using QGIS 3.10.1030, using hyaena range
data from28 and base map data from31.
Minimum convex polygon of camera trap
Survey site Reserve size (km2) area (km2) Survey period Camera stations Survey effort (trap nights)
Atherstone Nature Reserve 240 180 Oct 2016–Dec 2016 36 1797
Dinokeng Game Reserve 185 173 Jul 2016–Aug 2016 36 1586
Ithala Game Reserve 296 236 July 2016–Sep 2016 30 1315
Khamab Kalahari Reserve 955 570 Aug 2016–Oct 2016 37 1744
Kwandwe Private Game Reserve 183 135 Mar 2017–Apr 2017 40 1860
KwaZulu Private Game Reserve 185 135 Nov 2015–Dec 2015 34 2645
Lapalala Wilderness 360 331 Oct 2016–Dec 2016 39 1932
Loskop Dam Nature Reserve 232 170 Oct 2016–Dec 2016 34 1774
Madikwe Game Reserve 600 306 Nov 2016–Dec 2016 36 1472
Pilanesberg National Park 550 247 Mar 2016–Apr 2016 40 1785
Songimvelo Game Reserve 490 112 Mar 2016–Apr 2016 27 1127
Venetia Limpopo Nature Reserve 316 237 Jul 2016–Aug 2016 39 1934
Welgevonden Private Game Reserve 375 203 Apr 2016–May 2016 40 1292
Wonderkop Nature Reserve 160 150 Jan 2015–Mar 2015 37 1579
Zingela Nature Reserve 219 177 May 2016–Jun 2016 39 1690
Table 1. Camera trap surveys in South Africa. Camera area is the minimum convex polygon area covered by
camera trap stations. Survey effort is the total number of trap nights each camera survey was active. Camera
area is the minimum convex polygon of the camera trap array.
Scientific Reports | (2021) 11:620 | https://doi.org/10.1038/s41598-020-77188-7 3
Vol.:(0123456789)www.nature.com/scientificreports/
Number of
Fence permeability Model parameters logLik AICc ΔAICc AICcwt
Impermeable g0 ~ session 17 − 13,583.25258 27,202.264 0 1
D ~ 1 g0 ~ ReserveSize 5 − 13,726.6259 27,463.418 261.154 0
g0 ~ PreyRAI 4 − 13,728.84766 27,465.806 263.542 0
g0 ~ HumanRAI 4 − 13,731.93908 27,471.989 269.725 0
D ~ 1 g0 ~ SpHyRAI 5 − 13,780.73571 27,571.638 369.374 0
D ~ 1 g0 ~ LeopardRAI 5 − 13,789.21782 27,588.602 386.338 0
D ~ 1 g0 ~ Human-
5 − 13,790.37303 27,590.913 388.649 0
Density
D ~ 1 g0 ~ 1 4 − 13,811.65901 27,631.429 429.165 0
D ~ 1 g0 ~ b 5 − 13,810.74387 27,631.654 429.39 0
D ~ session g0 ~ session 32 − 13,619.62238 27,309.587 0 1
D ~ HumanRAI g0 ~ ses-
19 − 13,656.18928 27,352.575 42.988 0
sion
D ~ 1 g0 ~ session 18 − 13,662.96435 27,363.9 54.313 0
D ~ SpHyRAI g0 ~ ses-
19 − 13,662.189 27,364.575 54.988 0
sion
D ~ PreyRAI g0 ~ ses-
19 − 13,662.4187 27,365.034 55.447 0
sion
D ~ LeopardRAI
19 − 13,662.96355 27,366.124 56.537 0
g0 ~ session
D ~ HumanDensity
19 − 13,663.26425 27,366.725 57.138 0
g0 ~ session
D ~ ReserveSize
19 − 13,667.47856 27,375.154 65.567 0
g0 ~ session
Permeable D ~ 1 g0 ~ session 18 − 13,758.6739 27,555.319 0 0.9571
D ~ 1 g0 ~ SpHyRAI 5 − 13,775.68221 27,561.531 6.212 0.0429
D ~ 1 g0 ~ HumanRAI 5 − 13,784.58262 27,579.332 24.013 0
D ~ 1 g0 ~ LeopardRAI 5 − 13,786.04496 27,582.257 26.938 0
D ~ 1 g0 ~ ReserveSize 5 − 13,788.84003 27,588.547 33.228 0
D ~ 1 g0 ~ Human-
5 − 13,799.30979 27,608.786 53.467 0
Density
D ~ 1 g0 ~ b 5 − 13,803.15885 27,616.484 61.165 0
D ~ 1 g0 ~ 1 4 − 13,807.76959 27,623.65 68.331 0
D ~ 1 g0 ~ PreyRAI 5 − 13,807.89884 27,625.964 70.645 0
D ~ session g0 ~ session 32 − 13,700.353 27,471.049 0.00 1
D ~ PreyRAI g0 ~ ses-
19 − 13,755.963 27,552.123 81.07 0
sion
D ~ SpHyRAI g0 ~ ses-
19 − 13,756.577 27,553.35 82.30 0
sion
D ~ HumanRAI g0 ~ ses-
19 − 13,756.795 27,553.786 82.74 0
sion
D ~ 1 g0 ~ session 20 − 13,758.674 27,555.319 84.27 0
D ~ LeopardRAI
19 − 13,758.376 27,556.948 85.90 0
g0 ~ session
D ~ HumanDensity
19 − 13,759.67107 27,559.539 88.49 0
g0 ~ session
D ~ ReserveSize
19 − 13,763.359 27,566.915 95.87 0
g0 ~ session
Table 2. Comparison of models of g0 and density fitted to camera trap data of brown hyaena captures across
South Africa. Parameters include: D (density estimate) and g0 (baseline detection). Covariates include: b
(learned response; g0 only); session (site), LeopardRAI (relative abundance index (RAI) of leopards), SpHyRAI
(RAI of spotted hyaenas), HumanRAI (RAI of humans), HumanDensity (population density of humans)
PreyRAI (RAI of prey species), ReserveSize (size of reserve). All models utilised the hazard rate detection
function. Models shown in bold are the top models within each subset.
with, the few available previous brown hyaena density estimates in permeable fenced reserves (approximately 3
animals per 100 k m232,33). When fences were assumed to be impermeable, our brown hyaena density estimates
(2.55-15.06 animals per 100 k m2) were also comparable to the high density estimates calculated using SCR in
fenced areas assumed to be impermeable to hyaena movements ( 1521 to 24.0119 brown hyaenas per 100 km2).
Scientific Reports | (2021) 11:620 | https://doi.org/10.1038/s41598-020-77188-7 4
Vol:.(1234567890)www.nature.com/scientificreports/
Figure 2. Population density estimates for brown hyaenas as each site assuming that fences were either
permeable or impermeable to hyaena movement. Error bars show 95% confidence intervals.
Figure 3. Relationship between reserve size and the ratio of brown hyaena population density estimates when
using differing assumptions of fence permeability.
Distribution AIC dAIC Degrees of freedom
Inverse Gaussian 87.0 0.0 3
Gamma 89.6 2.6 3
Null model 91.9 4.9 2
Gaussian 100.0 13.0 3
Table 3. Comparison of fit between models of the relationship between reserve size and the ratio of brown
hyaena density estimated using differing assumptions of fence permeability.
Scientific Reports | (2021) 11:620 | https://doi.org/10.1038/s41598-020-77188-7 5
Vol.:(0123456789)www.nature.com/scientificreports/
Many studies do not restrict the state-space to fence lines and reserve boundaries, resulting in relatively low
density estimates22,37–39. Less commonly the state-space is restricted to fences, often resulting in record high
densities19,21,24. Our results show that the corresponding change in the state-space buffer used in SCR analysis
when fences are assumed to be permeable or impermeable to animal movements results in substantially different
densities, even when using the same capture histories, which may have important repercussions with regard to
carnivore management objectives.
We found that the implications of truncating the state-space to the fence line are area dependant, where
smaller reserves are more sensitive to assumptions regarding fence permeability than larger reserves. In larger
areas, the trapping grid is likely located further away from the fence line, and thus density estimates are less
sensitive to the state-space defined because the individuals exposed to sampling in these areas should be mostly
those that have their activity centres within the reserve. In contrast, in smaller areas the trapping grid is likely
located closer to the fence line and thus the individuals exposed to sampling in these areas are more likely to
hold activity centres outside of the reserve. Consequently, assuming fences are impermeable (i.e. truncating
the state-space) in a small, enclosed reserve would likely yield highly over-estimated densities. This indicates
that decisions regarding fence permeability should not be taken lightly when studying less extensive reserves or
more fragmented habitats, which are relatively common in countries such as South Africa that make up a large
proportion of the range of brown hyaenas40,41.
In addition, we suggest a more nuanced approach to defining habitat. Brown hyaenas are likely to be able
to survive outside of protected areas across much of rural southern Africa. However, large carnivore densities
are likely to be higher within protected areas42. This is not reflected in the estimates of population size, which
assume equal habitat quality both within and outside of protected areas, and are thus likely to produce inflated
population estimates when fences are assumed to be permeable. We suggest that future studies acknowledge this
reality by including a measure of habitat quality into the state space mask used in SCR a nalyses43,44. This will allow
researchers to account for the likely permeability of reserve fences, while simultaneously modelling the probable
costs to individuals ranging outside of the reserve (lower habitat suitability, greater risk of persecution, etc.).
One of the main challenges of this study was the lack of reliable data on fence permeability and the extent of
movement by brown hyaenas at each survey site. Due to the size of the reserves, the number of survey sites, and
financial and temporal constraints, we were unable to accurately quantify the potential for brown hyaena move-
ment through fences, thus leading us to examine two extremes of fence permeability. The assumption of complete
permeability or impermeability is unlikely to be entirely accurate in the way predators use landscapes, and in
reality, the permeability of many fences will likely lie somewhere between these extremes. For example African
wild dogs (Lycaon pictus) can cross the “predator-proof ” fence surrounding our Pilanesberg National Park study
site45, so even predator-proof fencing often has some degree of permeability. Movement will be concentrated
around holes in the fence line, thus creating spatial heterogeneity in fence permeability. Furthermore, as animals
dig holes, fences are damaged or fall into disrepair, or fences are maintained, the degree of permeability will
change dynamically over time, compounding the challenge of making objective and meaningful assessments of
fence permeability. At present there is also no way of incorporating these data directly into available SCR models,
but the development of such models would be one way to help calculate more accurate density estimates in these
systems, should collection of fence quality data be possible. If fence holes are documented and remain persistent,
they could be modelled using non-euclidean distance methods and integrated into SCR models (M. Efford, pers.
comm.). The successful incorporation of permanent holes in density modelling will likely encourage methods
to be devised that consider movement through ephemeral holes.
For both scenarios of fence permeability, the models with the most support included only the site covariate
in models of both g0 and hyaena population density. This suggests that site-specific factors were stronger deter-
minants of brown hyaena abundance and detection probability than the other covariates included in the models.
It was interesting that no support was found for an association between the relative abundance index (RAI) of
competitor species and brown hyaena density, as variables were predictors of brown hyaena o ccupancy46. It is also
possible that RAI lacks the precision to tease out these effects, and covariates such as absolute leopard (Panthera
pardus) density may perform differently to leopard RAI, although these data are not yet available. Although RAI
can be biased by ecological factors and sampling design47, numerous camera trapping studies use RAI as a proxy
for covariates, especially when density estimates are u navailable39,46,48.
One potential caveat of the study is that camera trap spacing is a key element of SCR study design, so care
should be taken to ensure that bycatch data are used appropriately. Our results could therefore be biased by
estimating brown hyaena density using data that were collected using a design optimised for the estimation
of leopard density, if leopards had much larger home ranges than brown hyaenas. But since brown hyaenas
tend to have similar or larger home ranges than leopards49–51, we would expect the results to be comparable to
a survey dedicated to brown hyaenas, and we would design the camera trap arrays in a very similar pattern for
both species. Such a wide-ranging study using such a large dataset would not have been possible without using
bycatch data.
Conclusion
Assumptions regarding the permeability of fencing to the movement of brown hyaenas had a great influence on
population density estimates in SCR models, with density estimates being approximately ten times greater in
models assuming impermeable fences than in models assuming permeable fences. We recommend that research-
ers consider if the density estimates are appropriate to the definition of the state-space used and fence perme-
ability assumptions. We also suggest that further exploration of the distribution of estimated activity centres
within and outside reserves could help in providing recommendations for defining the state-space because our
results show that density estimates are heavily influenced by these assumptions. How these density estimates
Scientific Reports | (2021) 11:620 | https://doi.org/10.1038/s41598-020-77188-7 6
Vol:.(1234567890)www.nature.com/scientificreports/
are influenced by sampling a continuum across both sides of the fence is an important future avenue of research
to properly evaluate permeability assumptions. Of the covariates we included in the models, the site was the
only one that was associated with brown hyaena density. This assessment, the first on such a broad scale, will
provide useful baseline information for brown hyaena population monitoring and conservation programmes.
Our results show that large carnivore population density estimates are vastly inflated when fences are assumed
to be impermeable. These data may be misleading, resulting in poor management decisions. Consequently, we
strongly recommend that future studies assume a degree of fence permeability unless there is compelling evidence
to the contrary, ideally supported by additional sampling outside of the fenced area.
Methods
Study area. The study was conducted in 15 fenced reserves located in South Africa’s Eastern Cape, Gauteng,
KwaZulu-Natal, Limpopo, North West, and Mpumalanga provinces (Fig. 1). The reserves were (in alphabetical
order) Atherstone Nature Reserve, Dinokeng Game Reserve, Ithala Game Reserve, Khamab Kalahari Reserve,
Kwandwe Private Game Reserve, KwaZulu Private Game Reserve, Lapalala Wilderness, Loskop Dam Nature
Reserve, Madikwe Game Reserve, Pilanesberg National Park, Songimvelo Game Reserve, Venetia Limpopo
Nature Reserve, Welgevonden Private Game Reserve, Wonderkop Nature Reserve, and Zingela Nature Reserve.
The reserves ranged from 160 to 955 km2 in size (Table 1), and ecotourism is the main land use for all sites.
Kwandwe Private Game Reserve was the only site where brown hyaenas were reintroduced in the past 20 years21.
Human population density within 10 km of each reserve varied between provinces, ranging from a mean of 8
people per km2 in Limpopo to 214 people per km2 in Gauteng (data from52).
All camera trap surveys were enclosed within the fences of the reserve boundaries. Fence quality and the
level of maintenance varied between sites. Despite most reserve fences being electrified (n = 11), communica-
tion with landowners and managers, personal observations of fence line quality, and previous research indicate
brown hyaena movement through fences was thought to be theoretically possible at all sites with the exception
of Kwandwe Private Game Reserve. Kwandwe’s perimeter fence was checked for holes and maintained daily,
and a camera trap survey on adjacent properties did not record brown hyaenas, while they are abundant within
the reserve53.
Camera trap surveys. Camera trap surveys were established in each reserve to estimate the population
density of leopards using SCR modelling. Camera trap stations were separated by a mean of 2.05 (SD 0.48) km.
This spacing, based on the average home range size of female leopards, ensures that all leopards in the study area
have the opportunity to be photographed54. We utilised camera trap images of brown hyaenas collected by these
camera traps (bycatch data) to model the population density of brown hyaenas. Analysing bycatch data is an
efficient use of resources in conservation, provided species-specific methodological discrepancies are considered
and accounted for46,55,56. Bycatch data on brown hyaenas from camera traps initially set up to survey leopards
were used to successfully conduct occupancy analysis46. Similarities between leopards and brown hyaenas in
detectability on camera traps, height, use of roads and trails, home range size, and geographical overlap make
them an ideal pairing for data sharing opportunities46. This is the first study to estimate brown hyaena density
using bycatch data.
Brown hyaena home range size varies between h abitats21,32,36. Home range estimates collected at our survey
sites were only available for Kwandwe Private Game Reserve, Madikwe Game Reserve, and Pilanesberg National
Park21,51. The smallest recorded brown hyaena home range is at Kwandwe (26.32 km2), which relates to a maxi-
mum suggested camera spacing of 2.89 km21. Since Kwandwe is the second smallest reserve sampled and the
only reserve likely to be impermeable, it is probable that brown hyaenas in Kwandwe have one of the smallest
home range sizes of all survey sites. Since the spacing used in this study was smaller than the maximum sug-
gested spacing, all brown hyaenas with home ranges overlapping camera trapping survey areas had the chance
to be photographed, thus fulfilling key requirements of SCR modelling57.
Camera trap data were used to estimate brown hyaena density once at each reserve. Data collection for
this analysis was completed between January 2015 and April 2017, with the majority of data collected in 2016
(Table 1). The mean size of the reserves was 356 km2, which were surveyed using an average of 36 paired camera
trap stations (72 camera traps), covering a minimum convex polygon of 224 km2 for an average of 1702 trap
nights. Sampling periods were between 37 and 56 days, which was sufficiently brief to avoid violating the assump-
tion of a closed p opulation23,58, yet long enough for individuals to be photographed on multiple occasions59.
We placed Panthera V-series digital camera traps (camera models V4, V5, and V6) in locations large carni-
vores were likely to frequent such as on roads or game trails. Cameras were mounted on trees or poles in oppos-
ing but slightly staggered pairs to avoid the camera flash negatively affecting the images recorded by the paired
cameras. The paired setup ensured that both flanks of passing animals were photographed to aid identification.
We downloaded images and maintained the cameras on a weekly or fortnightly basis.
Data analysis. Citizen scientists identified species photographed in camera trap images to a species level
using the Zooniverse platform (www.zooniverse.org). To ensure confidence in identification, five independent
classifications were averaged per image. Brown hyaenas were then individually identified by two experienced
otches20. Both assessors verified each
assessors using unique features such as leg stripes, snare wounds, and ear n
image at least three times to ensure accurate identification. Any images that could not be accurately identified
were excluded from the a nalysis60. Brown hyaenas do not exhibit significant sexual d
imorphism61 and it was not
possible to distinguish between males and females. In situations where photographs only captured one side of
the animal, we included the most commonly photographed set of singular flanks (left or right) at each survey site
Scientific Reports | (2021) 11:620 | https://doi.org/10.1038/s41598-020-77188-7 7
Vol.:(0123456789)www.nature.com/scientificreports/
to avoid artificially inflating population estimates by counting an individual’s left and right flanks as two separate
individuals62,63. No images of immature individuals were collected, so this study relates to adults only.
Sampling occasions for brown hyaenas were defined as a 24-h period from 12:00 pm to 11:59 am. By incor-
porating the full duration of the night, we avoided the ‘midnight problem’ whereby an animal photographed on
both sides of midnight is recorded as separate c aptures64. This approach is recommended for species such as the
brown hyaena that is almost exclusively n octurnal27.
To estimate hyaena population density we fitted SCR models to the data within a maximum likelihood
framework using the package secr v. 3.2.165 in R 3.6.066. We fitted a multi-session model to our data, in which
each reserve was treated as a single s ession67. We fitted half-normal, hazard rate, and negative exponential detec-
tion functions to the data, and retained the function with the lowest Akaike information criterion corrected for
small sample sizes (AICc)68. The best supported spatial detection function was hazard rate, and this was used
in subsequent models (Table S5). The models of g0 with the AICc for both impermeable and permeable fences
included only the site covariate (Table 2). We therefore included site as a covariate on g0 in all models of popu-
lation density. We used the derived function in secr to compute estimates of g0 and density for each site within
each model. We modelled three parameters – population density, g0, and σ (the spatial scale parameter). We
also estimated population size using the region.N function in secr, and plotted activity centres from the fitted
model objects using the fx.total function in secr, which produces a map showing the probability of each pixel
in the habitat mask being the activity centre of both observed and unobserved individuals. This allowed us to
visually compare the spatial distribution of activity centres between fence-permeable and impermeable models
for each study site.
To investigate the relationship between brown hyaena density and a range of potential explanatory vari-
ables, we modelled the relationship between reserve size, and the RAI of prey, leopard, spotted hyaena (Crocuta
crocuta), and humans (on foot) on brown hyaena population density and g0. We also modelled the relationship
between site and g0, and we fitted a learned response model, in which the probability of detection at the home
range centre was affected by previous captures. Covariates were selected based on brown hyaena o ccupancy46,
and speculated, but previously untested, drivers of brown hyaena density19,21. We estimated human population
density in the area surrounding each reserve by calculating the mean density (humans per km2) within a 10 km
radius of the reserve boundaries (data f rom52). We calculated RAI as the number of captures per 100 camera-trap
days69,70. Captures excluded consecutive photographs of the same species at the same location more than once in
a 30 min interval71. Prey RAI included species with an average female weight of 15 kg or more, based on brown
hyaena dietary studies showing a preference for medium and large sized prey72–74. RAI values were standardised
as z-scores75. Covariates were included separately in each model, and models were compared using AICc68.
We retained all models with ΔAICc < 276. The final model used to estimate brown hyaena population densities
included the best models on g0 and density.
State space buffers were used to estimate home range centres that extend beyond the camera trapping a rea77.
To examine the role of the permeability of fences on reserve boundaries to the movement of study animals and
the resulting population density we fitted two sets of SCR models; one set in which the state space was restricted
to the fence line (impermeable), and one with the state space buffer extending beyond the fence line (perme-
able). We used the suggest.buffer function in secr and applied the largest buffer suggested (31 km) to all sites
in order to be conservative78. A home range centre spacing of 500 m was used in both sets of models. Areas
of human infrastructure uninhabitable to brown hyaenas were excluded from the habitat masks. Model fitting
was conducted using the Durham University High Performance Computing service. We tested the relationship
between reserve size and the ratio of hyaena population densities estimated using the two assumptions of fence
permeability (impermeable:permeable to hyaena movement) using a generalised linear model with an inverse
gaussian distribution. This approach was the best fit to our data, which did not have a normal distribution. Data
and code to reproduce the analyses are publicly available79.
Received: 20 March 2020; Accepted: 5 November 2020
References
1. Brumfield, R. T. & Edwards, S. V. Evolution into and out of the Andes: a Bayesian analysis of historical diversification in Thamno-
philus antshrikes. Evolution 61, 346–367 (2007).
2. Machado, A. P., Clément, L., Uva, V., Goudet, J. & Roulin, A. The Rocky Mountains as a dispersal barrier between barn owl (Tyto
alba) populations in North America. J. Biogeogr. 45, 1288–1300 (2018).
3. Patton, J. L., Da Silva, M. N. F. & Malcolm, J. R. Gene genealogy and differentiation among arboreal spiny rats (Rodentia: Echimyi-
dae) of the Amazon basin: a test of the riverine barrier hypothesis. Evolution 48, 1314–1323 (1994).
4. Trinkel, M. et al. Inbreeding and density-dependent population growth in a small, isolated lion population. Anim. Conserv. 13,
374–382 (2010).
5. Vanak, A. T., Thaker, M. & Slotow, R. Do fences create an edge-effect on the movement patterns of a highly mobile mega-herbivore?.
Biol. Conserv. 143, 2631–2637 (2010).
6. Parchizadeh, J. et al. Roads threaten Asiatic cheetahs in Iran. Curr. Biol. 28, R1141–R1142 (2018).
7. Williams, S. T., Collinson, W., Patterson-Abrolat, C., Marneweck, D. G. & Swanepoel, L. H. Using road patrol data to identify
factors associated with carnivore roadkill counts. PeerJ 7, e6650 (2019).
8. Hayward, M. W. & Kerley, G. I. H. Fencing for conservation: restriction of evolutionary potential or a riposte to threatening pro-
cesses?. Biol. Conserv. 142, 1–13 (2009).
9. Taylor, A., Lindsey, P., Davies-Mostert, H. & Goodman, P. An assessment of the economic, social and conservation value of the
wildlife ranching industry and its potential to support the green economy in South Africa. 1–163 (The Endangered Wildlife Trust,
Johannesburg, South Africa, 2015).
10. Pekor, A. et al. Fencing Africa’s protected areas: costs, benefits, and management issues. Biol. Conserv. 229, 67–75 (2019).
Scientific Reports | (2021) 11:620 | https://doi.org/10.1038/s41598-020-77188-7 8
Vol:.(1234567890)www.nature.com/scientificreports/
11. Woodroffe, R., Hedges, S. & Durant, S. M. To fence or not to fence. Science 344, 46–48 (2014).
12. Hayward, M. W. & Somers, M. J. An introduction to fencing for conservation. In Fencing for Conservation: Restriction of Evolution-
ary Potential or a Riposte to Threatening Processes? (eds Somers, M. J. & Hayward, M.) 1–6 (Springer, Berlin, 2012).
13. Cozzi, G., Broekhuis, F., McNutt, J. W. & Schmid, B. Comparison of the effects of artificial and natural barriers on large African
carnivores: implications for interspecific relationships and connectivity. J. Anim. Ecol. 82, 707–715 (2013).
14. Kesch, M. K., Bauer, D. T. & Loveridge, A. J. Break on through to the other side: the effectiveness of game fencing to mitigate
human—wildlife conflict. Afr. J. Wildl. Res. 45, 76–87 (2015).
15. Pirie, T. J., Thomas, R. L. & Fellowes, M. D. Game fence presence and permeability influences the local movement and distribution
of South African mammals. Afr. Zool. 52, 217–227 (2017).
16. Lindsey, P. A., Masterson, C. L., Beck, A. L. & Romañach, S. Ecological, social, and financial issues related to fencing as a conser-
vation tool in Africa. In Fencing for Conservation: Restriction of Evolutionary Potential or a Riposte to Threatening Processes? (eds
Somers, M. J. & Hayward, M.) 215–234 (Springer, Berlin, 2012).
17. Connolly, T. A., Day, T. D. & King, C. M. Estimating the potential for reinvasion by mammalian pests through pest-exclusion
fencing. Wildl. Res. 36, 410–421 (2009).
18. Kesch, K. M., Bauer, D. T. & Loveridge, A. J. Undermining game fences: who is digging holes in Kalahari sands?. Afr. J. Ecol. 52,
144–150 (2013).
19. Edwards, S., Noack, J., Heyns, L. & Rodenwoldt, D. Evidence of a high-density brown hyena population within an enclosed reserve:
the role of fenced systems in conservation. Mammmal Res. 64, 519–527 (2019).
20. Kent, V. T. & Hill, R. A. The importance of farmland for the conservation of brown hyaena, Parahyaena brunnea. Oryx 47, 431–440
(2013).
21. Welch, R. J. & Parker, D. M. Brown hyaena population explosion: rapid population growth in a small, fenced system. Wildl. Res.
43, 178–187 (2016).
22. Rogan, M. S. et al. The influence of movement on the occupancy–density relationship at small spatial scales. Ecosphere 10, e02807
(2019).
23. Efford, M. G. & Fewster, R. M. Estimating population size by spatially explicit capture–recapture. Oikos 122, 918–928 (2013).
24. Noack, J., Heyns, L., Rodenwoldt, D. & Edwards, S. Leopard density estimation within an enclosed reserve, Namibia using spatially
explicit capture-recapture models. Animals 9, 724 (2019).
25. Balme, G. et al. Big cats at large: Density, structure, and spatio-temporal patterns of a leopard population free of anthropogenic
mortality. Popul. Ecol. 61, 256–267 (2019).
26. Noss, A. J. et al. Comparison of density estimation methods for mammal populations with camera traps in the Kaa-Iya del Gran
Chaco landscape. Anim. Conserv. 15, 527–535 (2012).
27. Foster, R. J. & Harmsen, B. J. A critique of density estimation from camera-trap data. J. Wildl. Manag. 76, 224–236 (2012).
28. Wiesel, I. Parahyaena brunnea. The IUCN Red List of Threatened Species 2015: e.T10276A82344448., Available from http://dx.doi.
org/https://doi.org/10.2305/IUCN.UK.2015-4.RLTS.T10276A82344448.en [Accessed 1 March 2020] (2015).
29. Yarnell, R. et al. A conservation assessment of Parahyaena brunnea. In The Red List of Mammals of South Africa, Swaziland and
Lesotho (eds Child, M. F. et al.) (South African National Biodiversity Institute and Endangered Wildlife Trust, Midrand, 2016).
30. QGIS Development Team. QGIS Geographic Information System version 3.10.10. Open Source Geospatial Foundation Project
(Available from http://qgis.org) (2020).
31. Natural Earth.Available from http://www.naturalearthdata.com [Accessed Feb 01 2020] (2020).
32. Thorn, M., Scott, D. M., Green, M., Bateman, P. W. & Cameron, E. Z. Estimating brown hyaena occupancy using baited camera
traps. Afr. J. Wildl. Res. 39, 1–10 (2009).
33. Yarnell, R. W. et al. The influence of large predators on the feeding ecology of two African mesocarnivores: the black-backed jackal
and the brown hyaena. Afr. J. Wildl. Res. 43, 155–166 (2013).
34. Falkena, H. B. & van Hoven, W. Bulls, bears and lions: game ranch profitability in southern Africa (The South Africa Financial Sector
Forum, Midrand, 2000).
35. Thorn, M., Green, M., Bateman, P. W., Waite, S. & Scott, D. M. Brown hyaenas on roads: estimating carnivore occupancy and
abundance using spatially auto-correlated sign survey replicates. Biol. Conserv. 144, 1799–1807 (2011).
36. Wiesel, I. Predatory and foraging behaviour of brown hyenas (Parahyaena brunnea (Thunberg, 1820)) at cape fur seal (Arctocephalus
pusillus pusillus Schreber, 1776) colonies PhD thesis, University of Hamburg, (2006).
37. Brassine, E. & Parker, D. Trapping elusive cats: using intensive camera trapping to estimate the density of a rare African felid. PLoS
ONE 10, e0142508 (2015).
38. Ramesh, T., Kalle, R., Rosenlund, H. & Downs, C. T. Low leopard populations in protected areas of Maputaland: a consequence
of poaching, habitat condition, abundance of prey, and a top predator. Ecol. Evol. 7, 1964–1973 (2017).
39. Miller, J. R., Pitman, R. T., Mann, G. K., Fuller, A. K. & Balme, G. A. Lions and leopards coexist without spatial, temporal or
demographic effects of interspecific competition. J. Anim. Ecol. 87, 1709–1726 (2018).
40. Trinkel, M. et al. Translocating lions into an inbred lion population in the Hluhluwe-iMfolozi Park, South Africa. Anim. Conserv.
11, 138–143 (2008).
41. Thompson, S., Avent, T. & Doughty, L. S. Range analysis and terrain preference of adult southern white rhinoceros (Ceratotherium
simum) in a South African private game reserve: insights into carrying capacity and future management. PLoS ONE 11, e0161724
(2016).
42. Balme, G. A., Slotow, R. & Hunter, L. T. B. Edge effects and the impact of non-protected areas in carnivore conservation: leopards
in the Phinda-Mkhuze Complex, South Africa. Anim. Conserv. 13, 315–323 (2010).
43. Royle, J. A., Chandler, R. B., Sun, C. C. & Fuller, A. K. Integrating resource selection information with spatial capture–recapture.
Methods Ecol. Evol. 4, 520–530 (2013).
44. Proffitt, K. M. et al. Integrating resource selection into spatial capture-recapture models for large carnivores. Ecosphere 6, 1–15
(2015).
45. Davies-Mostert, H. T. et al. Long-distance transboundary dispersal of African wild dogs among protected areas in southern Africa.
Afr. J. Ecol. 50, 500–506 (2012).
46. Williams, K. S. et al. Utilizing bycatch camera-trap data for broad-scale occupancy and conservation: a case study of the brown
hyaena Parahyaena brunnea. Oryx, 1–11, (2020).
47. Sollmann, R., Mohamed, A., Samejima, H. & Wilting, A. Risky business or simple solution - Relative abundance indices from
camera-trapping. Biol. Conserv. 159, 405–412 (2013).
48. Palmer, M. S., Swanson, A., Kosmala, M., Arnold, T. & Packer, C. Evaluating relative abundance indices for terrestrial herbivores
from large-scale camera trap surveys. Afr. J. Ecol. 56, 791–803 (2018).
49. Swanepoel, L. H. et al. A conservation assessment of Panthera pardus. In The Red List of South Africa, Swaziland and Lesotho (eds
Child, M. F. et al.) (South African National Biodiversity Institute and Endangered Wildlife Trust, Midrand, 2016).
50. Williams, K. S. Human-brown hyaena relationships and the role of mountainous environments as refuges in a postcolonial landscape
PhD thesis, Durham University, (2017).
51. Richmond-Coggan, L. Comparative abundance and ranging behaviour of brown hyaena (Parahyaena brunnea) inside and outside
protected areas in South Africa PhD thesis, Nottingham Trent University, (2014).
Scientific Reports | (2021) 11:620 | https://doi.org/10.1038/s41598-020-77188-7 9
Vol.:(0123456789)www.nature.com/scientificreports/
52. WorldPop.South Africa 100m population, Available from https://www.worldpop.org/doi/https://doi.org/10.5258/SOTON/WP002
46. [Accessed 30 May 2020] (2013).
53. Welch, R. J. Population estimates and spatial ecology of brown hyaenas in Kwandwe Private Game Reserve MSc thesis, Rhodes
University, (2014).
54. Karanth, K. U., Nichols, J. D. & Samba-Kumar, N. Ch.7: Estimating tiger abundance from camera trap data: field surveys and
analytical issues. In Camera traps in animal ecology: methods and analyses (eds O’Connell, A. F. et al.) 97–118 (Springer, Berlin,
2011).
55. Edwards, S. et al. Making the most of by-catch data: assessing the feasibility of utilising non-target camera trap data for occupancy
modelling of a large felid. Afr. J. Ecol. 56, 885–894 (2018).
56. Mazzamuto, M. V., Valvo, M. L. & Anile, S. The value of by-catch data: how species-specific surveys can serve non-target species.
Eur. J. Wildl. Res. 65, 68 (2019).
57. Sun, C. C., Fuller, A. K. & Royle, J. A. Trap configuration and spacing influences parameter estimates in spatial capture-recapture
models. PLoS ONE 10, e0141634 (2014).
58. Otis, D. L., Burnham, K. P., White, G. C. & Anderson, D. R. Statistical inference from capture data on closed animal populations.
Wildlife Monogr. 62, 3–135 (1978).
59. Kays, R. W. & Slauson, K. M. Ch.5: Remote cameras. In Noninvasive survey methods for carnivores (eds Long, R. A. et al.) 110–140
(Island Press, Washington, 2008).
60. Williams, S. T., Williams, K. S., Lewis, B. P. & Hill, R. A. Population dynamics and threats to an apex predator outside of protected
areas: Implications for carnivore management. Roy. Soc. Open. Sci. 4, 1–10 (2017).
61. Mills, M. G. L. The comparative behavioural ecology of the brown hyaena Hyaena brunnea and the spotted hyaena Crocuta crocuta
in the southern Kalahari. Koedoe 27, 237–247 (1984).
62. Kent, V. T. The status and conservation potential of carnivores in semi-arid rangelands, Botswana the Ghanzi farmlands: a case study
PhD thesis, Durham University, (2011).
63. Satter, C. B. et al. Long-term monitoring of ocelot densities in Belize. J. Wildl. Manag. 83, 283–294 (2019).
64. Jordan, M. J., Barrett, R. H. & Purcell, K. L. Camera trapping estimates of density and survival of fishers Martes pennanti. Wildl.
Biol. 17, 266–276 (2011).
65. Efford, M. G. secr: Spatially explicit capture-recapture models. R package version 3.2.1. (Available from http://cran.r-project.org/
package=secr) (2019).
66. R Development Core Team. R: A language and environment for statistical computing. Version 3.6.0 (Available from https: //www.R-
project.org/.) (2019).
67. Bahaa-ed-din, L. et al. Effects of human land-use on Africa’s only forest-dependent felid: The African golden cat Caracal aurata.
Biol. Conserv. 199, 1–9 (2016).
68. Loock, D. J., Williams, S. T., Emslie, K. W., Matthews, W. S. & Swanepoel, L. H. High carnivore population density highlights the
conservation value of industrialised sites. Sci. Rep-UK 8, 16575 (2018).
69. Carter, N. H., Shrestha, B. K., Karki, J. B., Pradhan, N. M. B. & Liu, J. G. Coexistence between wildlife and humans at fine spatial
scales. Proc. Natl. Acad. Sci. U.S.A. 109, 15360–15365 (2012).
70. Treves, A., Mwima, P., Plumptre, A. J. & Isoke, S. Camera-trapping forest–woodland wildlife of western Uganda reveals how
gregariousness biases estimates of relative abundance and distribution. Biol. Conserv. 143, 521–528 (2010).
71. O’Brien, T. G., Kinnaird, M. F. & Wibisono, H. T. Crouching tigers, hidden prey: Sumatran tiger and prey populations in a tropical
forest landscape. Anim. Conserv. 6, 131–139 (2003).
72. Williams, K. S., Williams, S. T., Fitzgerald, L. E., Sheppard, E. C. & Hill, R. A. Brown hyaena and leopard diets on private land in
the Soutpansberg Mountains, South Africa. Afr. J. Ecol. 56, 1021–1027 (2018).
73. Maddock, A. H. Analysis of brown hyena (Hyaena brunnea) scats from the central Karoo, South Africa. J. Zool. 231, 679–683
(1993).
74. Maude, G. The comparative ecology of the brown hyaena (Hyaena brunnea) in Makgadikgadi National Park and a neighbouring
community cattle area in Botswana MSc thesis, University of Pretoria, (2005).
75. Harihar, A. & Pandav, B. Influence of connectivity, wild prey and disturbance on occupancy of tigers in the human-dominated
western Terai Arc Landscape. PLoS ONE 7, e40105 (2012).
76. Burnham, K. P. & Anderson, D. R. Model selection and multimodel inference: a practical information-theoretic approach 2nd edn.
(Springer, Berlin, 2002).
77. Balme, G. A., Hunter, L. T. B. & Slotow, R. Evaluating methods for counting cryptic carnivores. J. Wildl. Manage. 73, 433–441
(2009).
78. Gopalaswamy, A. M. et al. Program SPACECAP: software for estimating animal density using spatially explicit capture-recapture
models. Methods Ecol. Evol. 3, 1067–1072 (2012).
79. Williams, S. T. et al. R code and data for estimating brown hyaena density across South Africa. Available from https: //figsha re.com/s/
f958e721d38dff237bab (2020).
Acknowledgements
Funding was received from the Durham University COFUND research fellowship program, the National
Research Foundation (NRF), and Panthera. Opinions expressed and conclusions arrived at, are those of the
authors and are not necessarily to be attributed to the NRF. STW received funding from the University of Venda
postdoctoral grant. We are grateful to the Limpopo Department of Economic Development, Environment and
Tourism (LEDET), Ezemvelo KwaZulu-Natal Wildlife, the numerous reserves, Wildlife ACT, Wildlife and Eco-
logical Investments, and Siyafunda Conservation for their support. This research forms part of Camera CATa-
logue (www.cameracatalogue.org), a division of Panthera’s integrated data management system. We would like
to thank the Zooniverse (www.zooniverse.org), their staff, and the 12,500 citizen scientists for their assistance
in categorizing camera trap data. Our thanks also extend to Maria Gatta for assistance identifying individual
brown hyaenas, Matt Rogan for advice on fitting models, to Professor Murray Efford for his advice on secr, and
to Dr Henk Slim for helping to use the Durham University High Performance Computing service to speed up
data analysis.
Author contributions
K.S.W., R.A.H., D.M.P., G.K.H.M., R.T.P., and G.A.B. designed the study. R.T.P., G.K.H.M., G.W.-J., K.S.W.,
and S.T.W. conducted the fieldwork. K.S.W. and R.J.W. processed the images, and S.T.W., C.J.M., and G.K.H.M.
analysed the data. S.T.W. and G.K.H.M. prepared the figures. K.S.W. and S.T.W. led writing the manuscript, with
contributions from all authors.
Scientific Reports | (2021) 11:620 | https://doi.org/10.1038/s41598-020-77188-7 10
Vol:.(1234567890)www.nature.com/scientificreports/
Competing interests
The authors declare no competing interests.
Additional information
Supplementary information is available for this paper at https://doi.org/10.1038/s41598-020-77188-7.
Correspondence and requests for materials should be addressed to S.T.W.
Reprints and permissions information is available at www.nature.com/reprints.
Publisher’s note Springer Nature remains neutral with regard to jurisdictional claims in published maps and
institutional affiliations.
Open Access This article is licensed under a Creative Commons Attribution 4.0 International
License, which permits use, sharing, adaptation, distribution and reproduction in any medium or
format, as long as you give appropriate credit to the original author(s) and the source, provide a link to the
Creative Commons licence, and indicate if changes were made. The images or other third party material in this
article are included in the article’s Creative Commons licence, unless indicated otherwise in a credit line to the
material. If material is not included in the article’s Creative Commons licence and your intended use is not
permitted by statutory regulation or exceeds the permitted use, you will need to obtain permission directly from
the copyright holder. To view a copy of this licence, visit http://creativecommons.org/licenses/by/4.0/.
© The Author(s) 2021
Scientific Reports | (2021) 11:620 | https://doi.org/10.1038/s41598-020-77188-7 11
Vol.:(0123456789)You can also read