Regional Property Insights - TONY ALEXANDER NOVEMBER 2020 - First Mortgage Trust
←
→
Page content transcription
If your browser does not render page correctly, please read the page content below

TONY ALEXANDER
        Regional Property Insights
         NOVEMBER 2020

         SPONSORED BY

                             INVESTMENTS | PROPERTY FINANCE

© Tony Alexander and First Mortgage Trust                     ISSN 2744-3809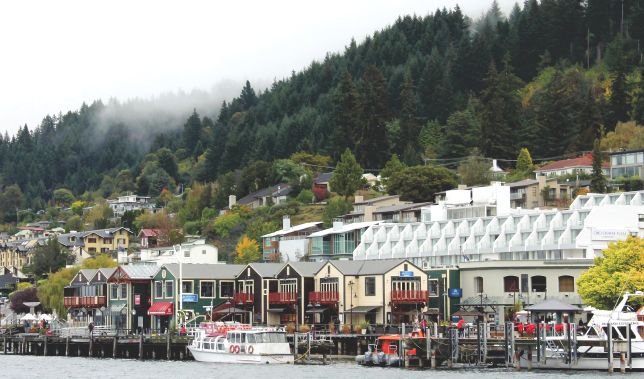

Contents
Introduction ............................................................... 2
Northland ................................................................... 5
Auckland .................................................................... 7
Waikato...................................................................... 9
Bay of Plenty ............................................................ 11
Gisborne .................................................................. 13
Hawkes Bay .............................................................. 15
Manawatu-Wanganui .............................................. 17
Taranaki ................................................................... 19
Wellington ............................................................... 21
Nelson & Tasman ..................................................... 23
Marlborough ............................................................ 25
West Coast ............................................................... 27
Canterbury ............................................................... 29
Dunedin City ............................................................ 31
Queenstown Lakes .................................................. 33
Southland ................................................................. 35

                                                                                  REGIONAL PROPERTY INSIGHTS – Issue November 2020   Page 1
Regional Property Insights
Introduction                                                 from October 2019, and 66% from October 2010 when
                                                             52,543 properties were listed for sale.
Welcome to the first edition of a new monthly report
focussing on underlying trends in residential property
markets around New Zealand’s regions. Motivation for
this report has come from the dominant focus of
commentary about real estate developments on just
the most recent month’s changes in things like prices
and sales. Usually, insufficient attention is devoted to
placing those developments in a longer-term context.

For instance, it may make for an attractive headline to
note that a location’s average selling price rose 10% in
a month. But if prices had fallen 8% over the previous
four months the headline fails to convey what is really
happening. This can lead to people, both buyers and          Measured as a comparison with the ten-year average
sellers, making decisions which don’t necessarily reflect    stock level for October, we see that nationwide stocks
what is really happening.                                    are 43% below average. In Gisborne, Coromandel,
                                                             Manawatu-Wanganui, and Marlborough they are near
So, each month in this report we will look at the most       70% below average. In the Wairarapa, currently
recent data from the likes of the REINZ and Statistics       enjoying a surge in buying from Wellingtonians, stocks
New Zealand but place it in the context of underlying        are 80% below their ten-year average.
trends. Where possible we will also undertake a
comparison with other regions, though space
limitations will mean generally the comparison will be
with the country overall.

In this Introduction section each month we will look at
nationwide developments and usually display some
graphs allowing direct comparisons between regions.
We won’t cover all residential real estate market
measures each month – there are simply too many of
them along with economic variables relevant to what
the market is doing and why. We’ll usually just select a
small number of two or three. Over the months, for
                                                             The unusual region is Auckland where stocks are only
each region, interested readers and researchers will be
                                                             9% below average. This might reflect the key dynamic
able to gain a better understanding of what their
                                                             of the period from 2016 to the end of last year, which
region of interest is doing and why.
                                                             was Auckland’s real estate market holding relatively
In this first issue we start by looking at something         flat while the rest of the country caught up in terms of
which is causing high anxiety amongst the many               sales volumes and prices.
frustrated property buyers currently – a lack of listings.
                                                             Is this situation of stock shortages easing? We first
The situation can perhaps best be summed up with
                                                             gauge that by looking at new listings. In October, the
these simple numbers.
                                                             number of new listings received nationwide was ahead
At the end of October, data from realestate.co.nz            by 7.6% from a year earlier. But to gauge whether this
showed that there were 17,875 properties listed for          increase is getting better or worse we present this
sale all around New Zealand. This total was down 20%         year’s new listings received each month with listings

                                                                    REGIONAL PROPERTY INSIGHTS – Issue November 2020   Page 2
Regional Property Insights
received for the same month a year ago in the               2016, the time might look right for price movements to
following graph. There is growth, but it seems to be        pause for a while.
shrinking. One cannot necessarily say that the
attraction of firmly rising prices is bringing forth an     For all of New Zealand, the REINZ House Price Index
ever-increasing number of properties to the market.         (HPI) rose by 3.5% in October, to sit 7.3% above its
                                                            level in March before the full effects of the Covid-19
                                                            shock started to be felt.

In fact, in the REINZ & Tony Alexander Real Estate
Survey for November, a net 15% of the 382 responding
agents said that they are in fact seeing fewer investors    The change from a year earlier was 13.5% (shown as
coming forward to sell their properties. A net 32% of       three-month averages from a year ago in the above
agents did however note that they are receiving more        graph). This was the strongest rate of increase since
requests for property appraisals from prospective           December 2016 when price growth was slowing from
sellers. So, there is still some hope for the many          an 18.2% peak mid-2015 in response to a tightening of
frustrated buyers out there.                                Loan to Value Ratio regulations in October 2015 and
                                                            again from October 2016 (though applied by banks
In the regional sections making up the bulk of the          from July 2016). That last LVR change was a 40%
Regional Property Insights report, we examine trends        minimum deposit requirement applied to investor
in listing stocks and new listings for each region to see   buyers and it had the effect discussed in the Auckland
if any location may be bringing forth good numbers for      section below, of all but stopping house price inflation
buyers to choose amongst.                                   there while about halving it elsewhere.

The second main focus for this first issue of the           Thus, we can expect that as banks reapply a 30%
Regional Property Report is on regional prices in terms     minimum requirement for investors now, we will see
of their ratio with all of New Zealand. We know that        the pace of growth in house prices slow down from the
average dwelling prices in Auckland are well above          recent unsustainable and undesirable pace.
those of all other regions. But for each region we can
work out what the trend relationship is between its         The following table lists the regions which we cover in
prices and those of the country as a whole. We can see      this monthly report and shows two columns of percent
whether the trend is up, down, or flat, and gauge           changes. The first is the average house price in the year
where a region is compared with that trend – above it,      to October compared with 1993. We can see that
below it, or on it.                                         average house prices in Auckland have risen in total by
                                                            584%, Gisborne 389%, Canterbury 288% for instance.
This sort of analysis cannot allow one to derive a
prediction of where house prices will go in a region.       The second column shows the average annual rise in
But they may indicate whether, like Auckland was in         prices achieved over this 25-year period. It shows for
                                                            instance that Auckland prices on average have risen by

                                                                   REGIONAL PROPERTY INSIGHTS – Issue November 2020   Page 3
Regional Property Insights
7.7% per annum, Southland 6.5%, and Queenstown
Lakes 8.3%. Earthquake-affected Canterbury with the
benefit of a plentiful supply of flat land has recorded
just a 5.4% average annual increase.

1993-20                     % rise      % per annum
                                          average
Northland                    387            6.4
Auckland                     584             7.7
Waikato                      445             6.7
Bay of Plenty                445             6.8
Gisborne District            389             6.4
Hawkes Bay                   393             6.4
Manawatu/Wanganui            326             5.7
Taranaki                     350             6.0
Wellington                   467             6.7
Tasman District              379             6.4
Nelson City                  359             6.1
Marlborough District         324             5.8
West Coast                   339             6.0
Canterbury                   288             5.4
Dunedin City                 401             6.5
Queenstown Lakes             580             8.3
Southland                    402             6.5
New Zealand                  464             6.8
NZ ex. Akld                  392             6.3

Readers are advised not to focus excessively on the
specific differences between regions. A simple change
in the starting year for these calculations can produce
1%-point changes in the gap between regional average
price changes because of the different stages in the
price cycle which regions can be in at any particular
time. Even a one-year shift in starting point for
Auckland changes the cumulative price gain from 584%
to 484%.

Further extensive discussion of house price movements
and factors affecting prices can be found in the weekly
Tony’s View publication available from
www.tonyalexander.nz

                                                          REGIONAL PROPERTY INSIGHTS – Issue November 2020   Page 4
Regional Property Insights
Northland
At the end of October, the number of properties listed
for sale in Northland was 536 or 38% down from one
year ago and 78% lower than ten years ago. There has
been a strong decline in stock since the start of 2015
and although the situation plateaued for a while from
2017-2019, since mid-2019 availability has resumed
falling.

                                                           We can perhaps more explicitly get a feel for how tight
                                                           things are getting in Northland by looking at stock
                                                           measured in terms of how many weeks of sales it
                                                           would be able to sustain. The following graph shows
                                                           that October stocks would sustain only 26 weeks’
                                                           worth of sales which is 58 weeks below the average for
                                                           the past ten years. A year ago, the weeks’ worth of
                                                           stock was 38. So, things have tightened up
                                                           considerably.
There is no indication that this situation is improving,
and in future issues of the Regional Property Report we
will look at how internal migration out of Auckland to
Northland is likely to keep demand for property high.

                                                           In an environment of strong housing demand
                                                           nationwide driving strong sales, as one would expect
                                                           this shortage of stock is impacting on prices.

                                                           Price Trends
With regard to the number of new listings coming
                                                           On average since 1993 Northland house prices have
forward, the following graph shows this year’s new
                                                           risen by 6.4% per annum which is just below the NZ
listings received by agents as the green line, and new
                                                           average pace of increase at 6.8%. For each section this
listings received for the same month in 2019 as the
                                                           month we will include a version of the following graph.
blue line. There is no trend toward more new listings
                                                           It measures a 12-month average of the ratio between
emerging.
                                                           Northland’s House Price Index compiled by REINZ, and
                                                           the NZ-wide price index. The green line showing the
                                                           average ratio does not move in a straight line.
                                                           Sometimes Northland prices rise at a faster pace than

                                                                  REGIONAL PROPERTY INSIGHTS – Issue November 2020   Page 5
Regional Property Insights
the country overall and the line pushes up. Sometimes       assume greater potential for capital gain than in an
growth is below the NZ average, and the line falls          alternative region.
away.
                                                            So, take care, but hopefully readers will find some
Running through the curve is a straight trendline which     usefulness from these graphs.
can give insight into the fact that broadly speaking,
Northland prices are falling slowly behind the NZ           This second price graph shows the pace of change in
average.                                                    Northland’s house prices compared with the national
                                                            average since 2015. The measure used is a three-
                                                            month average which helps get around the messiness
                                                            generated by often quite volatile monthly data.

                                                            We can see that the extent to which Northland house
                                                            price inflation has been exceeding the NZ average pace
                                                            has been slowing since 2017.

The graph indicates that since 2016 the pace of growth
in Northland’s house prices has been stronger than the
NZ rate. It also indicates that after a period of above-
trend prices from 2006-2011, then below trend from
2012-2017, prices have since 2019 been tracking at
above trend levels.

When considering what this might mean for price             In future issues of Regional Property Insights, we will
changes from here on out, care is required. An analyst      examine the range of factors which can influence
might undertake analysis of a frequently repriced asset     relative price movements such as internal migration,
such as a listed share, currency, precious metal, or        the pace of jobs growth, and growth in housing supply.
housing market, and conclude the asset is over-valued.
But if they were to tell you it is, say, 40% over-valued,
that is not a forecast that the price will now fall.

Before the asset was 40% over-valued it was 10%
above trend and the price kept rising, then 20%, then
30%. Perhaps the only reason the asset is above trend
by 40% is because it is on its way to being over-valued
by 80%.

The intention of the long-term price graph included in
each region’s section this month is not to promote a
potential forecast of where prices will next go. It is
merely aimed at suggesting in which regions things
might have become highly heated and in which regions
a buyer with a long-term horizon might reasonably

                                                                   REGIONAL PROPERTY INSIGHTS – Issue November 2020   Page 6
Regional Property Insights
Auckland
In Auckland at the end of October there were 7,500
properties listed for sale. This was a decrease of 555 or
7% from a year earlier and one of the smaller
decreases in stock seen around the country. For all NZ
excluding Auckland, stock numbers have fallen by 28%
over the past year.

                                                            Why might listings growth be so strong in Auckland?
                                                            Some may reflect extra central city properties coming
                                                            on the market because of the absence of foreign
                                                            students and tourists occupying apartments. But a lot
                                                            will reflect the fact that house construction is very
                                                            strong in Auckland and at 63% the ratio of dwelling
                                                            consents issued as a proportion of annual sales is
                                                            second only to the Tasman region beside Nelson.
Auckland has experienced a different pattern of stock
shortages from the rest of the country, and much of
this can be put down to Auckland having an unusual
surge in sales and prices from 2011-2015 whereas
much of the rest of the country was quiet.

As the graph above shows, listings noticeably increased
from mid-2016 and some of this may be due to
investors selling to finance purchases outside of
Auckland. Is this pattern of less stock shortage in
Auckland compared with the rest of the country
changing? Not really.
                                                            As long as house construction remains strong in
In October there were 3,827 new property listings
                                                            Auckland, and the switching of frustrated young buyers
received for Auckland which was a 32% gain from
                                                            to building from buying an existing property suggests it
October 2019. This was the highest gain for all regions,
                                                            will, then new listings growth will likely remain firm in
with only Otago coming close at a 21% rise.
                                                            Auckland.

                                                            In terms of weeks’ worth of stock, Auckland stood at 12
                                                            in October, down from 20 a year earlier, with a
                                                            downward trend underway. Things are tightening up.

                                                                   REGIONAL PROPERTY INSIGHTS – Issue November 2020   Page 7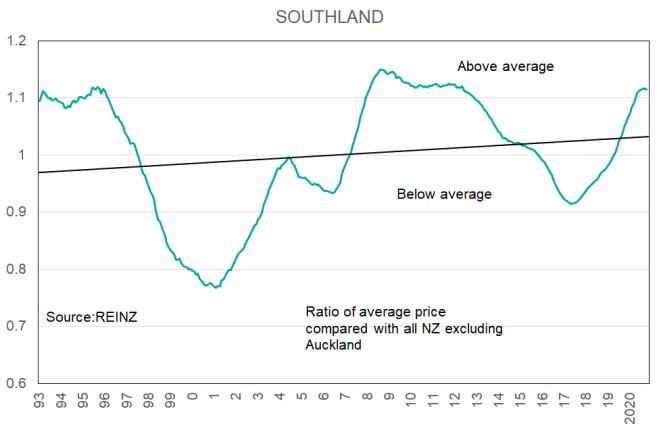
Regional Property Insights

Prices                                                 Why did Auckland’s housing market under-perform so
On average since 1993 Auckland house prices have       much pricewise from 2016? Probably two main
risen by 584% compared with 464% for all of New        reasons.
Zealand excluding Auckland. The average pace of
increase has been 7.7% a year compared with 6.3% for   First, as the first price graph suggests, the city was
non-Auckland New Zealand.                              achieving price levels well above the long-term trend.
                                                       Valuations were getting stretched compared with the
In the following graph the trend in Auckland house     rest of the country and one might be able to say that
prices versus the rest of New Zealand is seen to be    the city was due for a correction.
upward, represented by the black straight line. The
pace of increase in prices in Auckland was above the   Second, effective from July 2016 the minimum 30%
non-NZ average from 2010 to 2016. It then shifted to   deposit required by property investors purchasing in
below average growth from 2016 to the middle of this   Auckland was lifted to 40% and applied to the rest of
year.                                                  the country. While this caused a slowing in the pace of
                                                       prices growth outside of Auckland, in the city it acted
                                                       as a trigger for the relative price correction to
                                                       commence.

                                                       This final graph ending in 2018, shows how from the
                                                       second half of 2016 price growth in Auckland’s housing
                                                       market almost ceased.

This graph, plus other data, suggest that the period
from 2016-19 when the Auckland housing market sat
“fallow”, has ended.

This next graph showing Auckland annual house price
inflation less the rest of country shows this quite
clearly.

                                                              REGIONAL PROPERTY INSIGHTS – Issue November 2020   Page 8
Regional Property Insights
Waikato
In the Waikato, the stock of property listings at the end
of October stood at 1,238. This was down 407 or 25%
from a year ago which was about in line with the 28%
decline for all New Zealand excluding Auckland where
listings were ahead 32%.
The contrast with Auckland’s other two nearby regions
of Northland and Bay of Plenty where new listings are
not as strong is interesting.
Measured as weeks’ worth of stock, Waikato stood at
10 in October from 16 last year with a slow trend
downward underway. Listings availability is still
tightening up.
Like most other parts of the country apart from
Auckland, listings in recent years have been running
well below average for the relevant months over the
past decade.
Prices
Since 1993 average house prices in the Waikato region
have risen by 445% compared with an NZ-wide rise of
464%. The average annual price gain of 6.7% for the
The above graph suggests that the stock shortage may
region is just below the NZ-wide average rise of 6.8%,
be worsening. But in October 724 new listings were
though above the 6.3% average annual rise if we
received which was a 13% improvement from 639 a
exclude Auckland.
year earlier. In September the gain from a year ago was
22%, and in August 25%. Waikato is experiencing gains
in new listings well ahead of NZ excluding Auckland
averages in recent months.
REGIONAL PROPERTY INSIGHTS – Issue November 2020 Page 9Regional Property Insights
One reason for this ending of a period of price out-
performance may be the high number of dwelling
consents being issued in the Waikato producing a
supply response not apparent in most other regions.
This following graph shows the annual number of
dwelling consents issued in Waikato in relation to the
average for the past ten years of some 2,800 per
annum represented by the sold horizontal black line.
The following graph shows a very small downward
trend in Waikato prices relative to the NZ average since
1993. However, this graphically presented relative
weakening mainly reflects the starting point of the
graph where Waikato was at the end of a period of
experiencing prices at above trend levels. We will
observe the same mild tendency for a downward bias
in some other regional graphs below.
The key to addressing New Zealand’s high level of
house prices compared with incomes lies in strongly
boosting house supply and in particular the
construction of lower-priced dwellings. Up until the
mid-1990s about 25% of dwellings built in New Zealand
were priced at the lower end of the market for each
region. But since the mid-1990s this proportion has
been closer to 5%.
That may be changing now but it will take a great
number of years to substantially change the proportion
Since 2016 Waikato house prices on average have been of more affordable houses in any region’s housing
rising at a pace above the NZ average but that stock given that on average new construction adds only
tendency is showing signs of ending after a fairly some 1.5% to the nationwide housing stock.
substantial relative gain in prices for 2016.
REGIONAL PROPERTY INSIGHTS – Issue November 2020 Page 10Regional Property Insights
Bay of Plenty The Bay of Plenty is not experiencing the same strong
growth in dwelling construction as many other parts of
In the Bay of Plenty listings stocks at the end of
New Zealand and that means growth in listings from
October stood at 966 properties, down 427 or 31%
that source is relatively light. (See the graph of dwelling
from a year earlier. This decline is about in line with the
consents as a proportion of sales in the Auckland
average fall for the year outside of Auckland of 28%.
section.)
The 80% decline from stock levels ten years ago in
October 2010 is similarly only slightly greater than the There was just seven weeks’ worth of stock in Bay of
ex-Auckland average fall of 73%. Plenty at the end of October, down from 15 a year
earlier and third equal lowest in the country with
Nelson and behind six weeks for Manawatu-Wanganui
and Wellington.
Like most other regions, the lifting of buyer demand
and prices growth in the Bay of Plenty over 2014 –
2015 did not bring forth a commensurate rise in willing
sellers to the market. Are listings now improving, and Listings are in short supply in the Bay of Plenty and
can the many people recent behaviour suggest will be there is no sign of the situation easing for buyers.
moving out of Auckland to the Bay look forward to a
rising number of properties to choose from? No. Prices
Since 1993 average house prices in the Bay of Plenty
In October 555 new listings were received which was region have risen by 445%. This is exactly the same as
8% fewer than in October 2019. Contrast this decline the increase in Waikato and little different to the all-NZ
with Auckland’s 32% rise, or the Waikato’s 13% gain. In rise of 464%.
fact, excluding Auckland the average change between
Octobers has been a fall of just 4%. The average annual increase over this period of time
has been 6.8% per annum which is above average
inflation of exactly 2% a year and wages growth of
approximately 3.7% a year.
The standard graph included in each regional section
this month shows the ratio of average house prices in
the Bay of Plenty to the NZ average from 1993 to
October this year. Readers might wonder why the
trend line run through the graph for Bay of Plenty is
sloping downward when on average since 1993 the
annual increase in prices has been exactly the same as
the NZ average.
REGIONAL PROPERTY INSIGHTS – Issue November 2020 Page 11Regional Property Insights
This situation arises because the trend line captures
where things seem to be heading. If the graph stopped
in 2011 the trend line would be flat according to a
quick visual inspection. But the extra data from 2011 to
2015 has revealed a tendency for price gains to begin
being less than for all the country. Again, interpretation
of this particular graph needs to be undertaken with
care and all it can do is broadly indicate if a region
might be looking a bit stretched in one direction or not
pricewise.
One possible explanation for this difference for now
may be the structural change in Waikato involving the
upgrading of the highway network reducing travel
times between major centres and between the region
and Auckland City. Such transport network changes can
produce a tendency for people to favour the newly
accessible locations over alternatives – until those new
roads become potentially as busy as the old ones,
and/or similar upgrades occur in another nearby
region.
As was the case for Waikato, the extent to which house This dynamic is something of high relevance to the
price appreciation in the Bay of Plenty was above the Kapiti Coast and Horowhenua districts north of
national average was strongest over 2016. But since Wellington in relation to the continuing expansion of
then this out-performance has been fading and most the expressway system and anticipated opening of the
recently price gains have been less than the national Transmission Gully Motorway late in 2021.
average.
Unlike Waikato where we might attribute some of this
normalisation of price rises to a surge in house supply,
there has not been an above average proportion of
sales in the region accounted for by new dwellings
recently.
REGIONAL PROPERTY INSIGHTS – Issue November 2020 Page 12Regional Property Insights
Gisborne of 62 dwellings represented a rise of 9% from a year
earlier. There is growth, but it is small.
Gisborne is a small region of just 51,000 people
accounting for 1% of NZ’s population compared with
3.8% for Northland, 34% for Auckland, 9.8% Waikato,
and 6.6% Bay of Plenty. But it often attracts attention
in the general discussion regarding housing markets in
New Zealand. This is partly because average prices are
low and therefore considered a lot more affordable
than for other regions.
An issue for Gisborne is that construction growth is
relatively weak and as the graph in the Auckland
section above shows, of all regions Gisborne has the
lowest ratio of dwelling consents to dwelling sales. In
fact, Gisborne has the lowest ratio of consents per
10,000 population of all regions.
But there is also occasional discussion of the attraction
of the region to many returning Kiwis. In that context,
should long-term reaction to the Covid-19 global
pandemic bring a structural lift in returning Kiwi
numbers, Gisborne may achieve some long overdue
population growth.
Focussing on property listings, stock totalled just 76 at
the end of October, down 13 or 15% from a year
earlier. Compared with October 2010 listings are down
by 80%.
Why? Probably because since 1996, while the total NZ
population has grown by 36%, Gisborne’s population
has only risen by 7.4%. Only the West Coast (-2.4%)
and Southland (+3.6%) are lower.
Is there any indication that buyers might soon have
more listings to choose from? New listings in October
REGIONAL PROPERTY INSIGHTS – Issue November 2020 Page 13Regional Property Insights
At the end of October Gisborne had 22 weeks’ worth of Most recently prices have been increasing at an
stock on hand, well above Hawkes Bay’s 8 weeks and especially rapid rate compared with all New Zealand,
up from 8 weeks a year earlier. But we have to be best seen in this next graph.
careful with smaller locations because measures such
as this where stocks are mixed with flows can yield
some high volatility.
Gisborne has been on a relative price growth tear since
2017 and there is as yet no sign of this out-
performance ending.
Prices
Since 1993 average house prices in Gisborne have risen
by 389% compared with a 464% gain nationwide and
gains in Hawkes Bay of 393% and Bay of Plenty 445%.
The average rise in prices has been 6.4% versus 6.8%
nationwide or 6.3% excluding Auckland.
The following graph showing the ratio of Gisborne’s
House Price Index to NZ reveals something significant
beyond the mild downward trend in the ratio. Relative
prices move over an exceptionally wide range.
Gisborne undergoes extended periods when prices
substantially under-perform the NZ average, and then
substantially out-perform.
REGIONAL PROPERTY INSIGHTS – Issue November 2020 Page 14Regional Property Insights
Hawkes Bay If this is the case, then the continuing fall in interest
rates this year suggests buyers cannot be optimistic
Hawkes Bay accounts for 3.5% of New Zealand’s
that old levels of new listings and stock numbers will
population (about 10% the size of Auckland), and has
ever return to past levels.
seen its population grow 22% since 1996 versus 36%
for all NZ. As has been the case for all regions, the level But there is one factor relevant to Hawkes Bay which
of stock on the market available for purchase has fallen may be moving things more in favour of buyers seeking
sharply over the past decade, with the bulk of the listings. In the Auckland section above, we noted the
decline seen from 2014-16 when sales picked up after high ratio of consents issued for new dwellings to be
some years of low activity. built with sales for the past year. Sales have fallen 5%
in Hawkes Bay this past year. But consent issuance is
running 104% above the ten-year average which
exceeds even Auckland’s 82% above average consents
surge.
For property buyers in Hawkes Bay, time spent looking
at properties yet to be built may prove useful.
Measured as weeks’ worth of sales, stocks sat at a very
low 8 weeks in October, up from 7 weeks in October
last year.
In October there were 255 new listings received which
was only a slight decline from 268 received in October
2019. There is no indication that listings are going to
return to old levels before the surge in sales by 31%
over 2015.
Prices
Average house prices in the Hawkes Bay region have
risen by 393% since 1993 compared with a 464% gain
nationwide. The average increase per year has been
6.4% compared with 6.8% for all New Zealand but 6.3%
excluding Auckland.
But it is interesting how this 31% surge of 2015 soaked
up listings whereas the 28% surge of 2009 did not. This
comparison applies across all regions and perhaps we
can explain the unique failure of the mid-2010s sales
surge to produce higher listings by the structural
change in interest rates – downward to record lows.
REGIONAL PROPERTY INSIGHTS – Issue November 2020 Page 15Regional Property Insights
FOMO (fear of missing out) has recently been on
extreme display (again) nationwide. The REINZ & Tony
Alexander Real Estate Survey has been conducted since
June this year and includes a question asking real
estate agents whether they are observing FOMO in
their location. For almost all months since June the
extent of reported FOMO in Hawkes Bay has been
slightly above the national average, though not by
much.
Here are two quick graphs to finish this section. Will
reimposition of 70% Loan to Value Ratio regulations
The pace of price gains relative to the rest of New
(LVRs) s have much impact in Hawkes Bay? The first
Zealand has been especially strong since 2016 and the
graph below shows monthly house prices changes for
above trend graph shows only the slightest hint that
all NZ excluding Auckland covering the period from July
this outperformance may be weakening. The easing of
2016 when a 40% minimum deposit requirement was
this out-performance is better seen in the following
imposed for all NZ. Note the slowing. The second
graph explicitly comparing the region’s annual price
shows monthly price changes for just Hawkes Bay.
change with the NZ average.
Note the far more limited impact. From this one might
draw implications of the impact which current
reinstatement of 30% investor minimum deposits will
have for the region – not much it seems.
But the actual pace of price rise measured as a three-
month average from a year earlier remains high at
around 15%.
Hawkes Bay Impact of July 2016 60% LVR
7.0
Rolling three month % changes in
Hawkes Bay House Price Index
6.0
5.0
Source: REINZ
4.0
3.0
2.0
1.0
0.0
16 17 18
REGIONAL PROPERTY INSIGHTS – Issue November 2020 Page 16Regional Property Insights
Manawatu-Wanganui
At the end of October there were 476 properties listed
for sale in the Manawatu-Wanganui region. This was a
decline of 242 or 34% from a year ago which exceeds
the average NZ decline excluding Auckland of 28%.
Reflecting the stock decline, weeks’ worth of sales in
October was the equal lowest in the country at just six
weeks, down from 8 weeks a year ago but 48 weeks in
October 2010. That is an 87% decline.
Listings fell away sharply from 2015 into 2017 and have
broadly continued to decline whereas in many other
regions there was some pausing in this long-term fall.
Does the decline reflect a lack of new listings? Not
really as new listings received in recent months have
been similar to numbers received a year earlier. It’s
more a matter of listings being snapped up relatively
quickly.
Prices
Since 1993 average house prices in the Manawatu-
Wanganui region have risen by 326%, somewhat less
than the nationwide average price rise of 464%. In fact,
only Marlborough with a 324% rise and Canterbury at
288% have recorded smaller increases. The average
price rise per year has been 5.7% versus 6.8% for all of
New Zealand.
The number of days taken to sell a dwelling in
Manawatu-Wanganui has been running 13 days faster
than average in recent months versus just three days
faster than average for the overall country. Only
Taranaki at 17 days below average and West Coast at
48 days have displayed stronger soaking up of stock
performances recently.
REGIONAL PROPERTY INSIGHTS – Issue November 2020 Page 17Regional Property Insights
The trend in prices relative to all of NZ is downward, Apart from an unusual spike in August, agents in the
but since 2017 prices have risen faster than the NZ region traditionally note that they are seeing fewer
average to reach a position about as far above the rather than more enquiries to purchase property from
average ratio as was achieved in the 2004-2010 period overseas.
of strong growth.
Perhaps the reaching of this extremity helps explain
why the superior price rise performance of the
Manawatu-Wanganui region has ended relatively
suddenly, as seen in the following graph.
This reading has in fact averaged -27% since June which
is the lowest for all regions except Otago excluding
Queenstown Lakes, and well below the NZ average of a
net 1% positive.
One particular issue with the Manawatu-Wanganui
The actual pace of price growth is shown in this next region is that it has two large population centres in
graph which reveals that prices have still risen about Wanganui and Palmerston North. Their characteristics
10% from a year ago. are quite different with the latter location containing
Massey University, military bases, and acting as a
Manawatu-Wanganui Price Growth
25.0 substantial distribution centre for the lower and central
% 3 months vs.
a year earlier North Island.
20.0
15.0
But analysing each location separately would be a task
for which we don’t have sufficient resources.
10.0
5.0
0.0
Source:REINZ
-5.0
15 16 17 18 19 2020
One characteristic of the Manawatu-Wanganui region
is that it tends not to attract all that many overseas
buyers when compared with other regions. We can tell
this by looking at results from the monthly REINZ &
Tony Alexander Real Estate Survey conducted since
June.
REGIONAL PROPERTY INSIGHTS – Issue November 2020 Page 18Regional Property Insights
Taranaki
Stock numbers in Taranaki at the end of October stood
262 or 48% lower than a year earlier at just 281
properties. This is a 73% decline from ten years ago
which is in line with the non-Auckland ten-year decline.
But the 48% annual fall is far greater than the non-
Auckland 28%. So, we can reasonably safely say that
Taranaki has experienced a period over the past year of
catch-up soaking up of stock on the market.
The downward trend in listings availability shown in
the first graph is seen also is this next one measuring
the weeks’ worth of sales accounted for by stock levels.
At just ten weeks this measure is just below the 11
weeks nationwide, but the trend remains down.
In fact, one interesting characteristic of the region is
the upward trend in listing stocks from 2007 to 2012
which is matched perhaps only by Southland and
barely approached by a handful of other regions. In
other words, the region seemed quite out of favour
heading into and following the GFC, but more recently
has attracted considerable interest.
Prices
Are many new listings coming forward? Yes. New Since 1993 average house prices in the Taranaki region
listing numbers received in October were 13% ahead of have increased by 350% which is in the middle of the
a year earlier whereas the non-Auckland month on three mid-North Island regional increases. The Hawkes
year ago change was a decline of 4%. Bay rise has been 393% and Manawatu-Wanganui
326%. The average increase each year has been 6%
If we think in terms of the strip of three regions which is below the nationwide rise or 6.8% and the rise
stretching across the middle of the North Island – excluding Auckland of 6.3% - but not by all that much in
Taranaki, Manawatu-Wanganui, and Hawkes Bay – the latter case.
Taranaki is unique in displaying good listings growth.
For each region in New Zealand for this first issue of
Regional Property Insights we are including a graph
showing the ratio of the region’s REINZ House Price
Index to the national average from 1993 using 12-
month averages. There are only three locations where
the ratio is currently below trend. They are Auckland
and Canterbury (basically the country’s two biggest
cities) and Taranaki.
REGIONAL PROPERTY INSIGHTS – Issue November 2020 Page 19Regional Property Insights
We can see this in the following graph. There is a There is also the same factor along with water
certain regularity to Taranaki’s relative house price protection standards bringing extra costs for the dairy
cycle. Is this seen in the actual house price inflation sector which dominates agricultural production in the
cycle? The next graph following gives us some insight. region.
Another factor might be the region’s inferior rate of
population growth compared with New Zealand
overall. But population growth is a poor predictor of
house price growth because when population growth is
strong, so too tends to be house supply growth.
Not so much really. There was a substantial surge in
prices from 2002 to 2007 following a period when
many of the regions were struggling to regain their feet
and their new equilibriums following the negative
impact of many reforms undertake over the period
from 1984-92.
In that regard, house construction is rising in Taranaki,
Since the GFC and the brief dip again after the false but the number of consents issued recently is 35%
restart of 2010 there has been an oscillating upward above the ten-year average compared with a 52% gain
trend in the pace of house price appreciation in for all New Zealand and very strong consent issuance in
Taranaki. Manawatu-Wanganui and Hawkes Bay.
Given the below trend position of prices currently in House construction is certainly picking up in the
Taranaki, it is more an issue of perhaps identifying Taranaki region. But the relatively slow pace of this
reasons why further relative price gains would not be growth at a time when demand for housing is
made rather than accruing comfortably. One option for particularly strong may be a factor which could take
caution might be the movement away from the oil and average prices back above their trend relative to the
gas sector worldwide as part of the drive to reduce country as a whole.
greenhouse gas emissions.
REGIONAL PROPERTY INSIGHTS – Issue November 2020 Page 20Regional Property Insights
Wellington
At the end of October in 2010 there were 2,979
Wellington properties listed for sale with
realestate.co.nz. In October this year the number was
74% lower at just 762. This was a decline of 221 or 23%
from a year ago which is a decline slightly better than
the 28% nationwide fall if we exclude Auckland.
Wellington at the end of October had stocks equal to
only 6 weeks’ worth of sales. This was the lowest in the
country, and so too was the six weeks for October
2019. Wellington’s market using this measure has been
exceptionally tight since the start of 2016, reflecting
the falling off of listings in this section’s first graph.
There is no longer a downward trend – just sustained
high difficulties for people searching for property.
As with most other regions around New Zealand,
Wellington saw stock availability fall substantially
between 2015 and 2016 – though perhaps the way in
which the decline was confined to only just over 12
months was quite unique. Perhaps one factor driving
this special dynamic was the temporary 30% minimum
deposit requirement placed on investor buyers in
Auckland from late-2016. Investors went hunting in
Wellington, perhaps bypassing Christchurch because of
uncertainty about the lingering effects of the 2011
earthquake.
The graph above shows that there is only a slow
decline in listings now underway, and no pattern is yet
clear regarding the flow of new listings coming
through.
REGIONAL PROPERTY INSIGHTS – Issue November 2020 Page 21Regional Property Insights
Prices
Since 1993 average house prices in the Wellington
region have risen by 467% which is essentially equal to
the NZ-wide rise of 464% though well above the 392%
rise if Auckland is excluded. The rise has averaged 6.7%
per annum.
As a matter of interest, and as a primer for one of the
many aspects of regional house price movements we
will examine over coming months, here are two graphs.
Both show annual average house price changes. The
first compares Wellington in green with Auckland in
blue. The second compares Wellington with Waikato.
Wellington, Waikato (Bay of Plenty also) tend to move
Since 2016, as has been the case for most regions of together.
the country outside of Auckland, Wellington house
prices have been rising at an above average rate. This
followed a period when prices changed by very little
while rising elsewhere. Over the period from late-2009
through to mid-2013 there was no growth in
Wellington house prices, and as shown above, listings
were plentiful. But sales surged from the start of 2015,
listings got soaked up, and a strong prices response
ensued.
Average house prices in Wellington have risen by 83%
since the start of 2016. Only Gisborne at 134%, Hawkes
Bay at 105%, and Manawatu-Wanganui at 95% have
recorded stronger rises over this four-and-a-half-year
period.
REGIONAL PROPERTY INSIGHTS – Issue November 2020 Page 22Regional Property Insights
Nelson & Tasman
Nelson and Tasman are two separate regions.
However, the bulk of their populations live right next to
each other and while some statistics are available for
each region, others cover the two together. Some also
include Marlborough, however we will make best
efforts possible to keep Marlborough separate given
the distance of Blenheim from Nelson.
Therefore, for now we will cover the Nelson/Tasman
regions as one, recognising for the likes of people in
Puponga there is as much relevance from them But the number of weeks’ worth of sales stood at just 7
analysed jointly as there is separately! at the end of October, third equal lowest for all
regions. The trend for this measure does appear to be
At the end of October, the stock of listings for
down. Therefore, for fresh buyers, conditions are tough
Nelson/Tasman stood at 290. This was a decrease of
and could get even tougher.
107 or 27% from a year earlier which is equal to the
nationwide decline with Auckland excluded. As for
most other regions, the surge in sales and price activity
from 2014-15 was not met by a lift in listings and stock
levels have fallen away to newer, much lower, average
levels.
One of the interesting aspects of the Tasman part of
this area is that the rise in the median population age
between the censuses of 2006 and 2018 is the greatest
for all regions. Tasman is an attractive retirement
destination and because of that, the country’s aging
population and the spur of Covid-19 making people
Is a structural decline in stock availability still
rethink their lives, is likely to keep internal migration to
underway? New listings for Nelson/Tasman in October
the region strong in coming years.
were 174, virtually the same as 171 in October last
year. There is no apparent trend in the flow of new
listings.
REGIONAL PROPERTY INSIGHTS – Issue November 2020 Page 23Regional Property Insights
have this following graph showing annual house price
changes.
Prices
Both Nelson City and Tasman Region display the same
price trends versus the national average price – as seen
in these following two graphs. Will this close relationship continue? Most likely yes
given the physical proximity of the regions’ population
centres. Tasman has faster population growth, but
Nelson is constrained by lack of developable land –
though long-running plans continue to make more
space available.
But perhaps we can get a feel for how on the ground
there are different perceptions of the locals regarding
Nelson as compared with Tasman at the moment. The
monthly Tony’s View Spending Plans Survey for
November shows that whereas in Tasman a net 24% of
respondents say they intend spending more over the
next 3-6 months, in Nelson this is just 10%. There are
differences also for intentions of investing in property
and purchasing a dwelling to live in.
Since 1993 Tasman house prices have risen on average
by 379% and Nelson’s 359%. The average annual
changes have been 6.4% and 6.1% respectively versus
6.8% for all New Zealand and 6.3% excluding Auckland. If these different attitudes on the ground produce
divergent house price movements in the near future,
Just to fully show the fact that the two regions have
history would suggest the differences will reverse
housing markets which move very closely together we
relatively quickly.
REGIONAL PROPERTY INSIGHTS – Issue November 2020 Page 24Regional Property Insights
Marlborough
In Marlborough at the end of October, the number of
properties listed for sale sat at 163. This was down 42%
from 280 in October 2019, and 83% from 944 in
October 2010. The ten-year decline is the greatest for
all regions we cover here. By the looks of our long-term
graph, the decline is continuing.
Marlborough’s population is interesting in that it has
the third highest median age of all regions at 45.2
years, behind West Coast at 46.2 years and Tasman at
45.5 years.
The number of new listings received in October was 96,
which was actually better than the 80 of October last
year. But one could not say that the trend in new
listings is in fact upward.
It also has the second lowest proportion of housing
stock which is rented – bettered only by Tasman.
Measured in terms of the weeks’ worth of sales the
level of stock sits at 11 which is equal to the
nationwide average.
REGIONAL PROPERTY INSIGHTS – Issue November 2020 Page 25Regional Property Insights
The region is seen (along with Nelson/Tasman) as a Most of these regional graphs show an upturn in prices
desirable retirement destination for many people relative to the national average starting in 2016. This
bypassing Queenstown Lakes, and long-term aging of was not the case for Marlborough. The price catch-up
the population is likely to see continued inflows. In started about one year later in 2017. The Kaikoura
another issue of Regional Property Insights, we will earthquake which heavily disrupted tourism in the
discuss internal migration and population projections Marlborough region happened in November 2016 so
from Statistics NZ. Until then, this following graph doesn’t account for this lag.
shows the net population gain which Marlborough
received from other regions between the censuses of Regardless, relative prices have returned to roughly
2013 and 2018. calculated trend levels and it is not clear yet if a period
of years above trend now beckons.
Note that the region tends to lose people to Tasman,
Nelson, and Wellington, but gain more than lost from
Auckland and Canterbury.
The most recent surge in Marlborough’s rate of house
price inflation looks graphically impressive. But this
might simply be part of the generalised unsustainable
Prices house price surge associated with loose monetary
Average house prices in the Marlborough region have conditions engineered by the Reserve Bank.
increased by 324% since 1993. This is virtually the same
as Manawatu-Wanganui and above only Canterbury at
288%. The average annual change has been 5.8%
compared with 6.8% nationwide and 6.3% excluding
Auckland.
REGIONAL PROPERTY INSIGHTS – Issue November 2020 Page 26Regional Property Insights
West Coast
Most North Islanders will not be familiar with the West
Coast. But it is one of the most beautiful parts of New
Zealand and the locals have had to switch a lot of their
business focus over the past two decades away from
extractive industries such as coal mining and logging
toward tourism. In that regard, the closure of the
borders to foreigners has brought a substantial
economic hit. But has this caused widespread
weakness in the housing markets across the lengthy
Coast’s three territorial authorities? No.
In terms of the weeks’ worth of sales on the market,
The quantity of properties available for purchase on apart from noting the January spike, we can’t say that a
the West Coast has been near straight-lining downward trend is in place up or down. That in itself is interesting
since 2015. Stock stood at 245 at the end of October because newspaper headlines over the past three
from 338 a year before and 967 in October 2010. The months have been along the lines of bulk people
percentage declines are 28% and 75% respectively. flocking to the Coast, buying properties, and pushing
Both movements are around the nationwide changes. prices skyward. The price truth is somewhat different
as we examine below.
Is this downward march in listing numbers easing? We
can’t answer yes necessarily to that question because Prices
the data are quite volatile for this small region of On average since 1993 house prices on the West Coast
32,400 people which accounts for 0.6% of the country’s have risen by 339%. This is below the national average
population. The West Coast population has in fact rise of 464% and the rise of 392% if Auckland is
shrunk 2.8% between 1996 and 2018 whereas growth excluded. But it is above Canterbury’s rise of 288%.
for the country has been 36%.
The average price change per annum since 1993 has
been 6% per annum versus 6.8% across all the country
and 6.3% excluding Auckland. Canterbury was ahead
on average by 5.4%.
REGIONAL PROPERTY INSIGHTS – Issue November 2020 Page 27Regional Property Insights
The trend in West Coast prices relative to the national As a proportion of 1996 population (earliest regional
average is mildly downward. Ignoring for now the population data to hand), the number of new dwelling
FOMO-driven (fear of missing out) price surge across all consents issued on the West Coast since 1993 is
regions since June, it looks like this upward leg of the amongst the lowest in the country.
Coast’s relative price cycle bears little resemblance to
that of 2003-04 – a truly unusual period of price
growth.
We will look at consent issuance more closely in
coming months to see if house price growth and some
extra attention paid to the Coast in recent months
This might surprise some people when we consider the elicits any sort of superior house construction growth.
2.8% population shrinkage since 1996 versus 96% Gauging whether population growth is accelerating will
growth nationwide and 35% growth in Canterbury. be much more difficult to do and as the graph at the
How can prices rise without population growth? bottom of the other column on this page shows,
Because growth in housing supply is similarly relatively population growth still appears to be very weak on the
weak. West Coast.
Note that the West Coast accounts for 0.6% of New
Zealand’s GDP but receives some 1.3% of the spending
undertaken in NZ by foreign tourists. Closure of the
borders is having a disproportionately large negative
impact – but there is scope for some good offset from
domestic tourism.
REGIONAL PROPERTY INSIGHTS – Issue November 2020 Page 28Regional Property Insights
Canterbury In 2012, when nationwide consent numbers were
running 25% below their ten-year average, they were
When it comes to analysing the Canterbury economy
15% above in Canterbury. Over 2013 these numbers
and residential real estate market, there is something
were -3% and +56. For 2014 14% and 85%, and for
important which needs to be recognised. The
2015 55% and 30%. The relationship reverses from
devastating earthquake of early-2011 has disturbed
2016.
what might otherwise be “normal” patterns of activity
and the housing cycle in particular. For that reason, we
analysts tend to not so much shy away from the city
and region, as hedge our bets and avoid strong
statements.
With that caveat in mind, let’s start our ongoing
analysis of the Canterbury region housing market with
a look at the availability of property listings. Stock
stood at 2,360 properties at the end of October, down
26% from 3,207 a year ago, and 54% from 5,158 ten
years back. That 54% decline is the smallest of all
regions we cover here, except for Auckland at -45%.
This is interesting. Stock declines have been least in our Are many new listings coming forward? They appear to
two biggest cities accounting together for 47% of NZ’s be arriving in numbers little changed from a year ago
population. recently.
Canterbury stock levels have not shown the strong But there does appear to be something interesting
decline from 2014 to 2016 and after which most other happening when we look at the weeks’ worth of stock
regions have displayed. Only recently, since early-2019 sitting on the market. The ten-week number for
has stock started to be soaked up to any interesting October was the lowest for Canterbury since data
degree. started in 2007.
Why might this be? Uncertainty following the
earthquake of 2011, rebuilding of the city centre and
the challenges inherent in re-establishing a beating
heart for the city. Undoubtedly also there has been in
play the surge in house construction (affordable
housing at that) following rule changes over-riding the
Resource Management Act.
REGIONAL PROPERTY INSIGHTS – Issue November 2020 Page 29Regional Property Insights
rise in demand will elicit a rise in supply. That supply
response has been absent in New Zealand – hence it is
incorrect to say that too much money has gone into
the housing market. Not enough has gone into house
construction and any hefty restrictions on lending
money on existing housing would have no positive
impact on house construction.
Canterbury shows us that if there is land readily
available (flat), and all stops and bureaucratic
impediments to development and timely construction
Which brings us below to the large question regarding are pulled out, price growth can be contained.
the Canterbury housing market. When will prices catch
up to the rest of the country? The following graph shows annual house price inflation
for Canterbury in green, and all New Zealand in blue.
Prices To the right-hand side, from 2015, as house supply in
On average since 1993 house prices in the Canterbury Canterbury surges a clear divergence in price
region have risen by only 288% compared with 464% movement occurs. Note, the population loss to
nationwide or 392% excluding Auckland. The average Canterbury following the 2011 earthquake was
gain each year has been 5.4% versus 6.8% for all New immediate and its effects well over before 2015.
Zealand, 6.3% excluding Auckland, and 7.7% for
Auckland.
Can we yet deliver an answer to probably the most
important question of all when it comes to regional
Prices have been tracking at below trend levels since disparities in house price movements around New
2016 with gains less than the national average pace Zealand? When will Canterbury catch up? We are not
from 2014. That 2014 coincides with the surge in house there yet. The thing to watch is supply, and in
construction shown in the consents graph on the particular the pipeline of developable land which
previous page. This then leads us to the key point anecdotes on the ground suggest is drying up.
which all informed commentators have been making
the past 1-2 decades with regard to the situation of
high house prices in New Zealand. Supply is the key
issue, not demand.
There is no particular evidence suggesting we Kiwis
have any unusual fascination with owning houses in
preference to other assets. And in any other market a
REGIONAL PROPERTY INSIGHTS – Issue November 2020 Page 30Regional Property Insights
Dunedin City
For the Otago region we will do our best to split
analysis and data into Dunedin City and the
Queenstown Lakes District. This reflects the unique
characteristics of Queenstown requiring individual
treatment where possible.
At the end of October, the number of properties listed
for sale in Otago outside Queenstown stood at 417, a
decline of only 19 or 4.4% from a year earlier. Only
Hawkes Bay at 1.7% and Central Otago at 2.2% had
smaller month on year ago declines. Just to illustrate somewhat the difference between
Otago’s two big centres of Dunedin (2.6% NZ
population) and Queenstown (0.9%), consider
population growth rates. Since 1996 Dunedin City’s
population has grown by 11% whereas Queenstown’s
has grown by 220%. Since 1996 consents for the
construction of 8,000 dwellings have been issued in
Dunedin versus 15,300 in Queenstown.
This situation is partly caused by a 21% rise in new
listings received during October compared with
October last year. But this rise could easily go the other
way based on simply month to month volatility in this
measure shown in the next graph.
Prices
Prices in Dunedin have been rising at a pace above the
national average since 2016, though most recently this
situation seems to have come to an end.
To a large extent the relatively small decline in listings
reflects weaker growth in sales in Dunedin than in all
other parts of the country recently. In fact, Dunedin
city sales in the three months to October were
uniquely down by 4% from a year earlier.
REGIONAL PROPERTY INSIGHTS – Issue November 2020 Page 31You can also read


