Official House Price Statistics Explained - 4 April 2013
←
→
Page content transcription
If your browser does not render page correctly, please read the page content below
Official House Price Statistics Explained

                                   4 April 2013
Official House Price Statistics Explained
Contents
Summary.......................................................................................................................................... 4
Acknowledgements ......................................................................................................................... 4
1. Introduction ................................................................................................................................. 5
1.1 The housing market ............................................................................................................... 5
1.2 House price statistics ............................................................................................................. 7
2. Overview of methods .................................................................................................................. 9
2.1 Peculiarities of house prices .................................................................................................. 9
2.2 Mix‐adjustment with a stratification matrix ......................................................................... 9
2.3 Hedonic regression .............................................................................................................. 10
2.4 Repeat sales method ........................................................................................................... 11
2.5 Sale Price Appraisal Ratio .................................................................................................... 13
2.6 International use of methods .............................................................................................. 14
3. ONS HPI methodology ............................................................................................................... 15
3.1 Aim of the index .................................................................................................................. 15
3.2 Data used in the estimation of the average house price .................................................... 15
3.3 Measuring the average house price .................................................................................... 16
3.3.1 Determining the average house price for a given set of characteristics ...................... 16
3.3.2 Observation weights..................................................................................................... 20
3.4 Calculation of the House Price index ................................................................................... 20
3.4.1 The Average House Price .............................................................................................. 20
3.4.2 The House Price Index .................................................................................................. 22
3.4.3 Chain Linking................................................................................................................. 22
3.4.4 Twelve Month Percentage Change .............................................................................. 23
3.5 ONS HPI Publication ............................................................................................................ 24
4. Differences between other official statistics and ONS HPI ....................................................... 25
4.1 Northern Ireland Residential Property Price Index (NI RPPI) .............................................. 25
4.2 Land Registry House Price Index (LR HPI) ............................................................................ 27
4.3 Registers of Scotland ........................................................................................................... 29
5. Conclusions ................................................................................................................................ 32
5.1 Future developments .......................................................................................................... 33
Bibliography................................................................................................................................... 34
Office for National Statistics | 2Official House Price Statistics Explained
Annex A – Model Definition .......................................................................................................... 37
Annex B – Outlier Identification .................................................................................................... 38
Annex C – Observation Weights .................................................................................................... 38
Annex D – Average House Price Calculation ................................................................................. 39
Annex E – HPI Calculation .............................................................................................................. 39
Annex F – Chain Linking ................................................................................................................. 39
Office for National Statistics | 3Official House Price Statistics Explained
Official house price statistics explained
Joni Karanka1, Robert O’Neill2, Natalie Weaden2, Ria Sanderson2 & Christopher Jenkins1
Summary
The housing market has a large impact on the economy and on society as a whole. However,
measuring the overall change in property prices is inherently difficult. This article reviews the
need for accurate house price statistics, the different methods used to calculate a house price
index, and the indices and official statistics available in the UK. It also explains the calculation of
the Office for National Statistics House Price Index (ONS HPI) and its relation to other official
house price statistics. The article describes how differences in data sources, scope and methods
lead to differences in reported house price levels, yet house price movements are similar across
official sources.
Chapter 1 introduces the UK housing market and the difficulties faced when producing
house price statistics.
Chapter 2 provides an overview of the different methods used to estimate house prices
and where these are used.
Chapter 3 provides a detailed explanation of the methodology of the ONS HPI.
Chapter 4 compares the methods of the different official house price statistics. The
chapter also compares their reported house price levels and house price movements.
Chapter 5 draws conclusions and suggests future directions for the ONS HPI.
Acknowledgements
The authors would like to thank the Land Registry; Land and Property Services, Northern Ireland,
and Registers of Scotland for their comments.
1
Prices Division, Office for National Statistics
2
Survey Methodology Division, Office for National Statistics
Office for National Statistics | 4Official House Price Statistics Explained
1. Introduction
1.1 The housing market
The aim of a house price index is to provide information about house price inflation over time.
They are an important set of statistics for understanding the housing market. In the UK the
housing market is a large component of the economy, comprising 27.4 million properties (see
DCLG dwelling stock live tables). According to the 2011 Census in England and Wales 63.5% of
households own their property either outright or with an outstanding mortgage or loan (a UK
estimate will be published later in 2013). This rate of home ownership is slightly below the EU
average of 70.8% (Eurostat Housing Statistics, 2010). The rest of households live in
accommodation that is either rented from a private landlord or from a social landlord such as a
local authority or housing association (Figure 1.1).
England and Wales household tenure
2.2
17.6
Home owners
Private renters
16.7 Social renters
63.5 Other
Figure 1.1. Household tenure for England and Wales. Source: England and Wales Census 2011.
For those who choose to buy, a property is most often the largest investment made in a lifetime.
Few buyers are able to buy property outright so most rely on large loans in the form of
mortgages. The size of this investment is reflected in the fact that, in 2011, the average
mortgage was 3 times the buyers’ yearly joint income (see table 30 of the House Price Index).
Demand for mortgages has built up a large market of lenders. As of the third quarter of 2012,
the total value of outstanding mortgages is estimated at £1265 billion by the ONS UK Economic
Accounts. To put this number into perspective, the national debt of the UK at the end of 2012
amounted to £1111 billion (see public sector net debt in ONS UK Public Sector Accounts).
Office for National Statistics | 5Official House Price Statistics Explained
Figure 1.2. UK yearly volume of property transactions on the left hand side (HMRC) and percentage
change in house prices on the right hand side (ONS HPI).
As the housing market is linked to income, wealth and availability of lending, it is also very
sensitive to the overall economic climate. For example, the 2008 credit crisis had significant
repercussions for the housing market (figure 1.2). Large annual house price inflation of between
5.6% and 17.0% seen on every year between 1997 and 2007 reversed to a decline of 7.6% in
2009. For the last two years house price inflation has been relatively stable (see ONS House
Price Index). The number of property sales in the UK has almost halved from the previous
‘boom’ years, from a peak of 1.67 million in 2006 to 0.86 million in 2009 (see HMRC: Property
transactions in the United Kingdom).
The importance of housing is reflected in a considerable number of government policies. Some
examples of policies developed since 2009 include:
‐ Stamp duty holiday. Stamp Duty Land Tax (SDLT) is a tax payable on the purchase or
transfer of land or property. The holiday ended in April 2012 and was aimed at
encouraging the first time buyer market by not charging SDLT for first time buyers when
they purchased properties under £250,000.
‐ Funding for Lending Scheme. Allows lenders to borrow from the Bank of England at
below standard rates as long as this money is lent to businesses and individuals. Its aim
is to encourage lenders, including mortgage lenders, to lend more and at lower rates.
‐ FirstBuy scheme for new properties (England only). The Homes & Communities Agency
and the house builder provide equity loan funding of up to 20% of the property price,
with the buyer raising the remaining 80% with a mortgage and a deposit. It is aimed at
Office for National Statistics | 6Official House Price Statistics Explained
first time buyers, providing them access to a mortgage when the deposit alone would
not make one available.
‐ Support for Mortgage Interest. The government pays lenders the interest of up to
£200,000 of a mortgage to people on certain income‐related benefits. The main aim of
this scheme is to reduce repossessions.
‐ In the March 2013 Budget a new scheme called Help to Buy was announced. The
scheme aims to provide buyers access to mortgage lending by securing part of their
deposit.
1.2 House price statistics
A house price index (HPI) is a series that tracks the changes in the price of property relative to
the price it had at a reference period in time. Changes in the series represent increases and
decreases in house prices. The ONS HPI provides an estimate of the price of current property
relative to its price in February 2002. For example the August 2011 UK HPI index was 176, which
means that house prices were 76% higher than in February 2002. Usually house price indices are
accompanied by other important information such as average property prices, and breakdowns
by region or type of property.
The production of house price statistics is relevant for a large number of purposes. The
importance of the indices is reflected in the development of a European regulation3, introduced
in February 2013, which is the first stage in the introduction of owner occupiers’ housing costs
into the Harmonised Index of Consumer Prices. The regulation identifies house price indices as
“important indicators in their own right” reflecting the consequences for an economy of
unstable or unsustainable house price development. In the national context users include
central Government which uses them as an economic indicator, mortgage lenders who use
them to set their interest rates, and individual households which make decisions on buying and
selling property. An analysis of the main users of these statistics can be found in the National
Statistician’s Review of Official Housing Market Statistics.
Although the availability of accurate and timely house price statistics is desirable, there are a
number of obstacles to their production. These are mainly due to the nature of housing
compared with other goods:
‐ Properties are unique. Most price indices can collect the price of the same items over
several periods. For example, the price of a pint of branded milk can be collected every
month. However, this is not the case for properties. Each house is different, be it due to
its size and features, or by its location. Furthermore, properties are traded less
frequently than other items, making successive pricings very unlikely.
‐ Sales volumes, prices, and the composition of the sold stock vary between periods.
House price indices should reflect the change in price of comparable properties. This is
3
Commission Regulation (EU) No 93/2013
Office for National Statistics | 7Official House Price Statistics Explained
not straightforward when the types of properties and the volumes sold change between
periods.
‐ Multiple methods are available for the estimation of average house prices. Average
house prices can be estimated with a large number of different sources and methods.
Each choice will produce slightly different results to the others. Four different methods
are discussed in the next chapter of this article.
‐ Some house price statistics might not be relevant to the individual user. As noted above
published average house prices represent the price of an ‘average property’, which
might not reflect the exact features of a property that a prospective seller owns. Also,
house price indices tend to be constructed to calculate the price of traded property.
Therefore, they cannot be used to estimate the value of untraded property (such as the
entire housing stock of the UK) unless the indices are constructed specifically for this
purpose.
The ONS House Price Index (HPI) was developed to produce a consistent series of traded house
prices. Until its transfer to ONS in April 2012, the index was produced and published by the
Department for Communities and Local Government (DCLG). One of its main features is the mix‐
adjustment of the monthly transactions to remove the effect of changing composition of sold
stock. Since its conception the index relies on the use of mortgage transaction data, which
provides good coverage of the housing market but excludes those properties that are cash sales.
The mix‐adjusted HPI series start in 1969, when the index was calculated from a 5% sample of
the mortgage transactions of a number of building societies. From 1993 the coverage of
transactions increased from building societies to cover all mortgage lenders. In 2002 the index
started using hedonic regression to perform the mix‐adjustment (hedonic regressions are
explained in the next chapter). In 2003 the sample submitted by each mortgage lender was
expanded from 5% to cover all their recorded mortgage transactions. These mortgage
transactions are collected from the Regulated Mortgage Survey of the Council of Mortgage
Lenders (CML).
In December 2010 the National Statistician’s Review of House Price Statistics made a series of
recommendations. These were mainly driven by the availability of numerous official house price
statistics, which vary in their sample, methods and focus. The main recommendation was for the
development of a definitive official statistic. Additionally, there is a need for clearer explanation
of the methods used in the current statistics and how these relate to each other. The following
chapters of this article deal with explaining the methodology used in house price indices.
Office for National Statistics | 8Official House Price Statistics Explained
2. Overview of methods
This chapter gives an overview of the different methods that are used to construct house price
indices. First, it briefly discusses why specialised methods are needed for house prices that are
not used in all other price indices. It then continues with a description of the mix‐adjustment
with stratification matrix, hedonic regression, repeated‐sales measure and sale price appraisal
ratio (SPAR) methods. The chapter concludes by summarising which methods are used as official
statistics in different countries.
2.1 Peculiarities of house prices
There are some issues that make calculating a price index for properties very different from
other price indices. Firstly, in most price indices, the same products are priced in each period.
However, house price indices depend on prices collected from sales or valuations, and it is very
unlikely that the same property is traded or valuated in consecutive periods. Secondly, unlike
many other products no two properties are identical. Two houses on the same street might
differ in size, number of rooms or state of repair, all of which might impact the sale price agreed
between seller and buyer. Additionally, it is unlikely that the properties with the same features
are traded in the same locations in each period, resulting in changes in the composition of sales
from period to period. As both the features of the property and its location can impact prices,
using average sale prices or valuation estimates would result in a very unstable price index from
one period to the next.
The following methods have been identified as addressing these three issues. All of them
produce a consistent price index in consecutive periods and adjust for the change in the
characteristics of the properties being sold in each period. More detailed descriptions of the
methods can be found in the Eurostat manual for Residential Property Price Indices.
2.2 Mix‐adjustment with a stratification matrix
A solution put forward, amongst others, by the Australian Bureau of Statistics and previously
used in the DCLG House Price Index (currently the ONS HPI) until 2002 is the mix adjustment
with a stratification matrix. Stratifying involves dividing the sample of properties into subgroups
called strata. These groups are expected to have similar numbers of transactions and they must
be based on characteristics of the sample that are important when estimating property prices.
Collected together, the stratified sample will form a matrix. An example of a matrix of house
prices is shown in table 2.1.
Region 1 Region 2 Region 3
1 bedroom £85,000 £150,000 £95,000
2 bedrooms £110,000 £205,000 £145,000
3 bedrooms £135,000 £245,000 £190,000
Table 2.1. Average property prices three property sizes for three fictional regions.
A matrix might consist of a set of rows that represent different property sizes and a set of
columns that represent different regions. In the example in table 2.1, there are three regions,
Office for National Statistics | 9Official House Price Statistics Explained
and three property sizes defined by their number of bedrooms. The regions and property sizes
are the strata mentioned above. The combination of each property size and region forms a cell
for which an average price is collected. For example, in the first region the average price of a
one bedroom property is £85,000, while in the second region it is £150,000. By creating
averages for the same cells in each period we can remove the effect of many properties being
sold in a certain region, or of a certain size, in a particular period. The averages for the same
cells are calculated and the average prices for each cell are used to create sub‐indices. These
sub‐indices can then be aggregated into an overall index using weighted averages. This method
controls for changes in the composition of the sample like fluctuations in the number of sales by
region.
The main advantages of this method are:
‐ Simple to set up if the variables that form the strata are available from the data
sources.
‐ Easy to understand and assess.
The main disadvantages of this method are:
‐ The number of cells is limited. If too many cells are created the estimates will be less
reliable as there will be fewer observations in each cell.
‐ This method requires enough data to fill each cell; therefore the cells need to be
relatively similar in sample size.
‐ Good judgement is needed when choosing the variables that form the strata, as
different choices will lead to different estimates of property price.
2.3 Hedonic regression
A more sophisticated form of mix adjustment is achieved using standard statistical techniques,
and in particular hedonic regression models. In the case of a hedonic regression the properties
are defined in terms of a set of features or characteristics, each of which contributes to the
value of the property. For example, the presence of a garden, the number of bedrooms, or the
location of the property will all contribute to its value, but none of these features can be priced
in isolation. A regression model is used to estimate the value of each of these features from the
set of properties sold during a particular period. For example, the model might estimate the
effect that every additional bedroom and each different location have in the sale price in a
certain month. Then, the price of a particular property can be calculated by combining the
values assigned to each of its features. This method allows us to estimate the prices of
properties with every combination of features (such as number of bedrooms and regions), even
if that particular combination did not trade in the period. A number of variants of this method
are available, and they all control for changes in the composition of the sample. Some models
use an ‘average house’ model, which has the most common features of a traded property and
Office for National Statistics | 10Official House Price Statistics Explained
calculate its estimated price (e.g., a three bedroom semi‐detached house in a medium sized
town), while others estimate the prices of a large array of property features and aggregate these
to produce the different average house prices (resembling the stratification method). There are
many possible hedonic models, as each of them can have a different choice of features used to
estimate prices, a different set of weights to aggregate the prices, or slightly different formulae
used to estimate the contributions of the features.
Hedonic regression is widely used for estimating house prices. The Spanish statistical institute
(INE) publishes a quarterly house price index based on notary records. In Spain all property
transactions are recorded by a notary and therefore the source has full coverage. A number of
variables associated with each property are included, such as its size and location, and whether
it is a new or old property. These are then used in a hedonic regression to estimate house prices
in the different regions of the country. A similar approach is used by the German statistical
institute (DESTATIS), who use their Expert Committees for Property Valuation (an institution
regulated by federal law) to access data on property transactions across federal Germany. As
with the case of Spain, the data provides the statistics institute with a large number of relevant
variables. DESTATIS publishes separate indices for new and existing dwellings, prefabricated
dwellings, non residential buildings and land.
The main advantages of this method are:
‐ Efficient use of data. All the data contributes to estimating property prices.
‐ Controls for property mix changes in the sample and, if sufficient property features
are included, controls for quality changes.
‐ Price estimates can be produced for cells that have no recorded transactions in a
given period.
The main disadvantages of this method are:
‐ Requires a large number of property features to be available from the data source.
‐ Hedonic regression models can be implemented in many ways. The choice of
sources, property features that are used in the regression, the form of the
regression and the way that data are aggregated will all lead to slightly different
property price estimates.
2.4 Repeat sales method
Initially proposed by Bailey, Muth, & Nourse in 1963, this method makes use of the change in
the price of a property between its latest and its previous sale. For example, if a particular
property was sold in 2002 and then in 2012, the increase or decrease in price would be used to
calculate the index. One of the main features of the repeat sales method is that the index can be
constructed without needing as much information about individual properties as the
stratification and hedonic regression methods. For example, this method will work even if the
Office for National Statistics | 11Official House Price Statistics Explained
size of the property is not known. All that is needed to calculate the index is that the previous
and the current sale of the same properties can be matched.
This method has been widely used in the United States of America (USA), for example by both
the Federal Housing Finance Agency (FHFA) and Standard and Poor’s Case‐Shiller Home Price
Indexes. In the case of the FHFA the source of the data are the government‐sponsored
enterprises (GSE) Fannie Mae and Freddie Mac. These GSEs purchase the vast majority of
mortgages from the mortgage lenders in the USA and sell them in the financial markets as
mortgage‐backed securities4. This ensures that mortgage lenders receive money to provide
further lending for properties. By sourcing data from GSEs, the FHFA has a large coverage of USA
property data. The transaction data goes back as far as 1975, but the first repeat sales HPI was
calculated in 1988 once several years of data had been acquired. Since 2011 data from the
county recorder offices and FHFA itself have been added to this index.
The main advantages of this method are:
‐ The data source does not need many features of the property, mainly a reliable way
to identify the properties being transacted.
‐ The method does not rely on characteristics between properties matching, but uses
the exact property match to identify the change.
‐ It automatically controls for location and traded property mix.
‐ There is an extensive literature for this method. This includes established
frameworks to test house price growth and its standard errors.
The main disadvantages of this method are:
‐ The method can be data inefficient as a proportion of the sample is not used for the
calculation of the index. Of the traded properties in a particular period, only some
have been traded previously. However, the efficiency of the method will increase
over time as more sales are recorded in the database.
‐ Changes in the quality of the dwelling (refurbishments, depreciation due to age, and
extensions and conversions) are not automatically taken into account in the model.
Properties that are traded after a long period can have drastic changes in quality
which impact the estimated prices.
‐ Estimates might not be available for very finely defined property categories if sales
have for these have not been recorded in a period.
4
More information on mortgage‐backed securities and government‐sponsored enterprises can be found
at the US Securities and Exchange Commission: http://www.sec.gov/answers/mortgagesecurities.htm
Office for National Statistics | 12Official House Price Statistics Explained
‐ It is difficult to weight the method so that it takes account of different types of
stock. By default it will weight more heavily those properties traded most often
which can lead to biases.
‐ New properties are not taken into account as they haven’t been previously traded.
2.5 Sale Price Appraisal Ratio
In some countries properties are appraised regularly. Appraisals are typically carried out for the
purpose of estimating taxes linked to the property, and therefore tend to cover all the
properties in the country. The Sale Price Appraisal Ratio (SPAR) method makes use of these
appraisal values in order to produce a house price index. In general terms, SPAR methods use
the appraisal of all the properties as a reference period. After this period, as properties are sold
they are matched with their appraised value in order to create an estimate of the change in
value. The advantage of SPAR over a repeat sales method is that the change in price can be
calculated using all sold properties. The condition to this is that the properties had to exist when
the appraisal took place so that a comparison between their appraised and sold price can take
place. When a new appraisal is carried out, the index is rebased to this new reference period.
SPAR methods have been used in New Zealand since the 1960s and have also been adopted in
Denmark, Sweden, Iceland and the Netherlands.
In the case of the Netherlands, two sets of data are used to produce a SPAR index (see Statistics
Netherlands – Prices). One of the sets comprises the appraisals of properties carried out by local
authorities. These cover all the properties in the Netherlands and are produced every four years
for taxation purposes. The appraised data has a high correlation with sale price data, and this
correlation has been increasing with each appraisal (de Vries, de Haan, der Wal, & Mariën,
2009). The other set of data used to match to the appraised prices is data collected by the Dutch
Land Registry, which covers all property sales. The data is stratified by province and property
type, and for each of these a SPAR index is produced and then aggregated using weights.
The main advantages of this method are:
‐ It is efficient as it makes use of all the sale data, apart from those sales that cannot
be matched with an appraisal or those of properties built after the appraisal period.
‐ It is easy to implement from administrative sources if these are available.
‐ If property valuations are done frequently and these take into account substantial
improvements to the properties, this method can effectively deal with quality
changes.
‐ No information on the characteristics of the properties is needed.
The main disadvantages are:
‐ Appropriate sources with good coverage are required to implement this method.
Office for National Statistics | 13Official House Price Statistics Explained
‐ This method is very dependent on the quality of the appraisals. In many cases not all
the regions or all the appraisers use the same methods, which can lead to some
data being less comparable.
‐ If appraisals are infrequent this method cannot deal with quality changes.
2.6 International use of methods
Table 2.2 shows a sample of the different methods used by official statistics around the world.
Stratified cell Hedonic regression Repeated Sale price appraisal Other
matrix measures ratio
United Kingdom X (ONS, LPS) X (Land Registry) X (RoS)
Australia X
Austria X
Brazil X
Canada X (Teranet‐NBC) X (StatCan new
housing index)
Denmark X
Finland X
France X
Germany X
India X (weighted
price index)
Italy X
Netherlands X
Norway X
Spain X
Sweden X
United States of X
America
Table 2.2. A summary of the methods used by international house price indices. The UK has more than
one official index (discussed in Chapter 4), and Canada have a repeated sales index for existing dwellings
and a separate index for new built dwellings.
Office for National Statistics | 14Official House Price Statistics Explained
3. ONS HPI methodology
This chapter explains in detail the methodology used by ONS to produce the house price index
and its accompanying statistics. The methodology is provided in four main sections with the first
giving an overview of the methods applied and why. Section 3.2 details precisely what data are
used and Section 3.3 shows how the average price of a house is measured. Section 3.4
concludes with the final calculations for the HPI, the chain linked series and 12 month
percentage change.
3.1 Aim of the index
The aim of the ONS House Price Index (HPI) is to measure the change in the average house price
for owner‐occupied properties in the UK, its component countries and regions. The index is
constructed from transacted property prices and is calculated on a monthly basis. The index is
chain linked to produce an index series that allows comparisons to be made across years.
All dwellings have different characteristics that affect their price, such as location and size. As an
“average house” based on such characteristics does not exist in practice, the average house
price attempts to find the average price across all houses with differing characteristics. Each
characteristic has its own effect on the price of a house and this needs to be taken into account
when calculating the average house price. A suitable model to capture the effects of these
characteristics is a hedonic regression model, as described in Chapter 2. The main motivation for
using this technique is that due to the large number of combinations of housing characteristics
and the limited amount of data available on a monthly basis, it is widely acknowledged as the
best method to produce house price estimates. For example, there may be a combination of
characteristics for which no properties have been sold. A hedonic regression model developed
using the available data allows the average house price to be estimated for each possible
combination of characteristics (see section 3.3 for more details) in the absence of such data.
3.2 Data used in the estimation of the average house price
The data used to estimate the average house price come from a sample of mortgage
completions collected by the Council of Mortgage Lenders (CML) via the Regulated Mortgage
Survey. Although this survey covers all UK mortgage lenders, lenders covering 75%‐80% of the
mortgage market submit data that is used to calculate the HPI. Only mortgage transactions for
owner occupiers are included in the index; cash purchases are not included in the CML data set
but they account for a lower proportion of all houses purchased by owner occupiers. Buy to let
properties and remortgages are also excluded. The use of mortgage completions reflects the
prices currently being paid for dwellings purchased with mortgages. This then means that any
mortgage approvals that never advance to completion are not included. The use of data from
actual transactions provides a more reliable indication of house prices.
The size of the sample used is dependent on the number of mortgage completions in the month
of interest. Across the months of 2012 the average sample size was 27,000 transactions.
Office for National Statistics | 15Official House Price Statistics Explained
However, the housing market activity varies within the year; the summer months are typically
more active than the winter months, and the sample size fluctuates accordingly.
Unreliable data such as an extremely high price for a low price location can affect price
estimates. For this reason the data is first cleaned by investigating records that are highlighted
in a number of validation checks. Additionally, outliers (atypical values) are removed to reduce
the chance of dwellings with very low or very high prices within each unique combination of
characteristics distorting the index. All observations not identified as outliers are used to
estimate average house prices. In 2012, on average 0.1% of the typical sample was excluded
every month, either during the data cleaning or the outlier identification stage. For more detail
on how the outlier identification is performed see Annex B.
3.3 Measuring the average house price
The calculation of the house price index is based on first determining the average house price
for groups of dwellings with each particular set of characteristics, which are known as cells. The
average house price for each cell is calculated and these averages are then weighted together to
calculate the average house price for all dwellings. The method used to determine the average
house price and a description of how the cells are defined are given in section 3.3.1. A
description of how and why observation weights are applied to observations with missing data is
provided in section 3.3.2.
3.3.1 Determining the average house price for a given set of characteristics
The ONS house price index uses a hedonic regression model to predict the average house price
for a given set of characteristics (a “cell”, see above). This is a model that represents how the
change in the combination of characteristics affects the price of a house. A summary of the
statistical definition of the applied model is available in Annex A; whilst a full specification of the
hedonic regression model used to calculate the index is available on the ONS House Price Index
Guidance and Methodology webpage.
The characteristics used in the ONS regression model are:
Whether the property is an old or new dwelling
Type of dwelling (bungalow, detached, semi‐detached, terrace, flat)
Number of habitable rooms/number of bedrooms
Whether the buyer is a first time buyer or a former owner occupier
County or London borough
Office for National Statistics | 16Official House Price Statistics Explained
Type of neighbourhood (Acorn)5
Local authority
In addition to the seven characteristics used to estimate house prices in the regression model,
three interaction terms are also included.
Dwelling type x old or new property
Acorn group x Dwelling type
Acorn group x first time buyer or former owner occupier
An interaction between two characteristics can be described as the effect of one of the
characteristics on house price being different depending on the value of the other characteristic.
To demonstrate this, consider the following example.
In general, old properties are more expensive than new properties and detached properties are
more expensive than terraced properties. Additionally, the increase in price of a property being
old instead of new might be more pronounced in the detached properties than in the terraced
properties. This increase in price difference is called an interaction effect, and it shows that the
effect that house type has on price varies between old and new properties. Interactions often
capture more subtle effects in the data, such as increased prices of detached properties in
desirable urban locations.
The characteristics included in the ONS HPI model have all been found to be statistically
significant in explaining the variation seen in house prices and are therefore used to define the
cells. This means that each of the characteristics has a non‐negligible influence on price that is
unlikely to have occurred by chance. This level of influence is different for each characteristic. In
the ONS HPI “number of rooms” has more influence on house price than any other
characteristic, explaining the largest amount of variation in house prices. The three interaction
terms have also been found to be statistically significant. The characteristics used in the model
are, of course, limited to the information collected about properties and contained in the
mortgage transactions dataset.
To demonstrate the effect a characteristic may have on house price, figure 3.1 has been created
using house price data which shows how house prices might change as the number of bedrooms
increases.
5
ACORN is a geo‐demographic classification of all the neighbourhoods of the UK. It provides basic socio‐
economic information and is produced by CACI International Inc, More information can be found on
http://www.caci.co.uk/acorn‐classification.aspx
Office for National Statistics | 17Official House Price Statistics Explained
Figure 3.1: Scatterplot of number of bedrooms against house price with fitted regression line.
Figure 3.1 shows that as the number of bedrooms increases, house prices tend to increase (note
that in the actual ONS model the logarithm of the price is used, see Annex A). This general
behaviour can be described by fitting a straight line through the data points using simple
regression. The location of this line is determined so that it minimises the deviation of the data
points from the line. The line in Figure 3.1 is therefore an example of a linear regression model
which best represents the relationship between the variables “number of bedrooms” and
“house price”. For a given number of bedrooms, the regression model can then be used to
predict the price of a house, and it is this prediction which is taken as the “average price”. Even
though the data may not contain an observed price for a particular type of house, the price can
still be estimated based on its characteristics. For example, if there were no prices recorded for
properties with five bedrooms, the line provides a good estimate of the average price for this
type of property.
This is an example of simple linear regression which has only a single predictor variable (number
of bedrooms) for describing the price of a house. However, number of bedrooms is only one of
the seven characteristics used to predict house prices in the model and hence is only one of the
many effects these characteristics can have on house prices. The basic principle of regression is
demonstrated above, but the example below considers how multiple characteristics may affect
house prices.
Let’s consider how the change in two characteristics can affect the price of a house. For
example, take the two properties below with the same characteristics apart from location.
Office for National Statistics | 18Official House Price Statistics Explained
House 1: £200,000 House 2: £188,000
• Semi detached • Semi detached
• Old build • Old build
• 3 bedrooms • 3 bedrooms
• First time buyer • First time buyer
• Location A • Location B
In location A the house sells for £200,000; a house with the same characteristics in location B
sells for £188,000. With all other characteristics being equal, the location has had an effect on
price. Now, let’s say a third house has 4 bedrooms and is situated in location B.
House 3: £195,000
• Semi detached
• Old build
• 4 bedrooms
• First time buyer
• Location B
This third house sells for £195,000. A change in two of the characteristics has had a different
effect on the original price of house 1. The effects of all the available characteristics need to be
combined in order to model house prices in an effective way. A hedonic regression model takes
into account the different combinations of characteristics and how each combination affects the
price of a house.
As there are seven different predictor variables and three interactions in the ONS HPI model,
this generates a very large number of combinations of characteristics. There are approximately
100,000 different cells (a cell could, for example, be a new one bedroom flat, situated in a
wealthy borough of London, purchased by a first‐time buyer) and the hedonic model is used to
calculate a mean house price for each cell. For some of these 100,000 cells there will not be any
observed data in a particular month. The hedonic regression model allows the prices for these
cells to be predicted so that each unique combination of characteristics has its own average
house price. This gives coverage of all house types and not just the houses sold in one month,
which may not be representative of houses traded over a longer period of time. The average
Office for National Statistics | 19Official House Price Statistics Explained
house price for each cell is then weighted together using transaction weights to give an overall
average house price (see section 4.1).
3.3.2 Observation weights
For most transactions the dataset contains all the values of the characteristics; however, in a
few cases, there are missing data for one or more of the variables. Both complete and
incomplete observations are used in the ONS regression model, but incomplete observations
have less influence on the model. The influence of the characteristics on the price is
implemented as a weight, with more important characteristics having higher weights. This
makes the hedonic regression, in practice, a weighted regression model. The weights are
referred to as observation weights, and the estimation of these weights is described in Annex C.
A different observation weight is assigned according to the combination of missing data for
house characteristics and how important the missing data is in predicting house prices. If the
data missing are considered to be very important, then this observation will be assigned a small
weight. In the same way, missing data of low importance will mean that a higher weight is
assigned to the observation. The 'importance'' is decided by comparing model fits using only
complete observations and regression models which use different combinations of the
characteristics. Complete observations have an observation weight of one and observations
with missing characteristics have an observation weight between zero and one.
New observation weights are calculated annually and introduced into the January HPI. The data
used for observation weight calculation is the October and November data sets from the
previous year. For further detail on weight calculation see Annex C.
3.4 Calculation of the House Price index
To calculate an average house price for all dwellings, the average house prices calculated for
each of the cells need to be combined. The calculation of the average house price for all
dwellings is described in section 3.4.1. Section 3.4.2 then describes the use of the average house
price for all dwellings to calculate the house price index. Sections 3.4.3 and 3.4.4 go on to
describe chain linking and twelve‐month percentage change respectively.
3.4.1 The Average House Price
To ensure that the HPI reflects a pure change in the price of houses and not just the change in
the composition of houses sold in that month, the average house price is mix adjusted. Mix
adjustment refers to determining the average house price for a dwelling with a particular set of
characteristics (a cell) and combining these average house prices using weights. The weights
used in the ONS HPI are based on the number of transactions of every type of property in the
past three years.
The way in which a change in the composition of houses sold can distort the index can be easily
demonstrated. For example, if by chance in a month more expensive properties were sold than
in the previous month, using a simple (unweighted) arithmetic mean would indicate that the
Office for National Statistics | 20Official House Price Statistics Explained
average house price had increased even if the prices of houses had remained the same.
Consider the following table:
Month 1 Month 2
House Number Sold Average Price House Number Sold Average Price
A 20 £100,000 A 20 £100,000
B 30 £200,000 B 30 £200,000
C 10 £300,000 C 10 £300,000
D 1 £500,000 D 5 £500,000
Total 61 £11,500,000 65 £13,500,000
Average House price £188,525 Average House price £207,692
Table 3.1: Comparison of arithmetic means over a time period when house prices do not change.
In month 1, the arithmetic average of the four types of houses sold is £188,525. A month later
the same number of houses of types A‐C are sold again for the same price with an additional
four of house type D. House prices have not changed in this one month period. The average
house price in month 2 is now, however, £207,692. The increase in average house price is due to
a larger frequency of sales of the more the expensive property type D. This demonstrates how
changes between periods in the number and type of transactions can affected the calculated
average price. In the example house prices appear to have risen, when they actually stayed the
same. This method is therefore misleading and an alternative method should be used whereby
the numbers of the different types of transactions (the transaction weights) are held fixed
between successive periods. Using fixed weights means that the results are not dependent on
which types of houses are sold in a particular month.
Transaction weights are applied to the average house price for each cell to give an arithmetically
weighted average house price. They are calculated each January based on the previous three
calendar years and are fixed for the remainder of that year. As the weights reflect a different
mix of properties, price comparisons between years have to be carried by chain‐linking (see
3.4.3). The HPI better reflects the current housing market trends by carrying out this weight
update. A transaction weight will be high if that house type had a high frequency of sales.
Similarly a house with a particular combination of characteristics that has a low frequency of
sales will be given a low weight. This is demonstrated in table 3.2.
Office for National Statistics | 21Official House Price Statistics Explained
Number Sold Over Previous Transaction
House 3 calendar years weight
A 200,000 0.32787
B 300,000 0.49180
C 100,000 0.16393
D 10,000 0.01639
Total 610,000
Table 3.2: Calculation of transaction weights.
The transaction weights calculated in table 3.2 for each of the houses A‐D are then applied to
the average price of these houses. The average house price is the sum of the prices multiplied by
the corresponding transaction weights. For a technical definition see Annex D.
Month 1 Month 2
House Transaction Weight Average Price House Transaction Weight Average Price
A 0.32787 £100,000 A 0.32787 £100,000
B 0.49180 £200,000 B 0.49180 £200,000
C 0.16393 £300,000 C 0.16393 £300,000
D 0.01639 £500,000 D 0.01639 £500,000
Average House price £188,525 Average House price £188,525
Table 3.3: Using mix adjustment to calculate average house prices.
In table 3.1, the composition of houses sold indicated an increase in house prices when the
prices did not change. Table 3.3 shows that when the fixed transaction weights are applied, the
average house price stays the same, consistent with the house prices staying the same.
3.4.2 The House Price Index
The House Price Index is calculated as the weighted average house price for all dwellings in the
current month divided by the weighted average house price for all dwellings in January of the
same year, known as the base period. This result is multiplied by 100 so that indices below 100
show prices lower than those in the base period, and indices above 100 show prices higher than
those in the base period. See Annex E for the mathematical formula defining the index.
3.4.3 Chain Linking
An index based on the most recent January is calculated each year, starting with January of the
base period, which always equals 100, and running up to January of the following year. These
January based indices are “chain linked” from one year to the next in order to create an index
series that is continuous and on the same scale. January is the month designed as base as this is
the month that the weights are updated. This means each January will have a house price index
of 100 before chain‐linking is performed.
Office for National Statistics | 22Official House Price Statistics Explained
The index series in any year is scaled to the previous year by multiplying the chain‐linked value
of the index in the most recent January by the index in each month. For example using the
following data set, the March house price index can be calculated before and after chain linking.
Average Index (not Index
Period House Price linked) (linked)
Jan‐04 (2003 weights) 163,645 109.7 135.4
Jan‐04 (2004 weights) 162,559 100.0
Feb‐04 160,937 99.0 134.1
Mar‐04 161,306 99.2 134.4
Apr‐04 168,600 103.7 140.5
May‐04 170,719 105.0 142.2
Jun‐04 173,756 106.9 144.7
Table 3.4: Linked and non‐linked HPI (rounding has been applied to one decimal place).
The house price index prior to chain linking for March 2004 would be:
2004 161,306
100 100 99.2
2004 162,559
After chain linking the house price index in March 2004 would be6:
2004 135.41880
2004 99.22971 134.37
2004 100.0
For a more technical definition of chain linking see Annex F.
3.4.4 Twelve Month Percentage Change
In order to make year on year comparisons of house prices, a twelve month percentage change
of the HPI is calculated. This is calculated as the house price index in the current period
compared to the house price index in the same month from the previous year.
This is demonstrated in the following example:
In January 2004 the house price index was 135.4 and in January 2005 the average house price
had increased to 148.9. The 12 month percentage change would then be calculated as:
148.9 135.4
100 9.97
135.4
6
Figures used for this calculation have been rounded to five decimal places to avoid rounding error in the
answer incurred when using figures rounded to one decimal place.
Office for National Statistics | 23Official House Price Statistics Explained
This would mean within the year from January 2004 to January 2005 house prices increased by
10%.
3.5 ONS HPI Publication
The ONS HPI follows a monthly publication schedule. At the time of publishing only the data
from the month previous to the last is available, for example, in June the April data will be
available. Therefore, the publication of the ONS HPI is lagged by two months. Each month the
above methodology is used to produce average house price estimates and price indices at a UK,
country and regional level. The house price data are also disaggregated by type of buyer (first‐
time buyer and former owner‐occupier) and type of dwelling (new build and pre‐owned).
Currently the publication date coincides with the publication of both consumer and producer
price indices (CPI and PPI). Full details of the ONS house price index publication can be found on
the ONS website.
Office for National Statistics | 24Official House Price Statistics Explained
4. Differences between other official statistics and ONS HPI
This section reviews the methods used by official sources for house price indices in the UK. The
different methods and the resulting price levels and index movements are compared with those
of the ONS HPI. The official statistics covered are the Property Price Indices produced by Land &
Property Services (LPS) in conjunction with the Northern Ireland Statistics and Research Agency
(NISRA), Land Registry (LR), and Registers of Scotland (RoS).
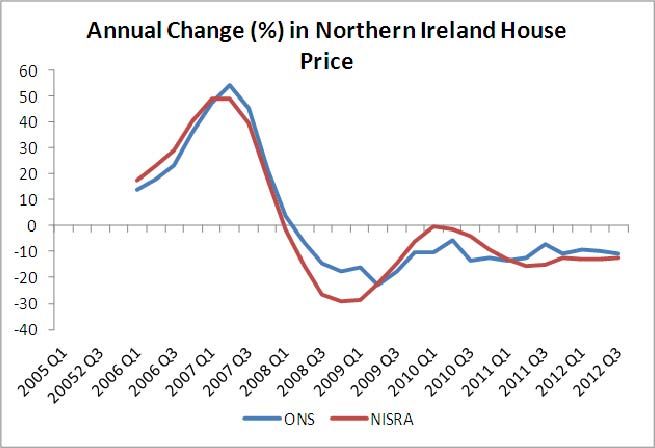
4.1 Northern Ireland Residential Property Price Index (NI RPPI)
LPS/NISRA Northern Ireland Residential Property Price Index (NI RPPI) uses a similar approach to
ONS in terms of modelling the effects of several variables on the price of houses. However, their
hedonic regression model is more detailed for Northern Ireland than the ONS model. For
example it has more specific regions and includes floor space in the characteristics that can
affect house prices.
LPS also has access to a more complete data set regarding sales of properties than the ONS does
for Northern Ireland, holding approximately three times the number of transactions. The LPS
dataset holds information on all sales; this covers owner occupiers buying with a mortgage or a
remortgage and cash purchases. LPS includes buy‐to‐let sales, which, together with
remortgages, are removed from the ONS dataset. Another reason why the LPS dataset is larger
than the ONS dataset is because it includes information from mortgage lenders whose activities
are limited to Northern Ireland and cash sales. However, LPS does not identify or account for
cash sales in their model so their impact is difficult to assess. It is likely that these differences,
especially the inclusion of cash sales and remortgages, go part of the way to explaining why
Northern Ireland prices are lower in the LPS dataset than in the ONS dataset.
Once the estimated prices have been produced by their respective hedonic regression models,
LPS and ONS use different methods to aggregate together these estimated prices. ONS relies on
an arithmetic average, while LPS uses a geometric average. Given the same values, geometric
averages will be lower, leading to a lower estimate of average price compared to the ONS price.
For their weights, LPS uses the proportions of each model characteristic from the transactions
within the last year to build an ‘average property’ for which a price is estimated by applying the
parameters from the hedonic regression model. ONS takes a slightly different approach by
estimating prices for all the different property combinations and applying weights based on the
transactions of the three previous years to aggregate them into average properties. Both
approaches are in practice very similar, with the main differences being the period of the
weights (one or three years) and the aggregation method (arithmetic or geometric). These
differences in aggregation formula are known to produce a significant difference between
average house prices, with the NI RPPI average house price being lower than the ONS average.
The ONS estimates a single model for all property types included in the mortgage data set, with
type of property included as one of the factors influencing price. LPS estimates separate models
for houses and apartments as in their dataset the floor space is measured differently for
apartments and there are extra characteristics which have been shown to affect the price of
Office for National Statistics | 25You can also read


